Automatic Data Processing (ADP) Has Risen in 9 of 10 Midterm May Windows Starting May 7
Automatic Data Processing is heading into a historically strong 27-day midterm-election seasonal window even as the stock trades about 34.0% below its 52-week high.

What is the seasonal pattern for Automatic Data Processing (ADP)?
Automatic Data Processing has risen in 9 of 10 midterm-year windows starting May 7, with an average gain of 4.64% in winning years.
- 9 for 10 in this window, with winning years averaging 4.64% gains over the 27-day stretch.
- The upcoming pattern runs from May 7 for 27 trading days and is grouped across the last 10 midterm election years.
- Percent Profitable is 90%, with 9 winners and 1 loser across the historical sample.
- Avg Profit - All, which includes both up and down years, comes in at 4%, only slightly below the winners-only average.
- Intraperiod swings have been meaningful, with several years showing sharp favorable moves alongside occasional deeper drawdowns.
- The setup is long-only, aligning a bullish seasonal bias with a stock that is currently well off its 52-week high.
According to historical data from TradeWave.ai, this midterm-year stretch for Automatic Data Processing has behaved differently from an average month on the calendar. The next section walks through how that pattern has played out in prior cycles and what it means for the coming weeks.
How has Automatic Data Processing (ADP) traded in this midterm-year May window?
Automatic Data Processing has risen in 9 of the last 10 midterm election years during the 27 trading days starting May 7, a run that would catch most investors by surprise. Shares last closed at 210.79, leaving the stock about 34.0% below its 52-week high of 319.15 and roughly 12.0% above its 52-week low of 188.16.
The presidential election cycle matters here because this pattern only looks at midterm election years, when policy uncertainty and rate debates often peak before easing into the year before the presidential election. Pattern phase and calendar phase are aligned: the data covers the last 10 midterm election years, and 2026 is itself a midterm year, so the upcoming window sits squarely in that same part of the political and policy calendar.
Across those 10 midterm-year samples, Automatic Data Processing has posted a 90% win rate, with 9 winners and just 1 loser in this May-to-June stretch. Average gains in the winning years are 4.64%, while including the lone down year pulls the all-years average to 4%, which is still a solid positive skew for a 27-day holding period. The median outcome of 4.1% lines up closely with those averages, suggesting the typical year has delivered a mid-single-digit move rather than relying on one or two outliers.
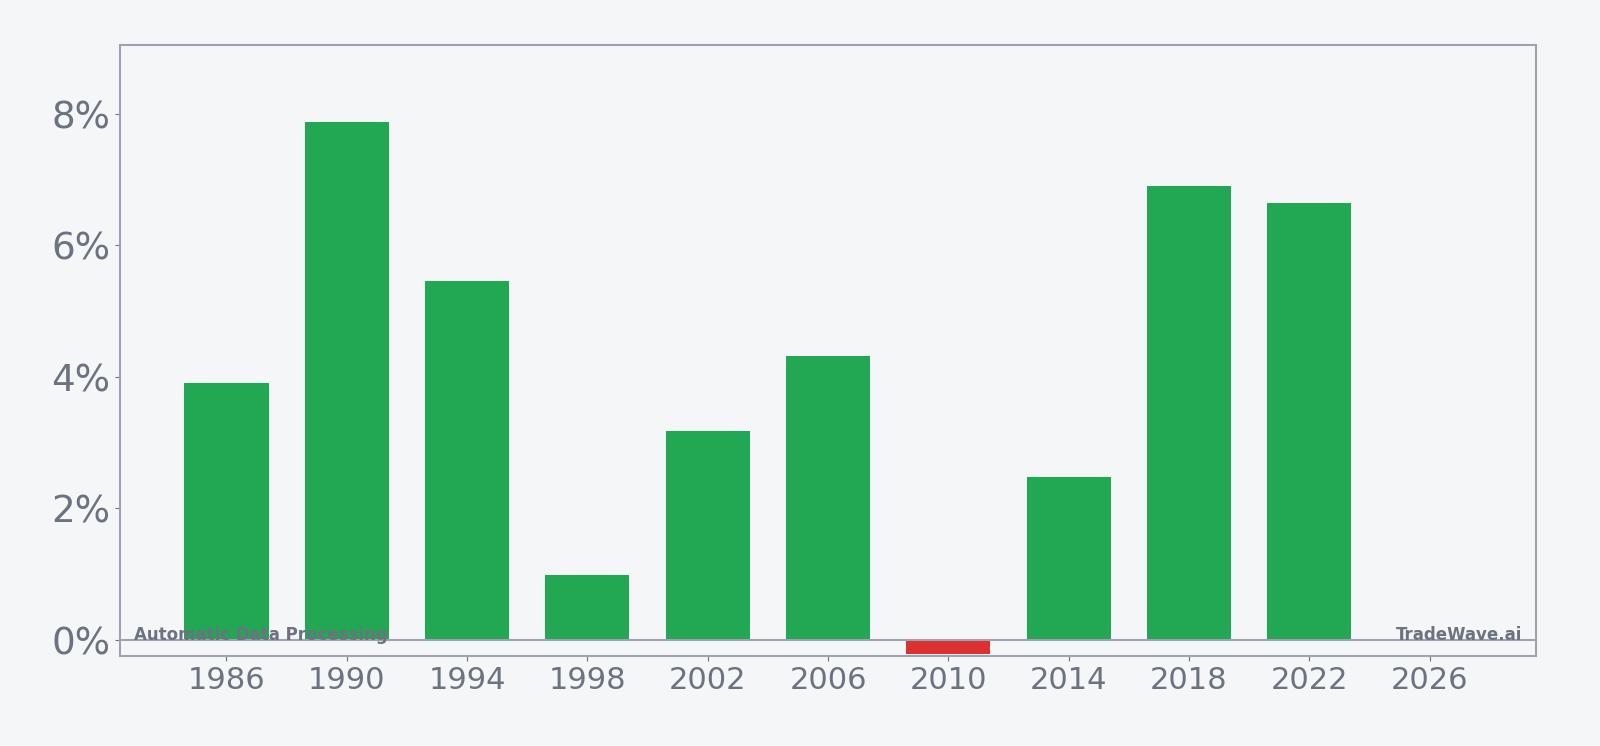
The per-year breakdown shows how consistent that ADP seasonal trend has been. In 1990, the stock gained 7.87% in the window, while 2018 and 2022 delivered 6.91% and 6.64% respectively, all in midterm election years. The only losing instance was 2010, when the stock slipped 0.22% over the period, a modest decline that barely dents the broader pattern.
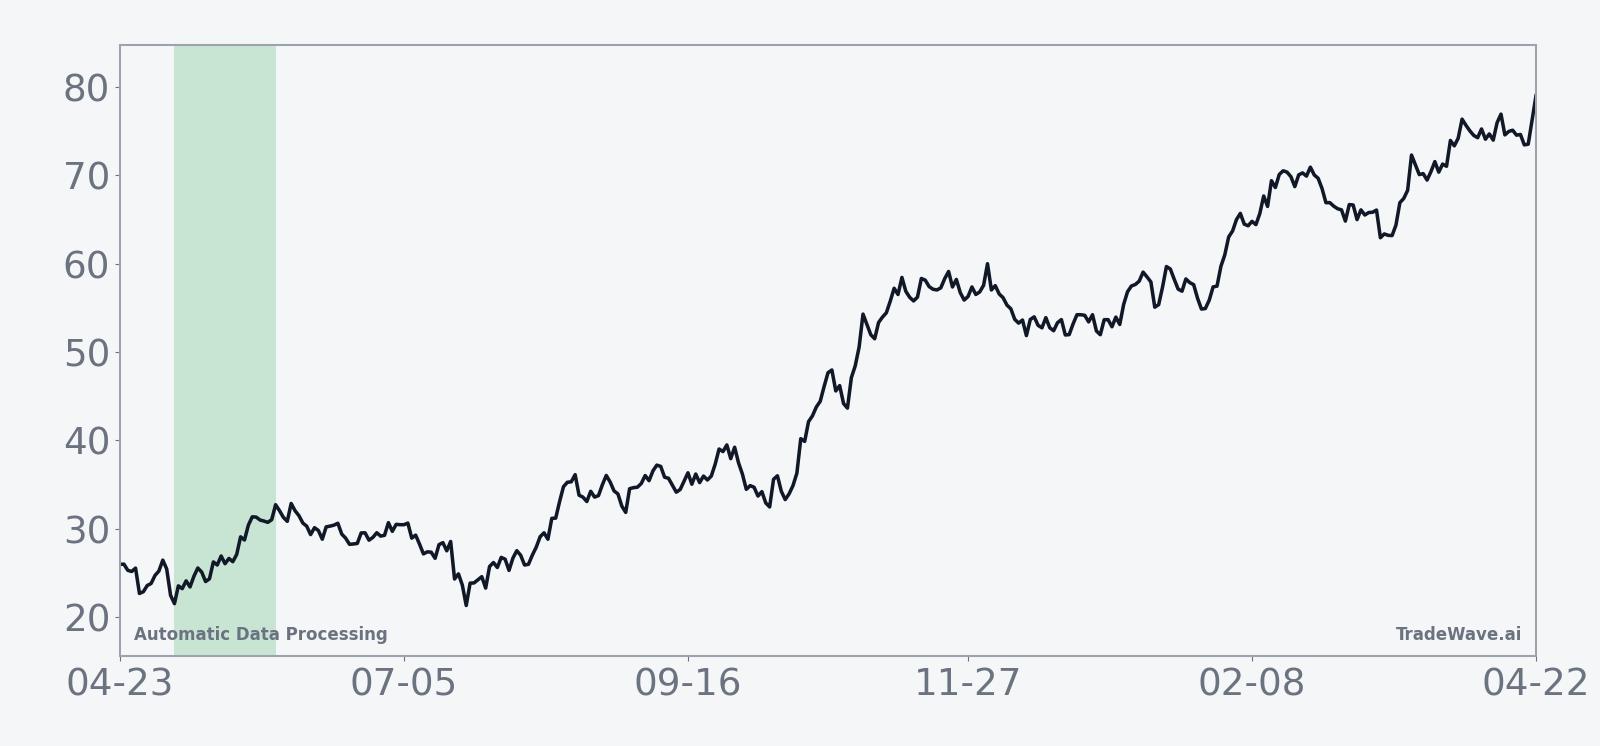
The historical seasonal average curve slopes higher through most of the 27-day span, with gains tending to build rather than spike and fade. In several years, including 1990 and 2018, the strongest part of the move came in the middle of the window, while 2022 showed a steadier climb from entry to exit. That mix points to a bullish bias that does not depend on a single calendar day but instead reflects a broader cluster of buying interest in this part of the midterm year.
A combined view of net returns and intraperiod swings shows how upside and downside have traded off inside the window.
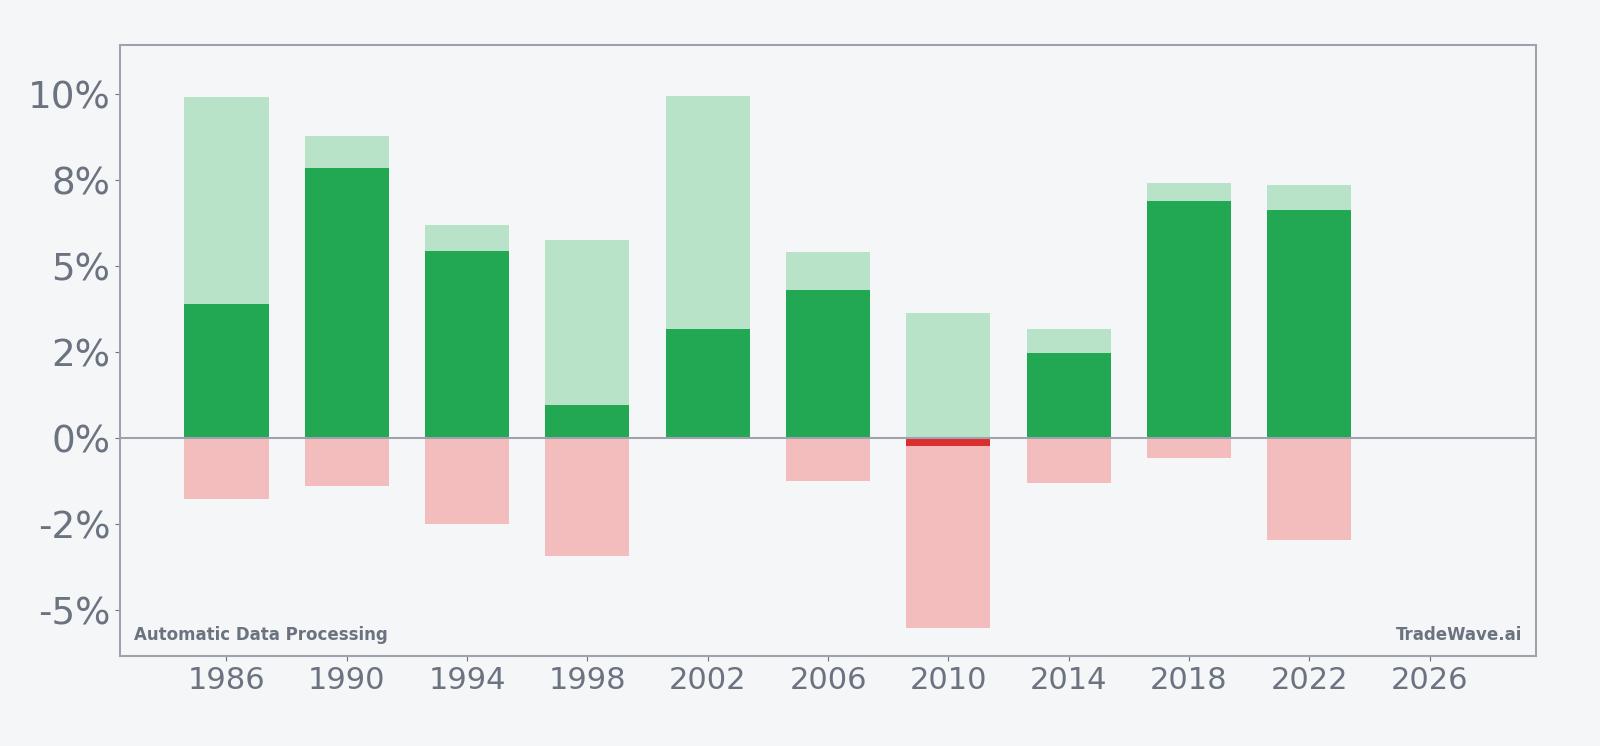
The combined net, MFE and MAE bars show that in strong years like 1986, 1990 and 2002, Automatic Data Processing often saw maximum favorable moves near or above 8% within the window, while adverse excursions typically stayed contained in the low single digits. The outlier on the downside is 2010, where the worst intraperiod drawdown reached about 5.51% even though the final loss was only 0.22%, a reminder that underwater periods can be deeper than the closing result suggests. Overall, the pattern has paired a clear upside tilt with manageable but non-trivial downside swings.
History does not guarantee future results; adverse excursions (MAE) can be large even in winning windows.
Why does Automatic Data Processing (ADP) follow this seasonal pattern?
One likely driver is the way midterm-year earnings and guidance updates cluster for business-services names around late spring, when companies refine full-year outlooks and investors recalibrate growth expectations. Analysts have also pointed to institutional portfolio repositioning in midterm years, as managers adjust exposure to defensive, cash-generative stocks like Automatic Data Processing ahead of the more risk-on year before the presidential election. This pattern may reflect that combination of earnings visibility and rotation into stable payroll and HR outsourcing demand as policy noise peaks.
What is driving Automatic Data Processing (ADP) today?
Automatic Data Processing last changed hands at 210.79, down 0.25% on the day, after trading between 206.74 and 211.23 on volume of about 1.32 million shares, below its 20-day average of roughly 2.97 million. That leaves the stock about 34.0% below its 52-week high of 319.15 and roughly 12.0% above its 52-week low of 188.16, with the 50-day moving average sitting near 206.91, just under the current price.
The chart below situates the latest move in its recent multi-month context and overlays the next 60 days of seasonal projections.
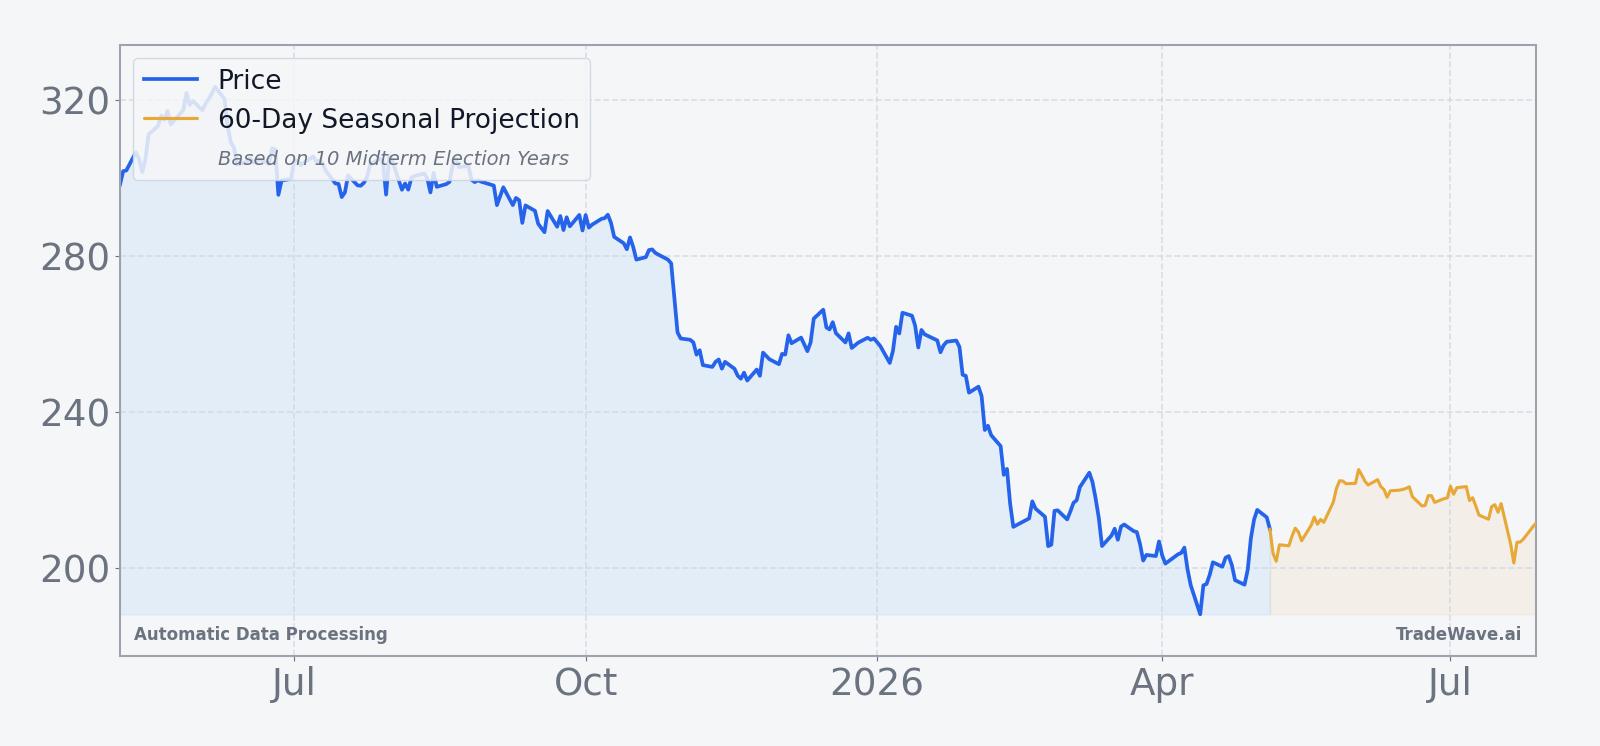
From a positioning standpoint, the stock has been grinding higher over the past month, with a 3.43% one-month return that pulled it back above its 50-day moving average. That puts Automatic Data Processing in a constructive but not overheated spot heading into the May 7 seasonal window, with room on the chart between current levels and the prior 52-week high if the historical pattern repeats.
What should traders watch in this ADP seasonal window?
The first marker is how Automatic Data Processing behaves around the May 7 entry date relative to its 50-day moving average near 206.91. In prior midterm years, stronger windows often saw the stock hold or quickly reclaim short-term support before building gains through the middle of the period, while the lone losing year featured a deeper early drawdown before stabilizing.
Second, watch the size of intraperiod swings versus the historical template. In years like 1990 and 2002, maximum favorable moves approached 9% to 10% while maximum adverse excursions stayed closer to 1% to 2%, a profile that signaled persistent buying pressure. If this cycle instead starts to resemble 2010, with a sharper early drawdown of 4% to 5% inside the window, that would mark a clear deviation from the typical bullish ADP seasonal trend even if the final result ends up flat.
Finally, the broader policy and macro backdrop of the midterm election year will matter. If rate expectations or labor-market data tighten financial conditions into early summer, investors may lean harder on recurring revenue names like Automatic Data Processing, which has historically benefited in this specific midterm-year slice. A clean hold above the 200 level with rising volume through late May would be more in line with the 9-for-10 historical pattern, while a break back toward the 52-week low band would argue that this cycle is diverging from the usual script.
Sources
About this seasonal analysis
Seasonal pattern data is sourced from TradeWave.ai, which analyzes historical price behavior across annual calendar windows going back up to 30 years. Read the full data methodology or the book The 100-Year Pattern by Afshin Moshrefi (2026 edition). Past performance of seasonal patterns does not guarantee future results. This article is for informational purposes only and does not constitute investment advice.