Jefferies Buy Call on PPL Corporation (PPL) Meets 7-for-7 Midterm Winning Stretch From May 20
PPL Corporation is heading toward a 97-day midterm-election-year seasonal window that has never been negative in the past, with shares trading just below their recent high.

What is the seasonal pattern for PPL Corporation (PPL)?
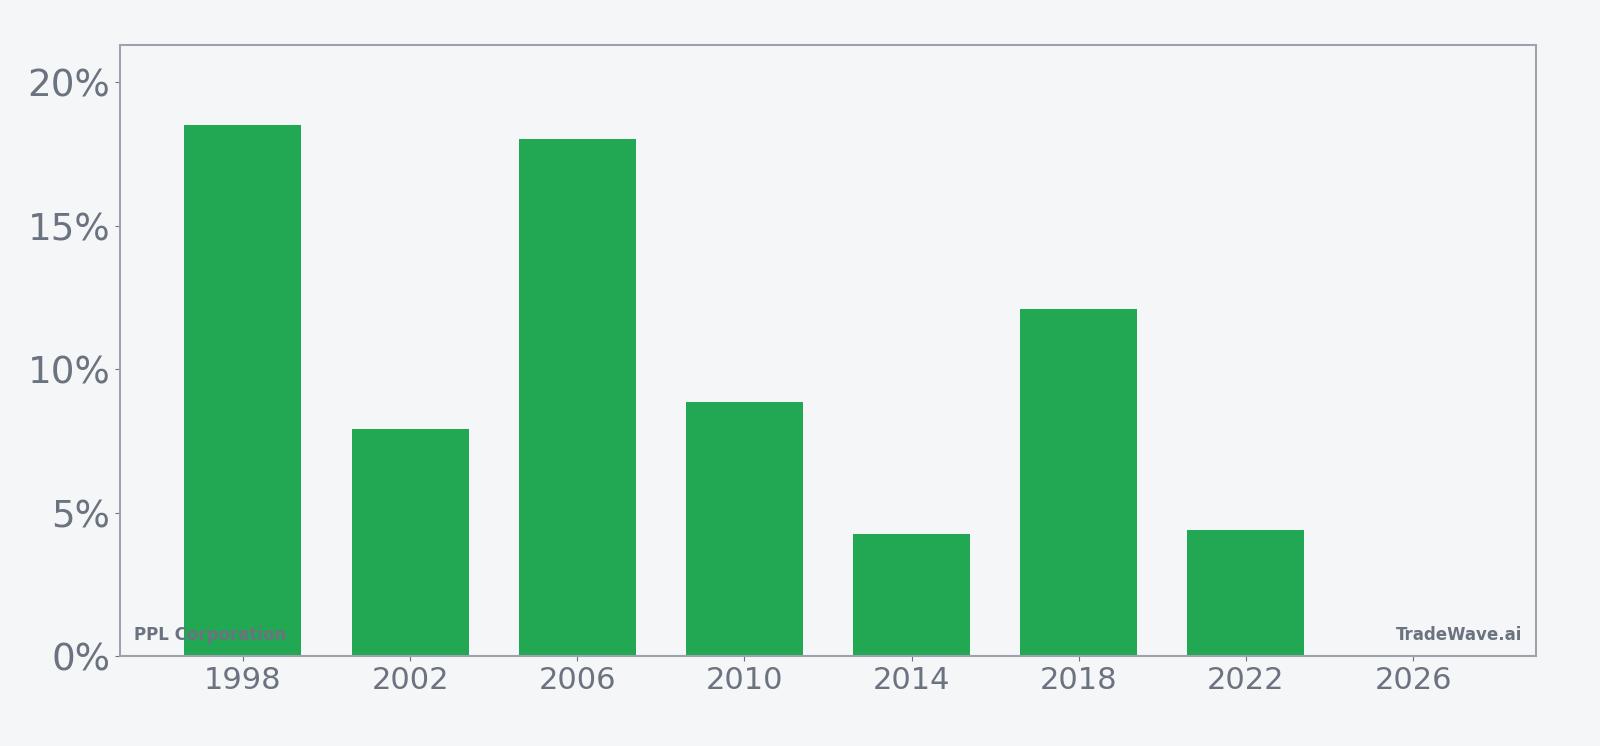
PPL Corporation has risen in 7 of 7 midterm-election-year windows starting around May 20, with an average gain of 10.6% in winning years.
- 7 for 7 in this window, averaging 10.6% gains in winning years across the last seven midterm election cycles.
- The upcoming pattern window begins May 20, 2026 and runs for 97 trading days, covering late spring into early fall.
- Percent Profitable is 100%, with 7 winners and 0 losers across the historical sample.
- Individual years have ranged from a 4.27% gain in 2014 to an 18.53% gain in 1998, showing a consistently positive PPL seasonal trend.
- Intraperiod swings have been meaningful, with some years seeing double-digit drawdowns before finishing higher.
- The TradeWave Ratio of 1.83 and Sharpe ratio of 1.62 point to historically strong, risk-adjusted upside in this PPL Corporation trading window.
According to historical data from TradeWave.ai, this midterm-election-year stretch for PPL has behaved very differently from an average summer, and the next iteration is about to open.
How has PPL Corporation (PPL) traded in this midterm-year window?
PPL Corporation has risen in all seven midterm-election-year windows that start around May 20 and last 97 trading days, averaging 10.6% gains for long positions. Shares finished Monday at 37.815, up 0.6% on the day and about 5.7% below their 52-week high of 40.105.[1]
Grouping the data by the presidential election cycle matters here because utilities often respond to policy and rate expectations that shift with Washington’s timetable. This pattern looks only at the last seven midterm election years, which line up with the same phase of the four-year political cycle that investors are in today.
Historically, this 97-day stretch has been a clean long-only story for PPL. Percent Profitable is 100%, with 7 winners and 0 losers, and the average gain across those years is 10.6%. The median outcome is an 8.87% rise, which shows that the typical year has been solidly positive rather than skewed by a single outlier.
The strongest year in the sample was 1998, when PPL gained 18.53% in the window, with a maximum favorable move of 25.88% from the entry price before settling back.[1] The weakest winning year was 2014, which still delivered a 4.27% gain, suggesting that even the softer midterm-year outcomes have been positive for long exposure.
Intraperiod volatility has not been trivial. In 2002, the stock finished the window up 7.93% but at one point traded 25.01% below the entry level, the deepest maximum adverse move in the sample.[1] In 2022, PPL ended the period with a 4.41% gain after a worst drawdown of 13.7%, showing that even winning years can involve double-digit downside before the pattern plays out.
The maximum favorable excursions have tended to be larger than the final net gains, which is what the TradeWave Ratio of 1.83 is capturing. That metric signals that, within the window, price has typically traveled meaningfully in the trade direction at some point, even if it did not close at the intraperiod high.
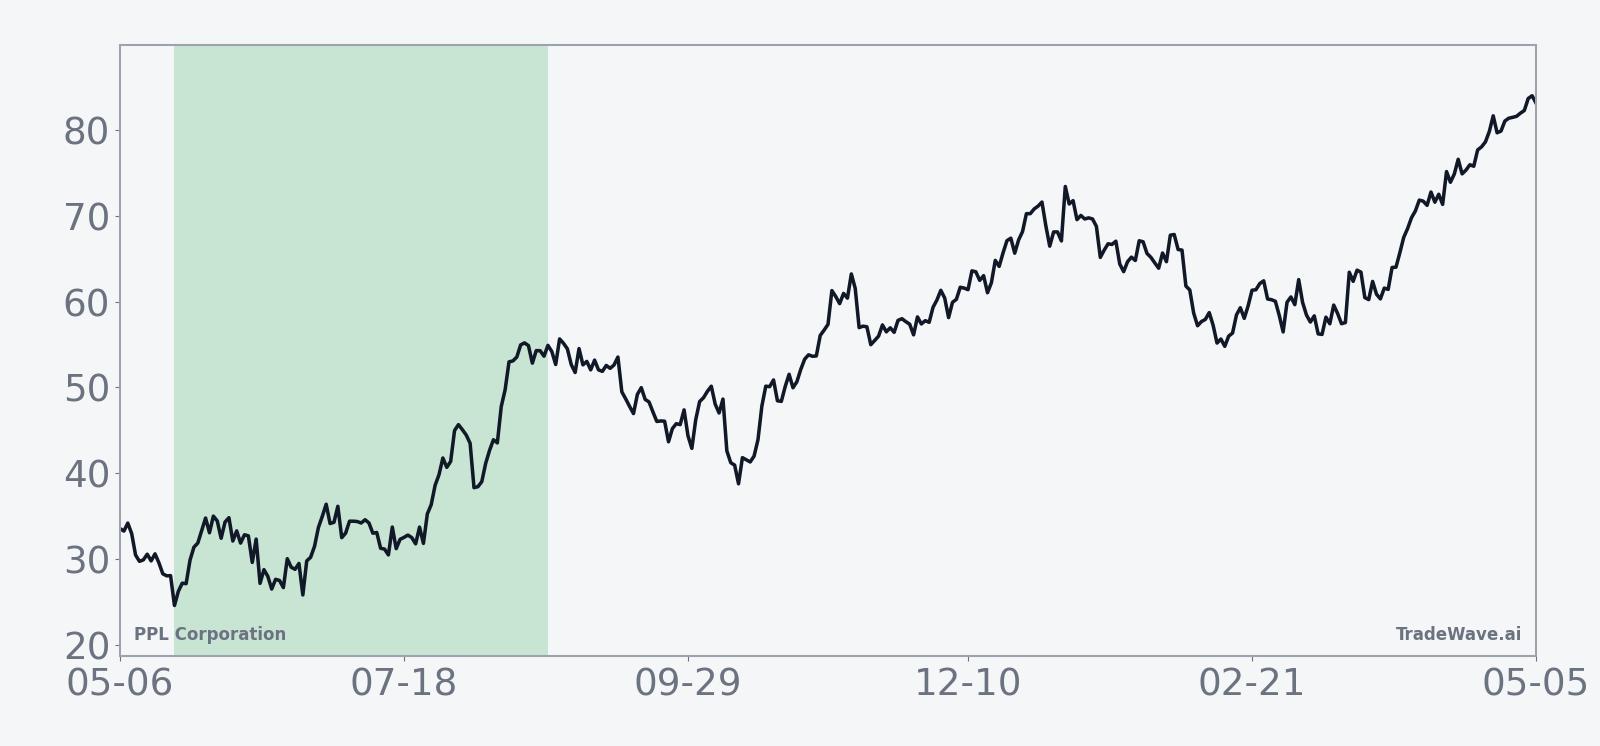
The historical seasonal average trend line slopes steadily higher across the 97 days, with much of the cumulative gain accruing in the middle of the window rather than in a single burst. That profile suggests a tendency for PPL to grind higher through the heart of the summer in midterm years, even when the broader market is choppy.
A per-year view of net returns and intraperiod swings shows how consistently the pattern has favored longs while still delivering sizable drawdowns in some cycles.
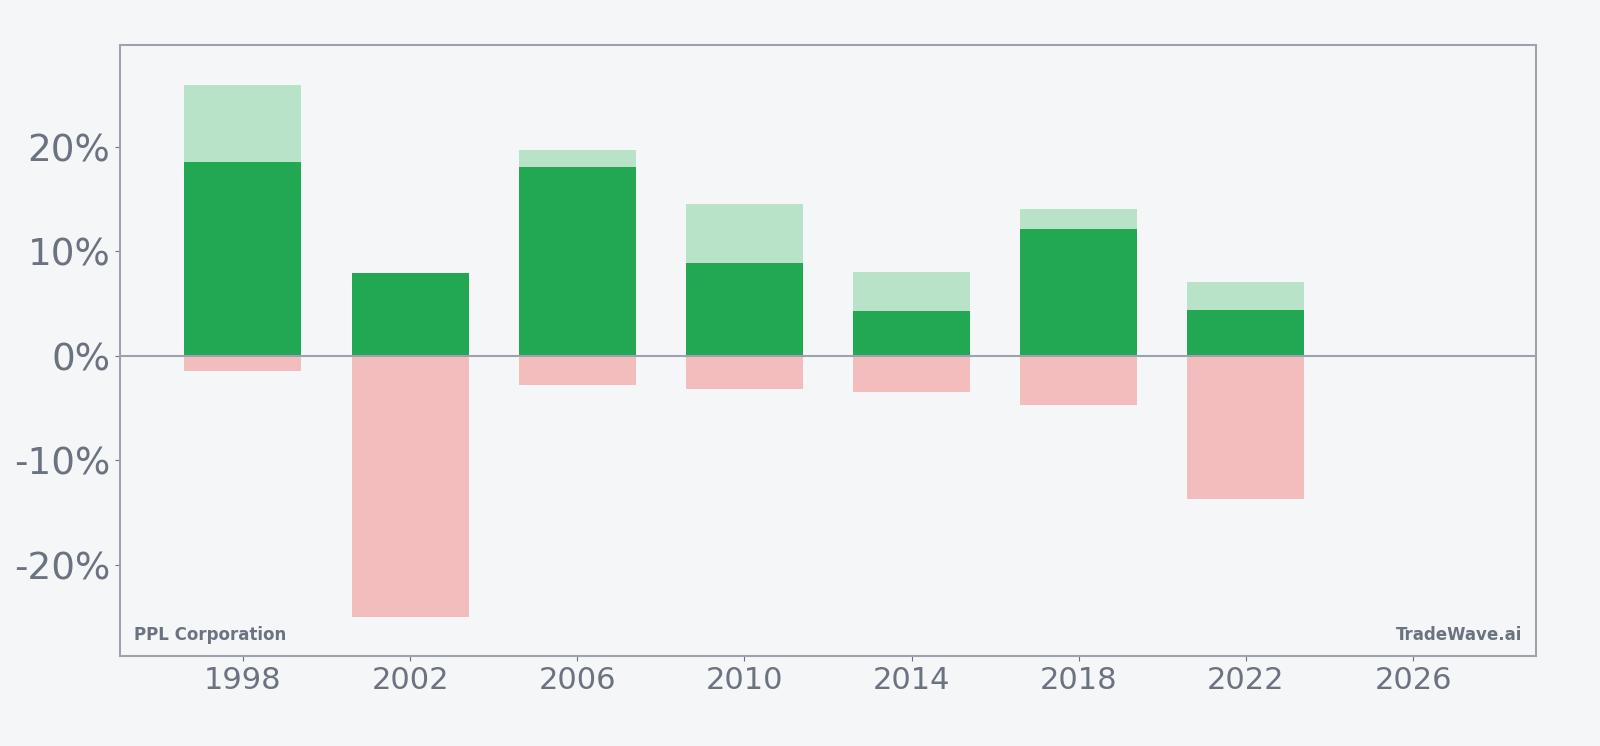
The stacked view of net results, maximum favorable moves and maximum adverse moves shows a clear pattern: every year finished green, but several saw sharp downside before recovering, while upside spikes often overshot the final close. Add it up: seven straight midterm-election-year windows have rewarded long exposure, but they have not been smooth rides.
History does not guarantee future results; adverse excursions can be large even in winning windows, and traders should size positions with that intraperiod risk in mind.
Why does PPL Corporation (PPL) follow this seasonal pattern?
One likely driver is the way utility stocks respond to the midyear policy and rate backdrop in midterm election years, when Washington often shifts focus from early-term agenda items to fiscal positioning ahead of the next campaign. Analysts have also pointed to institutional portfolio rebalancing into defensive sectors like utilities during periods of macro uncertainty, which often cluster in the middle of the political cycle. For a regulated utility such as PPL, that combination of rate expectations, regulation headlines and sector rotation may help explain why this specific late-spring-to-early-fall window has been so consistently positive in past midterm years.
What is driving PPL Corporation (PPL) today?
PPL closed Monday at 37.815, up 0.6% on the session, with roughly 7.4 million shares changing hands versus a 20-day average volume of about 7.25 million.[1] The stock sits about 5.7% below its 52-week high of 40.105 and roughly 19.7% above its 52-week low near 31.58, while trading just under its 50-day moving average of 38.3382, a sign that momentum has cooled slightly after a strong run.[1]
There is little in the way of fresh company-specific news on the tape, and the next earnings date has not yet been set in the latest filings. In July 2025, Jefferies highlighted PPL as the “biggest winner” from a Pennsylvania data center summit, citing its joint venture with Blackstone to supply gas-fired power to data centers across the PJM grid, a theme that still shapes how investors think about the stock’s long-term demand profile.[1] The firm carries a Buy rating, framing PPL as a beneficiary of rising power needs tied to AI and cloud infrastructure, even if that call reflects an earlier price regime rather than today’s levels.[1]
With no confirmed unusual options flow, insider activity or short-interest spike in the latest data, positioning looks relatively orderly rather than crowded in either direction. That leaves the upcoming seasonal window and the broader midterm-year macro backdrop as the main differentiators for traders trying to time entries and exits around the current consolidation.
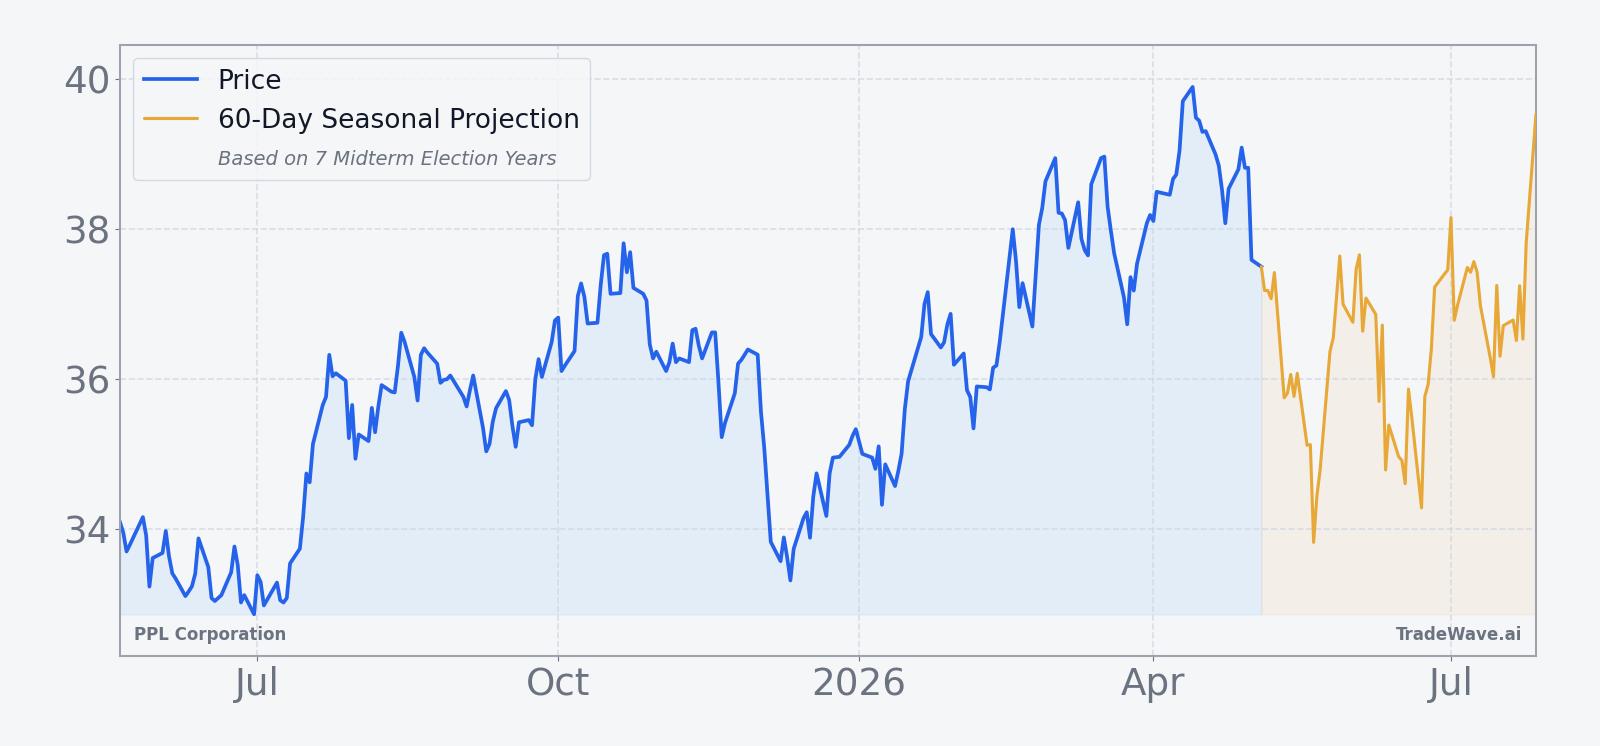
The chart below situates the latest move against PPL’s past year of trading and a 60-day seasonal projection.
What should traders watch as this PPL seasonal window approaches?
First, the calendar: the 97-day midterm-year window begins on May 20, so any breakouts or pullbacks in the next two weeks will set the starting point for how much room the historical pattern has to work with. A strong push back toward the 40 area before the window opens would leave less upside before PPL revisits its 52-week high, while a drift lower could create more space for a typical midterm-year climb.
Second, watch how PPL behaves around its 50-day moving average and the recent trading band between roughly 37 and 39. Sustained closes back above the 50-day line would signal that buyers are leaning in ahead of a historically strong stretch, while repeated failures there would hint that the stock may need a deeper reset before any seasonal tailwind can matter.
Third, keep an eye on macro and policy headlines that touch utilities, power pricing and data center demand. Any new detail on grid investment, PJM capacity auctions or large-scale data center projects in PPL’s footprint could amplify or blunt the usual midterm-year seasonal pattern, especially if it changes expectations for long-term earnings power.[1]
Finally, because past midterm-year windows have featured sizable intraperiod drawdowns even in winning years, traders may want to monitor volatility and downside spikes inside the window as a test of whether this cycle is tracking the historical script. If PPL sells off sharply early in the period and then stabilizes, that would rhyme with years like 2002 and 2022; if the stock grinds higher with shallow pullbacks, it would look more like the smoother paths seen in 1998 and 2010.
Sources
About this seasonal analysis
Seasonal pattern data is sourced from TradeWave.ai, which analyzes historical price behavior across annual calendar windows going back up to 30 years. Read the full data methodology or the book The 100-Year Pattern by Afshin Moshrefi (2026 edition). Past performance of seasonal patterns does not guarantee future results. This article is for informational purposes only and does not constitute investment advice.