ON Semiconductor (ON) AI Rebound Near Highs Faces Historically Weak June Midterm Stretch
ON Semiconductor is approaching a June midterm-year seasonal window that has favored downside trades even as the stock trades near its 52-week high on an AI-driven rebound.

What is the seasonal pattern for ON Semiconductor (ON)?
ON Semiconductor has fallen in 5 of 6 midterm-year June windows during this 23-day stretch, with an average 13.35% gain in winning short trades.
- 5 wins and 1 loss in this window, with winning short years averaging 13.35% profits and a cumulative return of 79% across the sample.
- The 23-trading-day window begins on Jun 3 and is grouped across the last 6 midterm election years, targeting a short trade direction.
- Percent Profitable stands at 83%, with 5 winners and 1 loser for the short setup in this ON Semiconductor trading window.
- Average profit across all years, including the lone losing year, is still 11%, while the median outcome is a 10.34% gain for shorts.
- Historical maximum adverse excursions have reached as deep as about 44% against the short, showing that intraperiod drawdowns can be severe even in winning years.
- The TradeWave Ratio of 1.12 and a Sharpe ratio of 1.04 point to a historically efficient but volatile seasonal short pattern in this midterm-year slice.
According to historical data from TradeWave.ai, this specific midterm-year June stretch has behaved very differently from an average month for ON Semiconductor, and the next iteration is less than a month away.
How has ON Semiconductor (ON) traded in this midterm-year June window?
ON Semiconductor has delivered profitable short-side moves in 5 of the last 6 midterm election years during the 23 trading days starting Jun 3, with winning years averaging 13.35% gains for bears. Shares last closed at 101.45, leaving them about 4.1% below the 52-week high of 105.81 after a sharp rebound over the past month.[3]
Grouping the data by the presidential election cycle matters here because this window only looks at midterm election years, a phase that often brings policy uncertainty, shifting industrial spending plans and choppy trading in cyclical names like semiconductors. Pattern phase and calendar phase are aligned: the current year is a midterm election year, and the upcoming June stretch sits squarely in the mid part of that year.
Historically, this 23-day ON seasonal trend has been a bearish window for the stock, with shorts favored in 5 of 6 midterm-year samples and an all-years average profit of 11% for the short side. The trade direction is explicitly short, so years where ON drifted lower or sold off sharply count as “good” outcomes for the pattern, while the lone losing year reflects a squeeze against shorts.
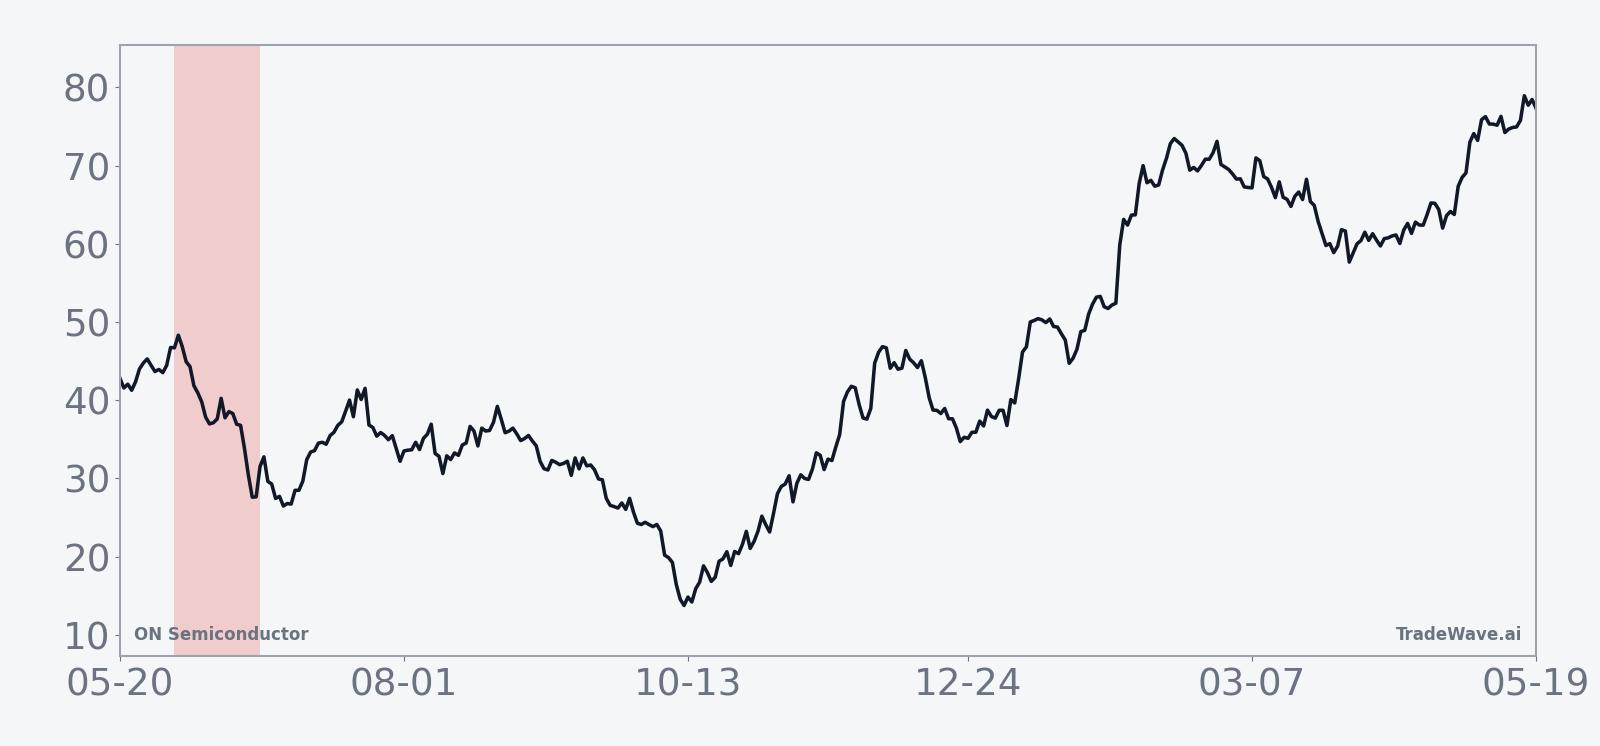
The historical seasonal average trend for this ON Semiconductor trading window slopes steadily in favor of shorts, with much of the net move typically accruing in the middle of the 23-day span rather than at the open or close. The cumulative return profile, reflected in the trend chart, shows that when the pattern works, it tends to grind lower rather than collapse in a single day, which can make the window feel choppy in real time even as it adds up to sizable net declines.
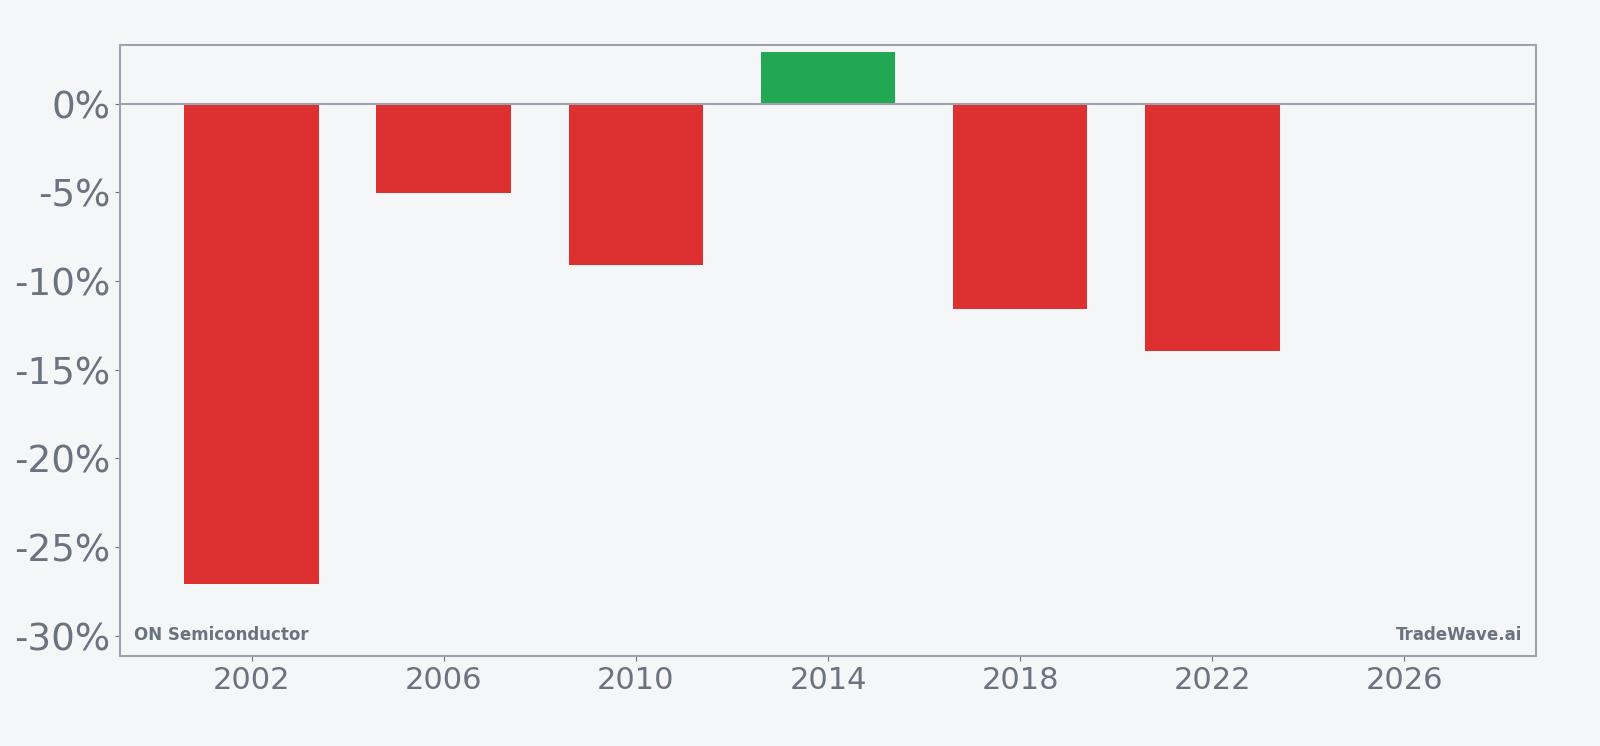
The bar chart of net returns, maximum favorable moves and maximum drawdowns shows how far ON has swung inside this window in each midterm year.
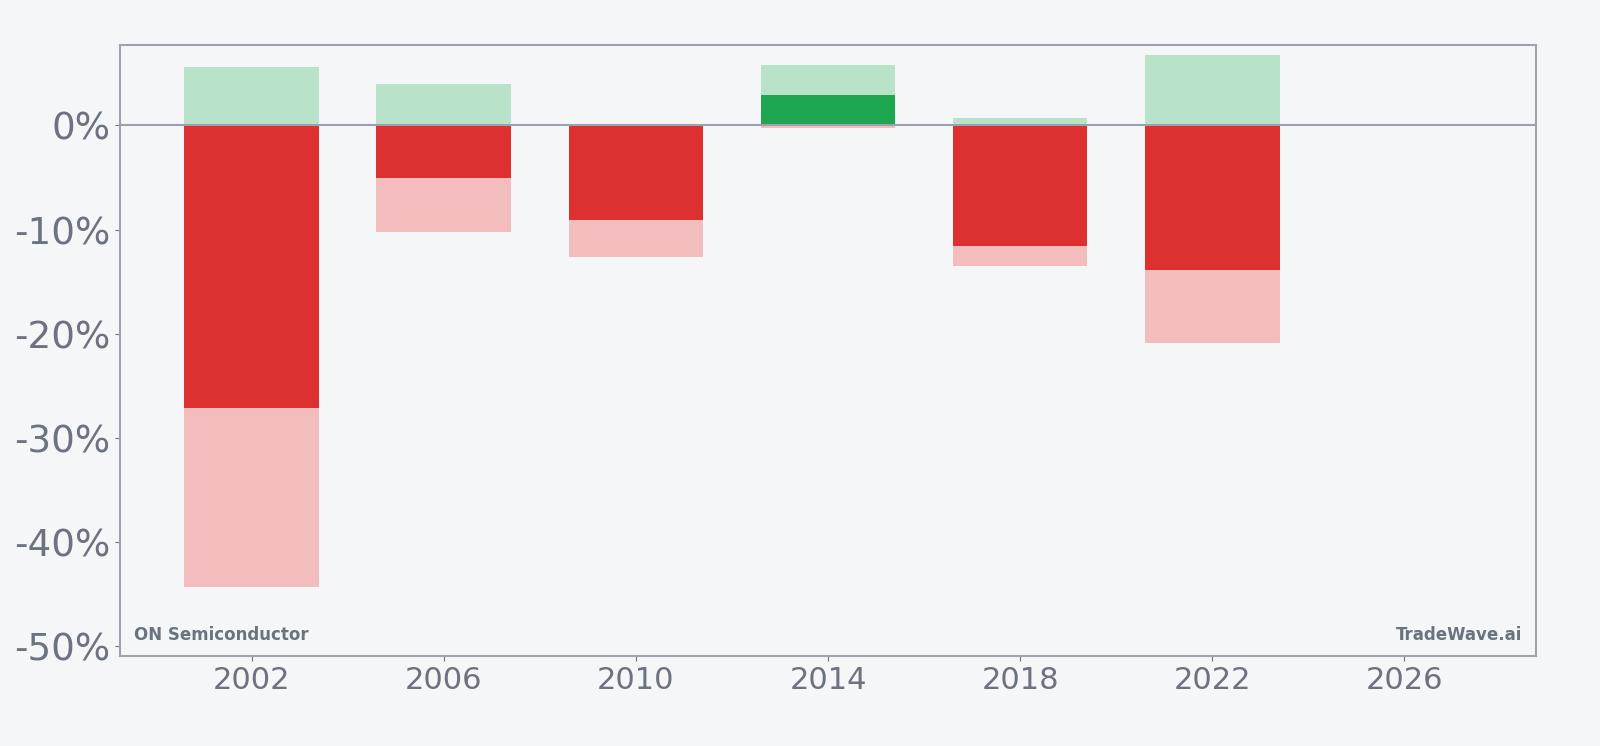
The MFE/MAE profile is where this ON seasonal pattern gets loud: in the strongest year for shorts, 2002, the stock finished the window down 27.11%, but at one point had moved as much as 44.37% against the short before rolling over, while the best move in favor of the trade reached 5.63%. In 2022, a more recent sample, the short finished up 13.93% with a maximum favorable excursion of 6.74% and a worst intraperiod drawdown of 20.88%, underscoring that even “good” years for the pattern have featured sharp squeezes before the downside reasserted itself. Add it up: this is a window where shorts have usually been rewarded, but only after sitting through sizable volatility.
Across all six midterm-year samples, the pattern has produced a cumulative 79% gain for the short side, with a median outcome of 10.34% and an average loss in the lone losing year of 2.89%. The consistency of 5 winners out of 6, combined with a TradeWave Ratio of 1.12 and a Sharpe ratio of 1.04, points to a historically efficient short window that has still demanded strong risk management because of the large adverse swings embedded in several years.
History does not guarantee future results, and the maximum adverse excursions in this window show that ON Semiconductor can move sharply against the trade even in years that ultimately finish as winners for the pattern.
Why does ON Semiconductor (ON) follow this seasonal pattern?
One likely driver is the way midterm election years cluster key macro and policy events into late spring and early summer, which can freeze industrial and automotive orders and weigh on cyclical chip demand. Analysts have also pointed to institutional portfolio rebalancing around midyear, when managers reassess exposure to higher-beta semiconductor names after the first half’s earnings and guidance. For ON Semiconductor specifically, this pattern may reflect a tendency for investors to fade early-year optimism once the reality of capital spending, auto production and AI infrastructure budgets becomes clearer in June.
What is driving ON Semiconductor (ON) today?
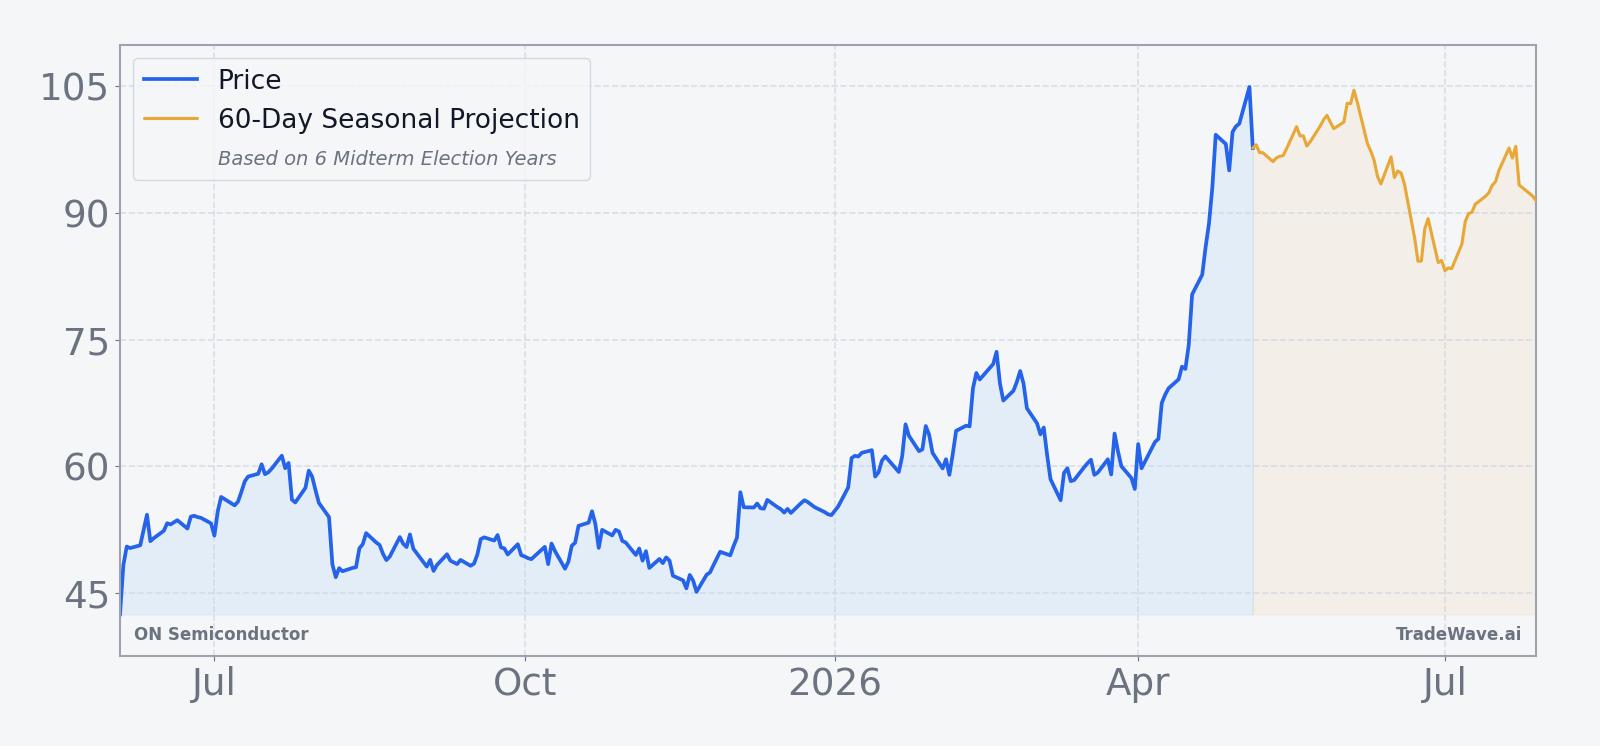
ON Semiconductor closed at 101.45 on May 5, down 0.6% on the day, but the bigger story is a roughly 61% one-month surge that has carried the stock to within about 4.1% of its 52-week high of 105.81 on heavy volume of 15.8 million shares versus a 20-day average of 11.7 million.[3] The latest leg of the move followed first-quarter results on May 4, when the company narrowed its loss to $33.4 million as AI data-center demand helped offset lingering weakness in automotive and industrial markets, signaling a recovery from a cyclical trough.[3]
That rebound comes after a rough patch earlier in the year. In February 2026, ON missed quarterly revenue estimates as an inventory glut weighed on sales, and the stock dropped nearly 6% in after-hours trading as investors digested the softer top line even though adjusted earnings per share beat forecasts.[4][5] The company had already been navigating a slowdown in late 2025, when revenue declined 11% in the fourth quarter and management guided to a modest profit range and flat-to-down revenue for early 2026, reflecting cautious end markets.[4][5]
Looking back to 2025, ON’s story has been a tug-of-war between cyclical headwinds and structural AI demand. In November 2025, the company beat third-quarter estimates with revenue of $1.55 billion and EPS of $0.63, helped by AI-related revenue that approximately doubled year over year, even as automotive sales struggled.[1][6] Earlier that summer, results showed stabilizing end markets in industrial and automotive semiconductors, suggesting that the worst of the downturn was passing even before AI spending really accelerated.[2]
The chart below situates the latest rebound and volatility against ON Semiconductor’s past year of trading and a 60-day seasonal projection.
Sector-wide, semiconductors remain a focal point for investors trying to balance cyclical risk with AI upside. Reports through 2025 pointed to stabilization in industrial and automotive chip demand, while AI-related revenue growth stayed robust, giving companies like ON a mixed but improving backdrop as they head into the midterm election year’s middle stretch.[1][2] That context makes the upcoming ON seasonal pattern more interesting: the stock is entering a historically weak midterm-year June window from a position of strength, with AI momentum and a fresh earnings rebound on its side.
What should traders watch in this ON Semiconductor seasonal window?
The first marker is timing. The 23-day ON seasonal window begins on Jun 3, so traders have several weeks to see whether the current rally cools or extends into the start of the pattern. Historically, the bulk of the short-side gains have come in the middle of the window, which means early strength has not always invalidated the pattern but has often preceded sharp reversals.
Second, price levels matter. With ON sitting just below its 52-week high, how the stock behaves around the 100 to 106 range during the window will be key: sustained trading above the prior high would look more like the lone losing year for the short pattern, while a failure to hold recent gains would rhyme with the five winning cycles. Volume is another tell. The February 2026 selloff after the revenue miss showed how quickly liquidity can flip when expectations reset, and a similar spike in downside volume during the window would align with the historical short bias.[4][5]
Finally, watch the macro and policy calendar that defines this midterm election year. Any signs of delayed industrial spending, auto production cuts or shifts in AI infrastructure budgets could hit sentiment for ON just as the historical seasonality turns negative. If the stock shrugs off such headlines and grinds higher through the window, it would mark a clear break from the last six midterm cycles. If instead ON’s strong run stalls and gives way to a choppy pullback, it would fit the pattern of profitable short trades that has defined this June stretch for more than two decades.
Sources
- Yahoo Finance, "Earnings live: Palantir stock rises modestly on strong results, Hims & Hers stock surges" (Nov 3, 2025)
- The Wall Street Journal, "ON Semiconductor Results Show Stabilizing End Markets" (Aug 4, 2025)
- The Wall Street Journal, "ON Semiconductor Narrows First-Quarter Loss on AI Data-Center Demand" (May 4, 2026)
- CNBC, "Stocks making the biggest moves after hours: ON Semiconductor, Upwork, Chegg and more" (Feb 9, 2026)
- Reuters, "Chipmaker Onsemi misses quarterly revenue estimates, shares fall" (Feb 9, 2026)
- Reuters, "Chipmaker Onsemi beats quarterly estimates on AI-driven demand" (Nov 3, 2025)
About this seasonal analysis
Seasonal pattern data is sourced from TradeWave.ai, which analyzes historical price behavior across annual calendar windows going back up to 30 years. Read the full data methodology or the book The 100-Year Pattern by Afshin Moshrefi (2026 edition). Past performance of seasonal patterns does not guarantee future results. This article is for informational purposes only and does not constitute investment advice.