CenterPoint Energy (CNP) Has Rallied in 10 of 10 Midterm May Windows, Averaging 3.37% Gains
CenterPoint Energy is approaching a historically strong 13-day midterm-year seasonal window just as the stock trades near its 52-week high and investors focus on massive grid investment needs.
What is the seasonal pattern for CenterPoint Energy (CNP)?
CenterPoint Energy has risen in 10 of 10 midterm-year May windows during this 13-day stretch, with an average gain of 3.37% in winning years.
- 10 for 10 in this window, with CenterPoint Energy averaging 3.37% gains in winning years across the last 10 midterm election cycles.
- The upcoming 13-day trading window starts May 20 and has been a consistently bullish CNP seasonal trend in midterm years.
- Percent Profitable is 100%, with 10 winners and 0 losers in the historical sample for this CenterPoint Energy trading window.
- All-years average profit matches the winners-only figure at 3.37%, reflecting the absence of losing years in the dataset.
- The TradeWave Ratio of 1.02 suggests price typically travels meaningfully in the long direction within the window, while the Sharpe ratio of 1.13 points to favorable risk-adjusted returns.
- Intraperiod swings have included sizable drawdowns in some years, so even a strong historical seasonality has carried real downside volatility along the way.
According to historical data from TradeWave.ai, this mid-May stretch has behaved very differently from an average month for CenterPoint Energy, and the next iteration is just days away.
How has CenterPoint Energy (CNP) traded in this midterm-year May window?
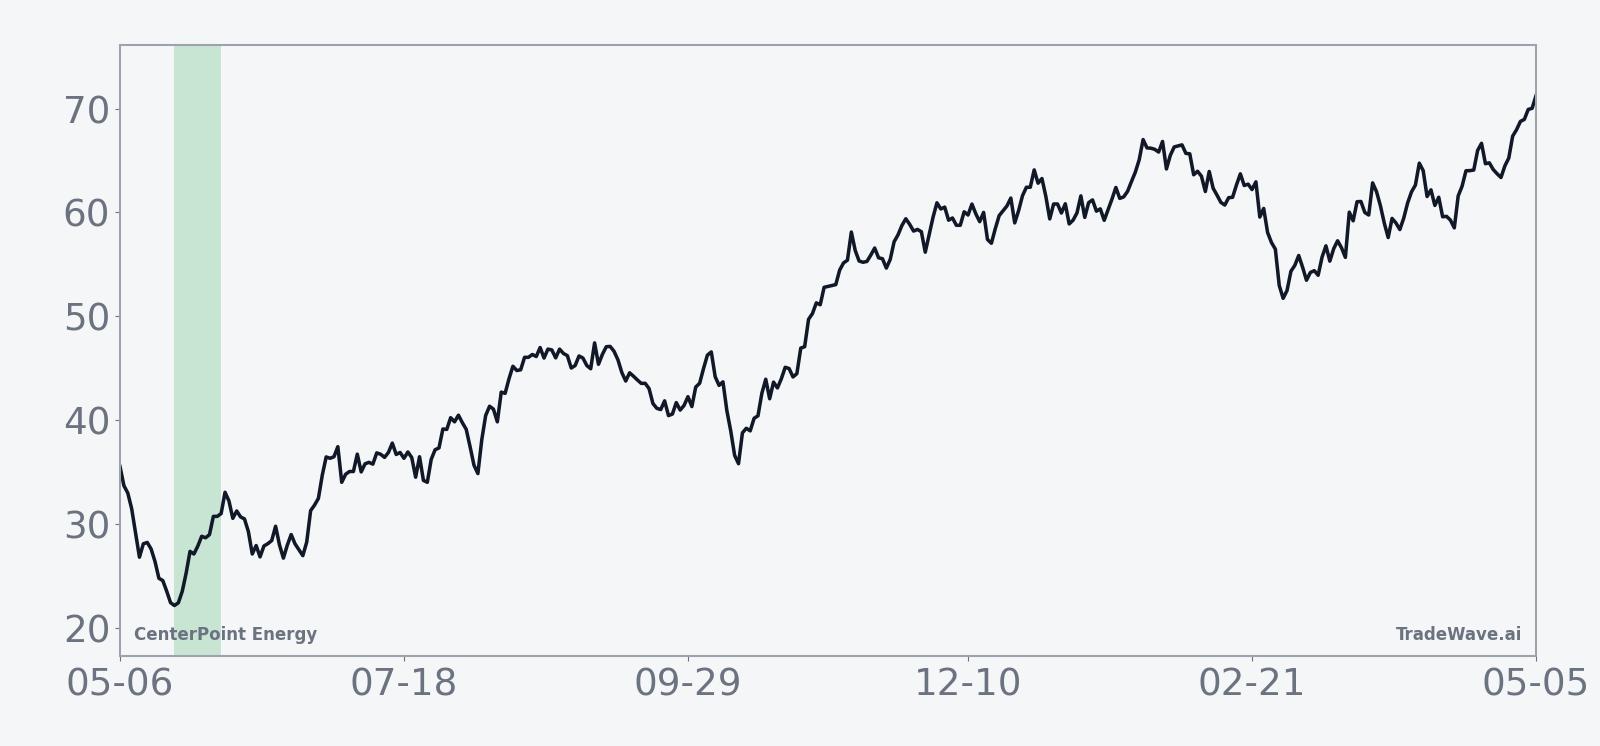
CenterPoint Energy has posted gains in every one of the last 10 midterm election years during the 13 trading days starting May 20, averaging a 3.37% advance for longs. Today the stock closed at $43.91, up 1.4% on the session and sitting about 1.3% below its 52-week high of $44.47.[2] That combination of a clean 10-for-10 seasonal record and a price pressing against the top of its one-year range gives this upcoming window unusual weight for traders watching the utility’s next move.
Because this pattern is grouped by the presidential election cycle, it reflects how CNP behaves specifically in midterm election years rather than in a simple run of calendar years. Utilities often sit at the intersection of policy, regulation and capital spending, so midterm-year shifts in rate expectations and infrastructure agendas can create a distinct backdrop for stocks like CenterPoint compared with the year after an election or the pre-election year.
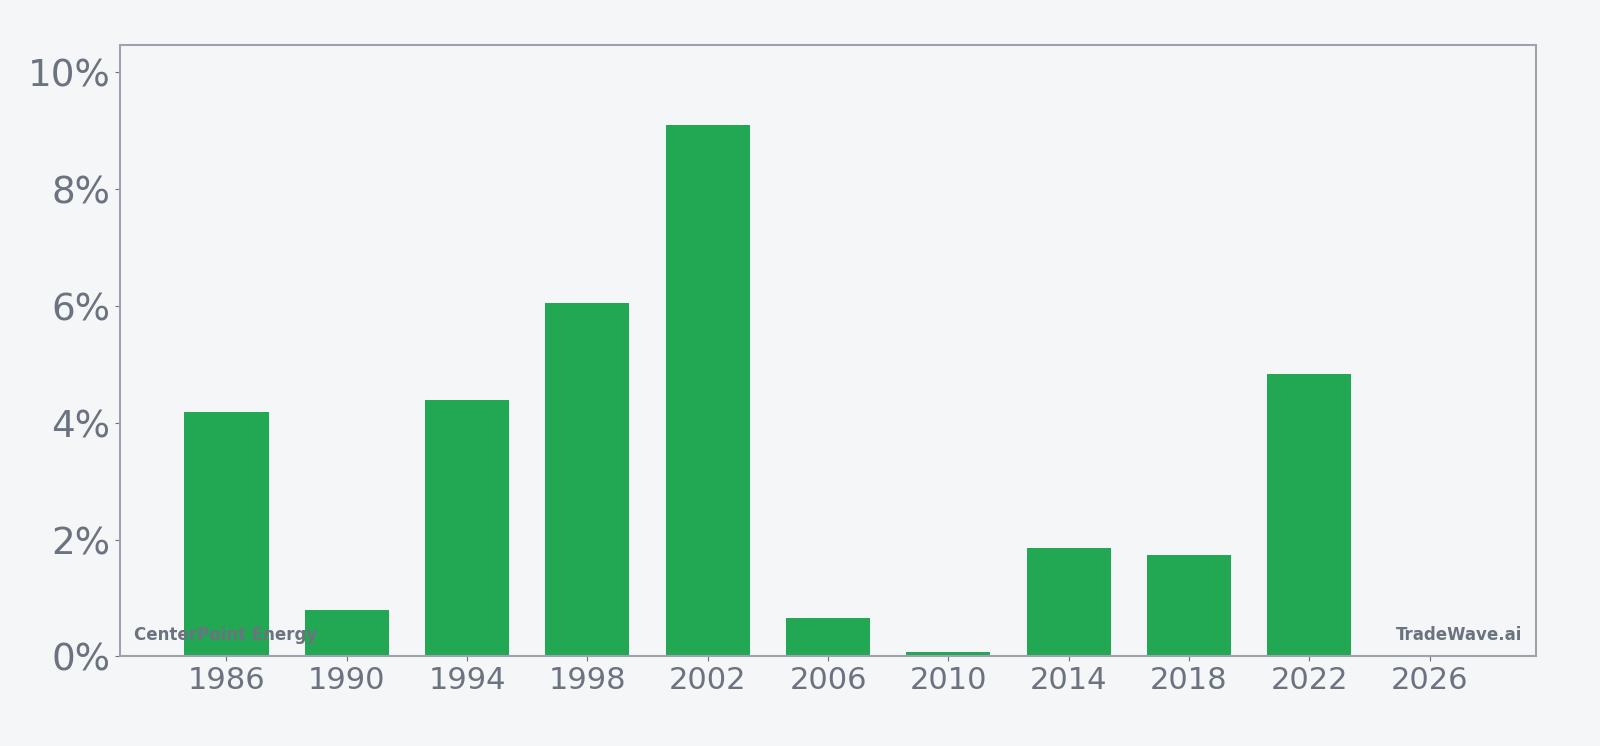
The historical average path inside the window shows gains building steadily rather than in a single spike. The trend line tilts higher through most of the 13 days, with only modest pauses, which suggests that in prior midterm cycles the stock has tended to grind upward rather than whipsaw violently.
Looking at individual years, the strongest outcome came in 2002, when CNP logged a 9.10% net gain during the window, with a maximum favorable move of 20.17% from entry at the intraperiod peak. The softest year was 2010, which still finished slightly positive at 0.08% but saw a 3.92% worst drawdown from entry before recovering, a reminder that even “all green” windows can feel uncomfortable in real time.
Across the sample, the maximum favorable excursion has often run well ahead of the final net result, which is what pushes the TradeWave Ratio to 1.02. That means price has typically traveled meaningfully in the long direction at some point during the window, even in years where the closing gain was modest.
On the downside, several years featured intraperiod pullbacks of 2% to 5% before finishing higher, including 2002, 2006 and 2010. For a long-biased pattern, those episodes count as winning trades but still required investors to sit through real volatility before the seasonal tailwind showed up in the closing print.
Put together, the pattern is unusually clean for a single-stock seasonal: 10 winners, no losers, and a mid-single-digit average gain in the best years, with drawdowns that have been manageable but not trivial. History does not guarantee a repeat, but the consistency across four decades of midterm cycles is hard to ignore.
Why does CenterPoint Energy (CNP) follow this seasonal pattern?
One likely driver is the way midterm-year policy and rate expectations intersect with utility capital spending calendars. Analysts have pointed to heavy grid and infrastructure planning in the middle of the year, when management teams refine budgets and regulators digest updated demand forecasts, which can support sentiment for regulated utilities. For CenterPoint specifically, this pattern may also reflect how investors position ahead of summer power demand in Texas and the Gulf Coast, when reliability and capacity concerns move to the front of the tape.
History does not guarantee future results, and even in a 100% winning window, adverse excursions within the period can be large enough to challenge risk limits.
What is driving CenterPoint Energy (CNP) today?
CenterPoint shares finished Tuesday at $43.91, up 1.4% on the day and roughly 1.3% below their 52-week high, after a flat one-month stretch that has left the stock almost unchanged over the past 30 days.[2] Trading volume of about 3.5 million shares came in slightly below the 20-day average of 4.15 million, suggesting the latest push toward the highs has not yet attracted outsized participation.[2]
In Sep 2025, CenterPoint laid out a $65 billion capital spending plan for 2026 through 2035, tied to surging power demand from data centers and electrification, and projected a 50% jump in electric peak load by 2031.[1] That long-term grid buildout story has kept the stock in focus as investors look for regulated utilities that can grow earnings while funding massive infrastructure upgrades.
The company has also been investing heavily in its workforce and technology stack. In Jul 2025, CenterPoint detailed plans to build out its workforce to execute $53 billion in long-term investments aimed at Houston’s growth and resiliency, underscoring the operational lift behind the capex headlines.[3] By Dec 2025, it had partnered with Palantir and Nvidia to accelerate AI infrastructure buildout, a move designed to help manage power constraints for data centers that are driving much of the new load.[4]
Those initiatives sit against a macro backdrop where U.S. power demand from data centers alone is expected to nearly triple within three years, potentially consuming up to 12% of total electricity and forcing utilities to rethink capacity and grid reliability.[1] For CenterPoint, which serves fast-growing Texas markets, that macro theme has turned what used to be a slow-and-steady regulated utility story into a more growth-oriented energy infrastructure play.
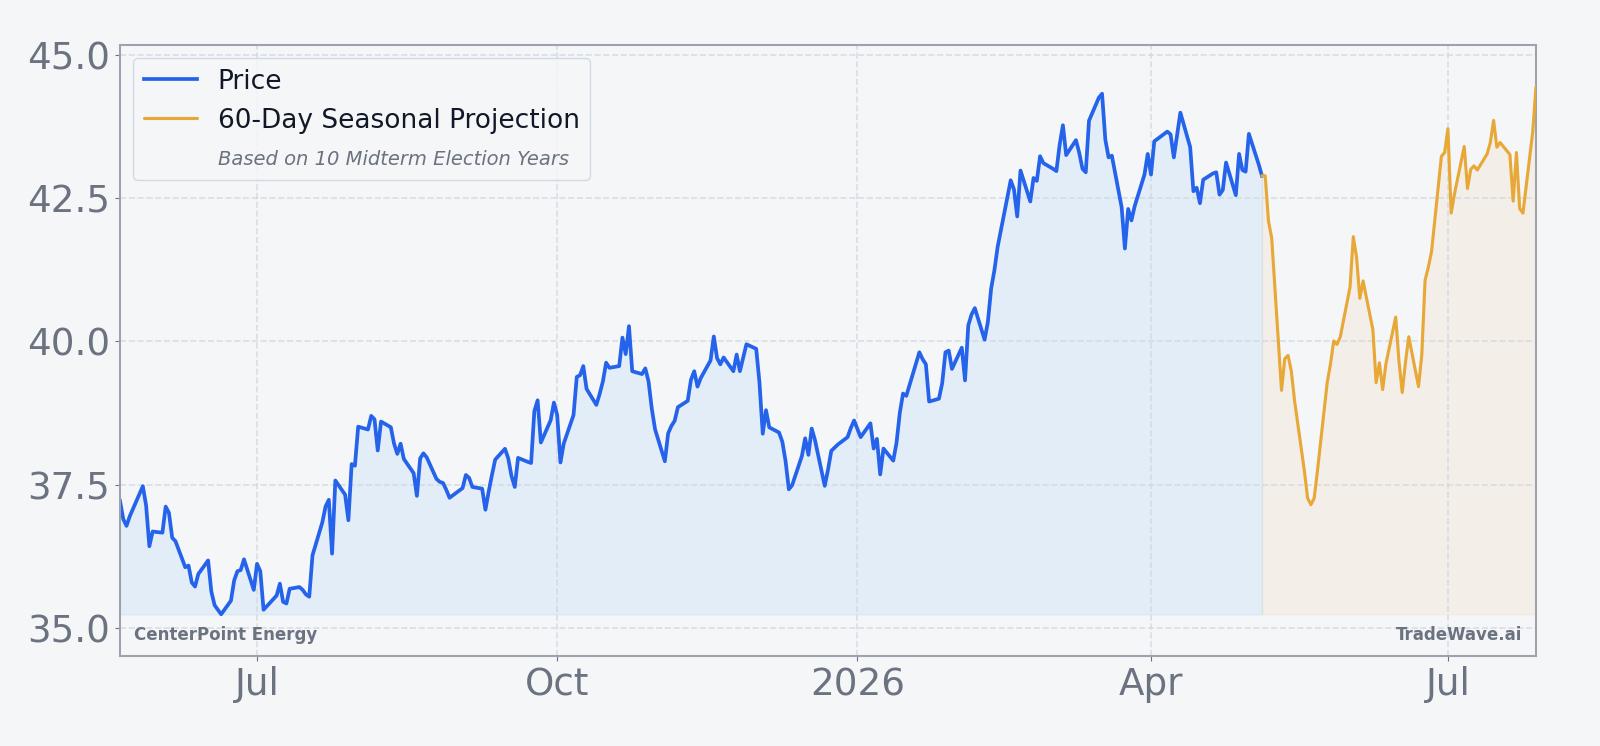
The chart below situates the latest move near the 52-week high in the context of the past year and the upcoming seasonal projection.
What should traders watch as this CenterPoint Energy seasonal window approaches?
With the 13-day mid-May window set to open on May 20, the first thing to watch is whether CNP can hold above its 50-day moving average around $43.10 and sustain trade near the top of its 52-week range.[2] A firm base just below or above the prior high has often been the launchpad in strong seasonal windows, while a sharp rejection from these levels would signal that broader market or rate jitters are overpowering the historical pattern.
Second, the policy and infrastructure calendar matters. Any updates on CenterPoint’s long-term capex plans, regulatory proceedings tied to rate cases, or commentary around data center demand could either reinforce or undercut the growth narrative that has supported the stock since the 2025 spending announcements.[1][3][4] Traders will be sensitive to any sign that timelines are slipping or that regulators are pushing back on allowed returns.
Third, watch how intraday volatility behaves once the window opens. In prior midterm years, some of the biggest winners still saw 3% to 5% drawdowns inside the period before finishing higher, so a brief shakeout would not be unusual in the context of this pattern. What would contradict the historical script is a sustained break below recent support that fails to recover during the 13-day stretch.
Finally, volume will be a tell. A push to fresh highs on rising volume as the window progresses would look consistent with the long-biased seasonal history, while a quiet drift higher or lower on light trading would suggest that other forces, such as rates or sector rotation, are in the driver’s seat. Add it up, and this mid-May window offers a clean test of whether CenterPoint’s election-cycle seasonality still has bite in a grid-constrained, AI-driven power market.
Sources
- Reuters, "CenterPoint unveils $65 billion capital spending plan over next 10 years," Sep 29, 2025.
- Finviz, "CenterPoint Energy's 3,300-person expanded electric workforce pre-positioned," Jan 24, 2026.
- Morningstar, "CenterPoint Energy building the workforce of the future," Jul 25, 2025.
- Seeking Alpha, "Palantir teams up with Nvidia, CenterPoint Energy," Dec 4, 2025.
About this seasonal analysis
Seasonal pattern data is sourced from TradeWave.ai, which analyzes historical price behavior across annual calendar windows going back up to 30 years. Read the full data methodology or the book The 100-Year Pattern by Afshin Moshrefi (2026 edition). Past performance of seasonal patterns does not guarantee future results. This article is for informational purposes only and does not constitute investment advice.