Intuit (INTU) Has Risen in 7 of 7 Midterm Windows, Averaging 10.98% Gains Over 78 Days
Intuit is down sharply in 2026 but is approaching a 78-day midterm-election seasonal window that has never been negative in the last seven cycles.

What is the seasonal pattern for Intuit (INTU)?
Intuit has risen in 7 of 7 midterm-election-year windows starting around May 9, with an average gain of 10.98% in winning years.
Key seasonal stats for the upcoming Intuit trading window
- 7 for 7 in this window, with Intuit averaging 10.98% gains across all winning years.
- The 78-day window begins May 9 and covers the heart of the midterm election year for Intuit’s stock pattern analysis.
- Percent Profitable is 100%, with 7 winners and 0 losers across the last seven midterm election years.
- Average gains cluster around a 10.56% median profit, with a cumulative return of 106% across all seven windows.
- Intraperiod swings have been meaningful, with historical best moves reaching over 30% and worst drawdowns approaching 20% in individual years.
- A TradeWave Ratio of 2.12 and a Sharpe ratio of 3.01 point to a historically strong long-biased seasonal trend for this Intuit trading window.
According to historical data from TradeWave.ai, this midterm-election stretch has behaved very differently from an average spring for Intuit. The next section walks through how that historical seasonality lines up with today’s setup.
How has Intuit (INTU) traded in past midterm-year spring windows?
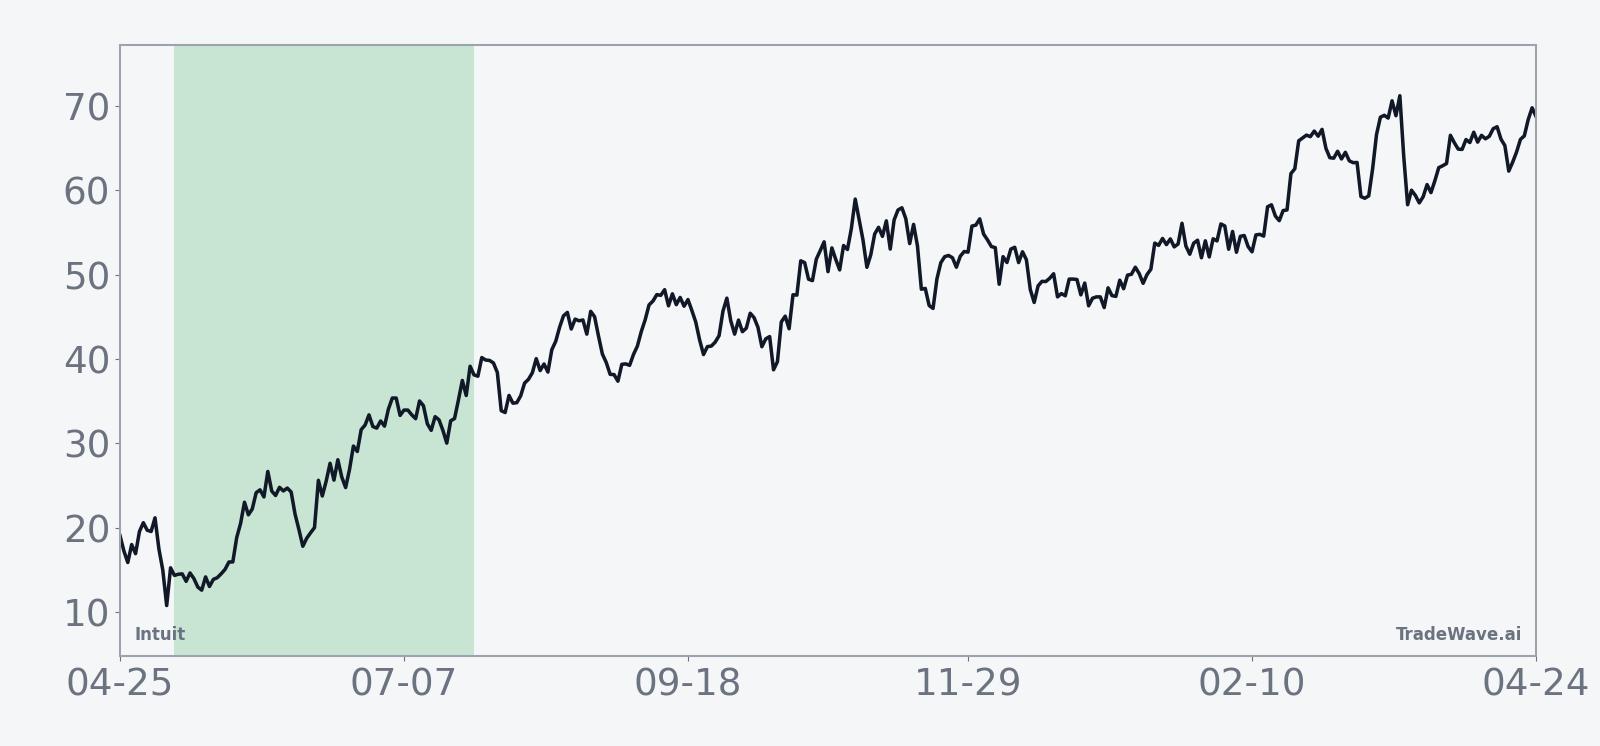
Grouping by the presidential election cycle, Intuit has treated the midterm year as a distinct playbook, and the May-to-July slice has been one of its most reliable bullish stretches. Intuit has risen in 7 of 7 midterm-election-year windows starting around May 9, averaging 10.98% gains over 78 trading days with a long trade direction. That next window begins on May 9, 2026 and runs deep into the summer, covering the tail end of tax season follow-through and the early stages of fiscal-year planning for many of its small-business customers.
This seasonal window begins on May 9 and spans 78 trading days, capturing the early part of the midterm election year when policy noise is rising but before the pre-election year’s typical risk-on tone. The pattern phase is defined as the last seven midterm election years, so each data point reflects how Intuit behaved in that same election-cycle slot rather than in consecutive calendar years. For a stock tied to tax software, small-business accounting and AI-powered financial tools, that election-cycle grouping matters because fiscal policy debates and regulatory talk around small business and digital finance tend to intensify in midterm years.
Across those seven historical windows, every single one finished positive, which is why Percent Profitable sits at 100% with 7 winners and 0 losers. The median profit of 10.56% shows that the typical outcome has been a double-digit gain, not just a marginal drift higher. Add it up and the cumulative return across all seven midterm-year windows is 106%, meaning this specific slice of the calendar has accounted for a large chunk of Intuit’s long-run compounding.
The average profit of 10.98% is calculated across all years in the sample, and because there were no losing windows, it matches the average gain in winners. That is unusual for a single-stock seasonal pattern, where even strong windows often carry at least one losing year. The Sharpe ratio of 3.01, which measures risk-adjusted average return based on end-of-window outcomes, underlines how consistently the stock has rewarded long exposure in this regime.
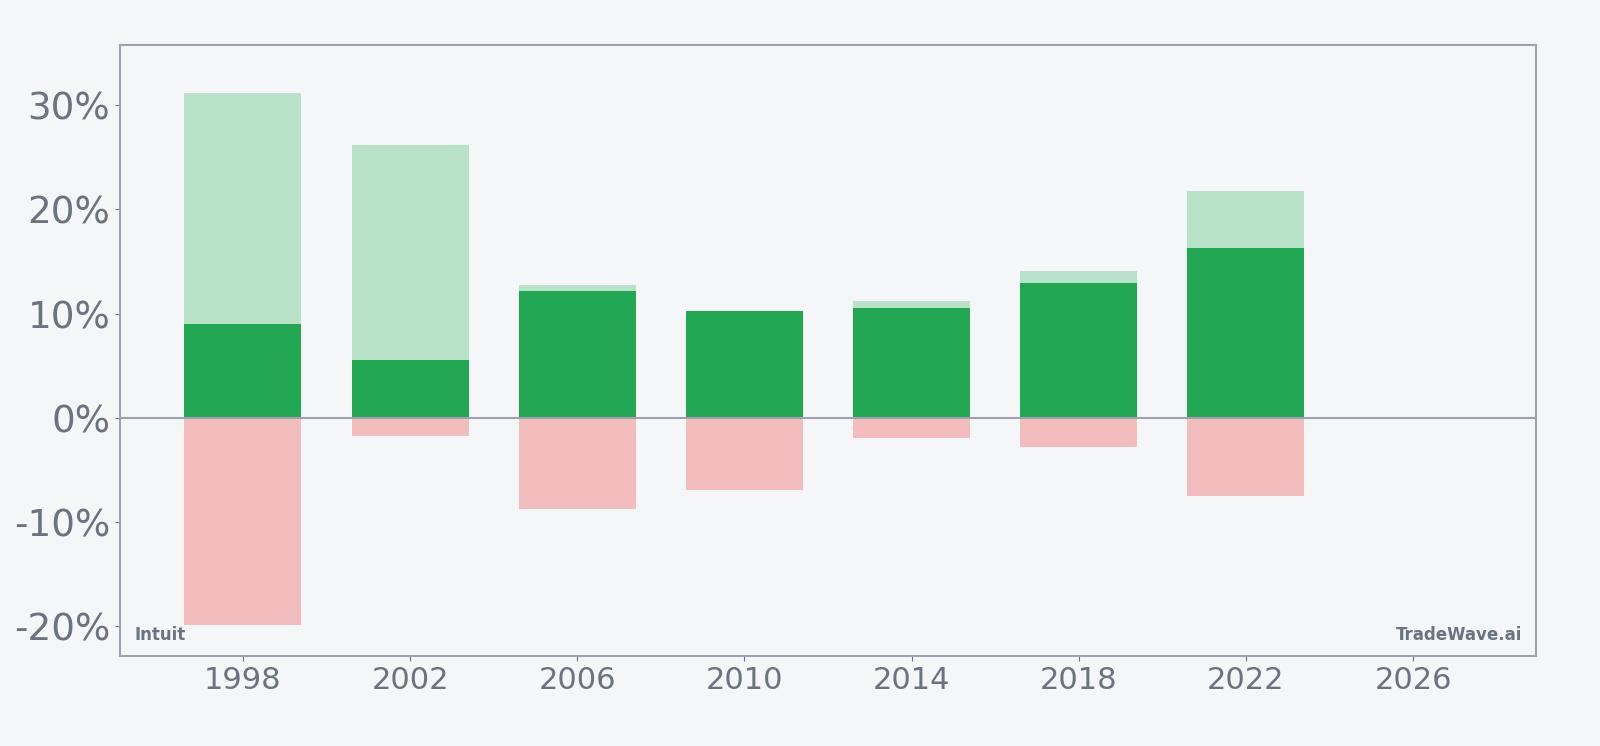
Intraperiod swings have still been real. In 1998, Intuit’s best point-to-peak move inside the window, known as the maximum favorable excursion, reached 31.12%, while the worst drawdown from entry, or maximum adverse excursion, hit -19.9%. In 2022, the stock logged a 21.72% peak run-up against a -7.53% worst drawdown. That mix of large favorable and sometimes deep adverse moves is captured in the TradeWave Ratio of 2.12, which reflects how far price typically travels in the trade direction within the window regardless of the final close.
Looking at individual years, 2022 stands out as the strongest, with a 16.32% net return from an entry around 357.88 to an exit near 416.28. The softest outcome was 2002, which still delivered a 5.51% gain from 17.53 to 18.49. Even in that weaker year, the maximum favorable move reached 26.21%, showing that rallies inside the window have often been larger than the final net result.
The historical seasonal trend chart for this window shows a fairly steady upward slope rather than a single explosive burst. Gains tend to build through the middle of the window, with some choppiness early on and a tendency for the curve to flatten toward the end as the move consolidates. That profile fits a story where tax-season momentum and small-business spending support Intuit in late spring, then cool as investors look ahead to the next fiscal year.
The cumulative return line across the seven midterm-election-year samples reinforces that picture. It climbs in a relatively smooth fashion, with no multi-year flat spots or deep cumulative drawdowns, which is rare for a single-name seasonal pattern. The consistency across different macro backdrops, from the early-2000s slowdown to the post-pandemic environment, is what makes this INTU seasonal trend stand out.
Year-by-year bars with intraperiod swings show how upside and drawdowns have lined up inside this Intuit trading window.
Across the seven midterm-election-year samples, the pattern is clear: this 78-day stretch has favored longs every time, with double-digit average gains and sizable intraperiod swings that reward timing but punish complacency.
Why does Intuit (INTU) follow this seasonal pattern?
One likely driver is the clustering of Intuit’s tax-season earnings and guidance updates around this part of the year, which can reset expectations and fuel trend-following flows. Analysts have also pointed to small-business budgeting and fiscal-year planning cycles, which often translate into stronger demand for accounting and financial software in late spring. The midterm election year adds a policy backdrop where talk of tax, regulation and small-business support can amplify interest in financial technology names like Intuit.
History does not guarantee future results, and even in all-winning windows, adverse intraperiod moves can be large enough to challenge any position sizing that ignores drawdown risk.
What is driving Intuit (INTU) today?
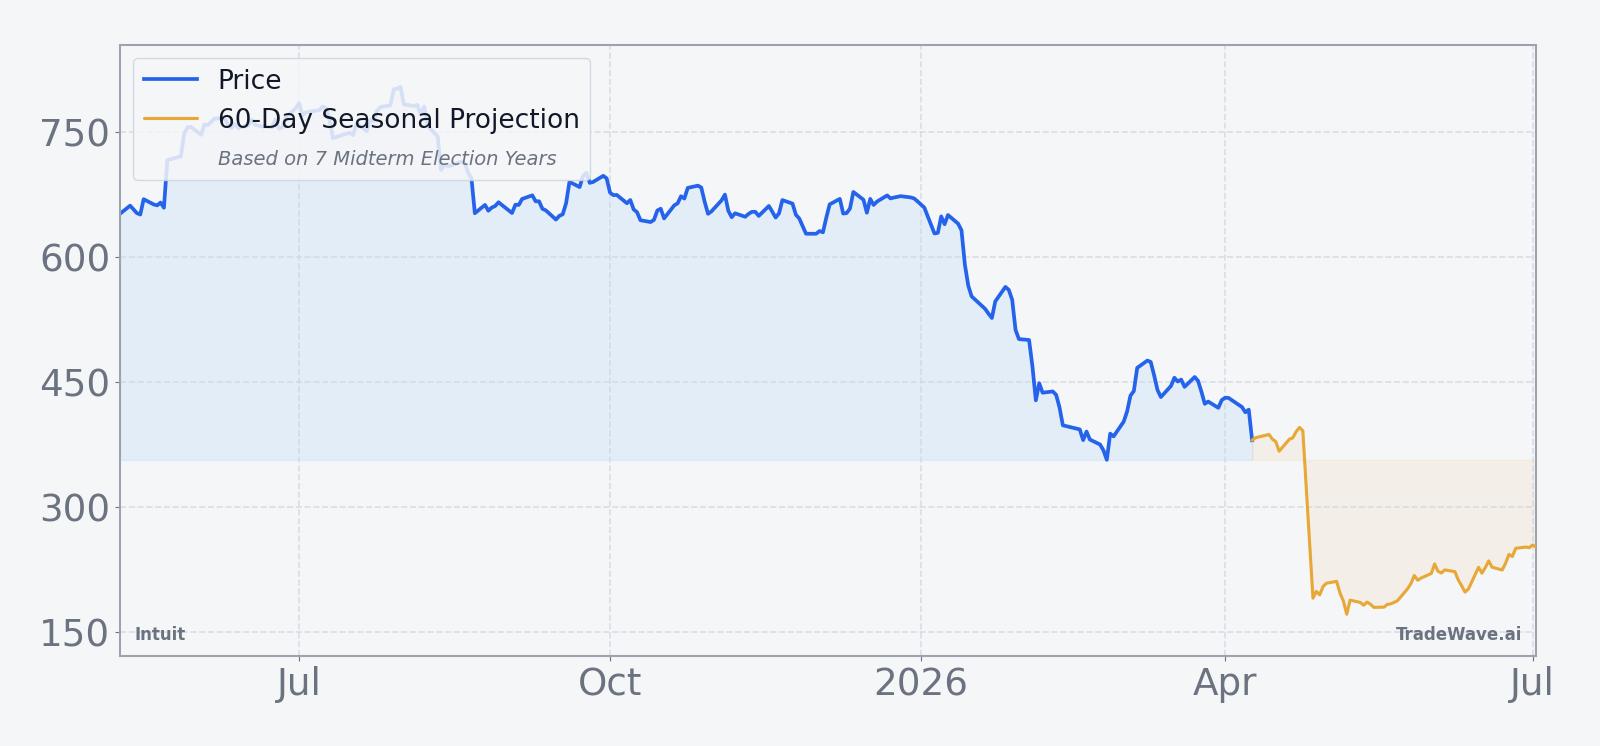
Intuit shares closed at 361.69 on Apr 10, down 7.14% on the day and roughly 55.2% below their 52-week high of 807.76, leaving the stock deep in a drawdown even before the seasonal window opens.[1] The move extends a tough start to 2026, with the stock down 29.4% year to date despite a strong run into early March that saw a 30% gain over seven sessions on the back of robust Q2 earnings and upbeat guidance.[1]
In late February, Intuit reported higher second-quarter profit driven by QuickBooks demand, but paired it with a softer outlook for the third quarter during peak tax season, which has weighed on sentiment.[7] That followed a stretch in early March when investors debated whether the prior rally had become overextended after the stock’s sharp run-up into earnings.[1] The result is a name that still carries a Buy consensus and ambitious revenue targets, but is trading far below last year’s highs as investors reassess how much they are willing to pay for AI-powered financial tools in a choppier tape.[1]
Sector-wise, Intuit sits at the intersection of financial technology and software, where demand for AI-driven automation and digital tax and accounting services remains strong even as valuations compress.[2] In Nov 2025, the company forecast quarterly revenue growth above estimates on strong demand for its financial tools, underscoring that the fundamental story has been about execution rather than end-market weakness.[2] Earlier in 2025, management also highlighted Mailchimp challenges and pricing moves in QuickBooks, signaling a willingness to tweak the portfolio and monetization levers as conditions shift.[3]
The chart below shows how that sharp 2026 pullback fits against the past year’s rally and the 60-day seasonal projection.
How does the election-year backdrop shape Intuit’s outlook?
The current calendar phase is the midterm election year, which historically brings more policy noise around taxes, small business and regulation, all of which matter for Intuit’s customer base. While the TradeWave pattern window focuses on the last seven midterm election years, the broader presidential cycle context matters because this midterm phase often sets up the tone for the following pre-election year, which has historically been friendlier for risk assets. For a financial technology name tied to tax and accounting workflows, shifts in fiscal stance, regulatory rhetoric and small-business confidence can all influence how investors treat the stock during this period.
In prior cycles, midterm years have often featured choppier early-year trading followed by stronger stretches as policy uncertainty clears and investors look ahead to the pre-election year. Intuit’s own midterm-year seasonal pattern fits that template: weakness or volatility earlier in the year, then a historically strong 78-day window starting in May that has delivered consistent gains. With the stock already well off its highs and sentiment reset by a softer near-term outlook, the upcoming seasonal window arrives against a very different backdrop than the one that prevailed during last year’s rally.
What should traders watch as this Intuit seasonal window approaches?
First, the calendar: the 78-day midterm-year window for Intuit begins on May 9, so the next few weeks are about watching whether the current downtrend stabilizes or accelerates into that date. Historically, the strongest years in this pattern have seen the stock start to firm or base ahead of the window, then build gains through the middle of the period. If Intuit continues to slide sharply into early May, it would set up a tougher test of whether the historical seasonality can reassert itself against a more bearish tape.
Second, earnings and guidance updates around tax season remain central. In Feb 2026, Intuit delivered higher second-quarter profit but paired it with a softer third-quarter outlook, which helped trigger the latest leg lower.[7] Any follow-up commentary on demand for QuickBooks, TurboTax and AI-powered tools, or on how small-business customers are behaving in a midterm-year economy, will shape how much weight investors give to the historical seasonal pattern versus the current fundamental narrative.
Third, price levels matter. With shares trading just above the 52-week low of 349 and far below the 50-day moving average around 429.65, traders will be watching whether Intuit can reclaim that moving average during or shortly after the seasonal window. A failure to bounce meaningfully during a period that has historically been one of the stock’s strongest would be a clear sign that this cycle is breaking from the usual INTU seasonal trend.
Finally, watch how the broader financial technology sector trades as policy headlines pick up. If AI-driven financial tools and fintech peers start to catch a bid into the summer while Intuit lags, it would raise questions about company-specific issues. If the group as a whole remains under pressure, then even a historically strong seasonal window may struggle to overcome macro and valuation headwinds. Either way, the May 9 start date gives traders a clear line in the sand for tracking whether this 7-for-7 midterm-year pattern can extend its streak.
Sources
- Forbes: "Is Intuit Stock Rally Overextended Or Just Getting Started?" (Mar 6, 2026)
- Reuters: "Intuit expects quarterly revenue growth above estimates on strong financial tools demand" (Nov 20, 2025)
- Reuters: "Intuit forecasts first-quarter revenue growth below estimates, shares fall" (Aug 21, 2025)
- CNBC: "Intuit tops Wall Street estimates after tax season, issues strong guidance" (May 22, 2025)
- The Wall Street Journal: "Intuit Sales Jump, Expects Gains to Continue" (Aug 21, 2025)
- The Wall Street Journal: "Intuit Logs Higher Second-Quarter Profit, Gives Soft Third-Quarter Outlook" (Feb 26, 2026)
About this seasonal analysis
Seasonal pattern data is sourced from TradeWave.ai, which analyzes historical price behavior across annual calendar windows going back up to 30 years. Read the full data methodology or the book The 100-Year Pattern by Afshin Moshrefi (2026 edition). Past performance of seasonal patterns does not guarantee future results. This article is for informational purposes only and does not constitute investment advice.