AI Boom Lifts Micron Technology (MU), but Traders Face a May-to-October Downside Stretch
Micron Technology is racing higher on AI demand ahead of a midterm-year seasonal window that has historically favored downside moves, setting up a rare clash between momentum and pattern.

What is the seasonal pattern for Micron Technology (MU)?
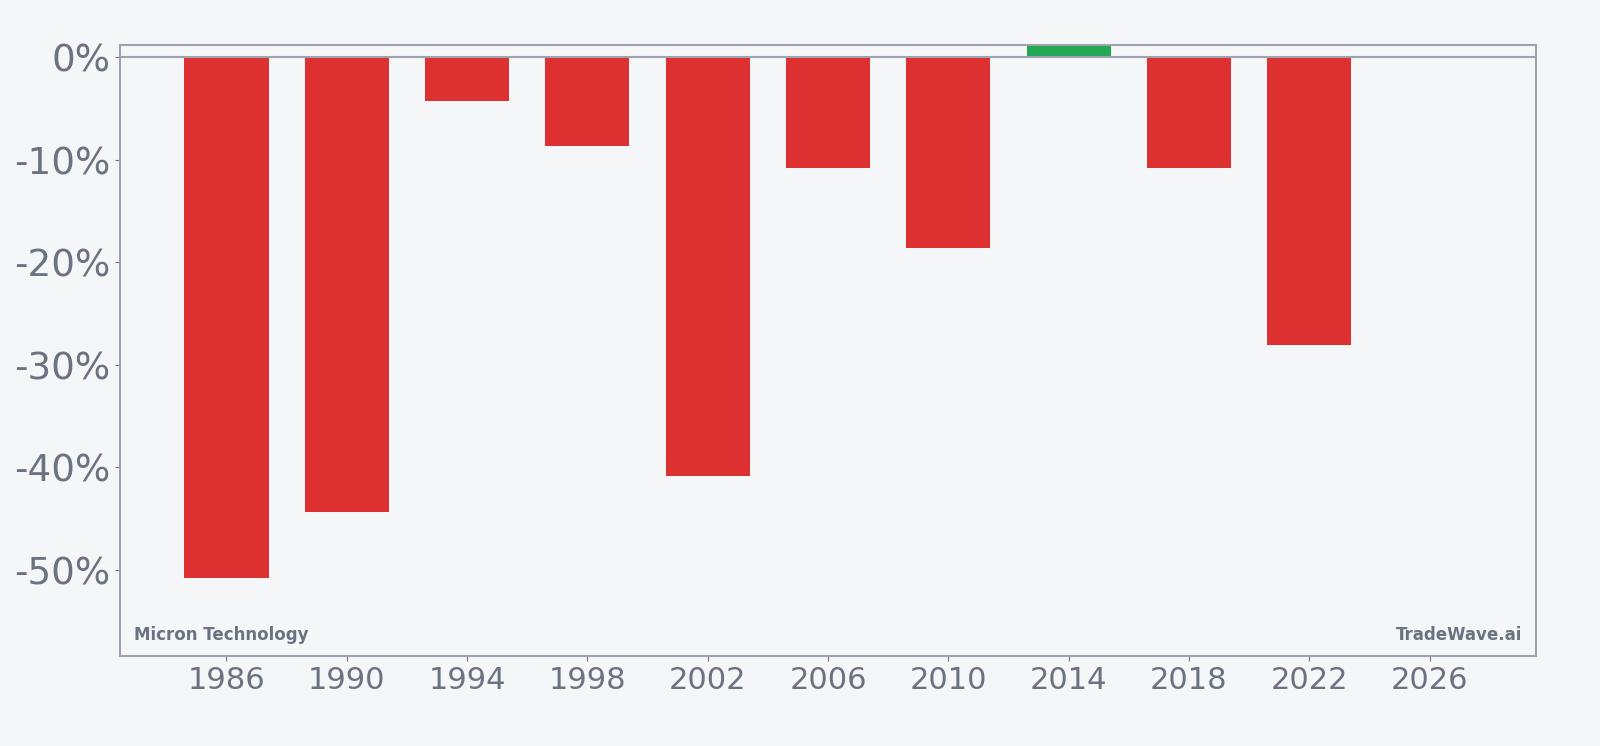
Micron Technology has fallen in 9 of 10 midterm election years during this May-to-October window, with an average 24.12% gain for winning short trades.
- 9 for 10 in this window, with winning short years averaging 24.12% moves in Micron’s favor.
- Seasonal window starts May 4 and runs 162 trading days across the last 10 midterm election years.
- Percent Profitable is 90%, with 9 winners and 1 loser for the short-side pattern.
- Avg Profit - All, which includes the lone losing year, still comes in at a strong 22%.
- Trade Direction is short, and the TradeWave Ratio of 1.75 points to sizable intraperiod swings in the trade direction.
- Historical maximum adverse excursions have reached more than 60%, so drawdowns inside the window can be deep even in winning years.
According to historical data from TradeWave.ai, Micron’s behavior in midterm election years has shown a distinct seasonal bias that most traders never see on a standard chart.
How has Micron Technology (MU) traded in this midterm-year window?
Micron Technology has delivered profitable short-side trades in 9 of the last 10 midterm election years during the 162-day window that begins on May 4, with winning years averaging 24.12% moves in the trade direction. Today the stock closed at 377.76, up 3.1% on the session and roughly 19.8% below its 52-week high of 470.94, after a powerful AI-driven run that has lifted shares about 58% year to date.[3][5][7]
Because this pattern is grouped by the presidential election cycle, it only looks at Micron’s behavior in the midterm election year, which often features policy uncertainty, shifting fiscal priorities and choppy risk appetite before the typically stronger pre-election year. In other words, the sample is not ten consecutive calendar years but the last ten times the calendar lined up with this same phase of the White House cycle.
Across those ten midterm-year iterations, the short-side seasonal bias is clear. Percent Profitable sits at 90%, with 9 winners and just 1 losing year, and even after including that outlier the Avg Profit - All is still 22%. For the winning short trades alone, Avg Profit is 24.12%, which means the typical successful year in this Micron Technology trading window has seen the stock fall by roughly a quarter from entry to exit.
The per-year table shows how wide the range of outcomes has been. The strongest short year was 1986, when Micron dropped 50.82% during the window, with a worst intraperiod drawdown of 60.66% from the entry price and only a modest 2.46% best run-up against the trade. At the other end of the spectrum, 2014 was the lone losing year for shorts, with a small 1.08% net gain for the stock and a 30.33% maximum move against the short before the window closed.
Those extremes highlight why intraperiod swings matter as much as the final result. Maximum favorable excursions, or the best point-to-peak moves in the trade direction, have reached as high as 35.9% in 2018 and 24.39% in 1994, while maximum adverse excursions, the worst drawdowns from entry, have stretched beyond 50% in several cycles. That combination of large MFE and large MAE points to a high-variance window where Micron has often moved sharply both ways before settling lower by the end of the period.
The historical seasonal average curve for this MU seasonal trend suggests that weakness has tended to build gradually rather than in a single air pocket. The typical path shows Micron drifting lower over the 162 trading days, with rallies along the way that have not, on average, erased the broader downtrend for this short-side pattern.
A stacked view of net returns alongside best and worst intraperiod moves shows how much room Micron has historically had to swing inside this window.
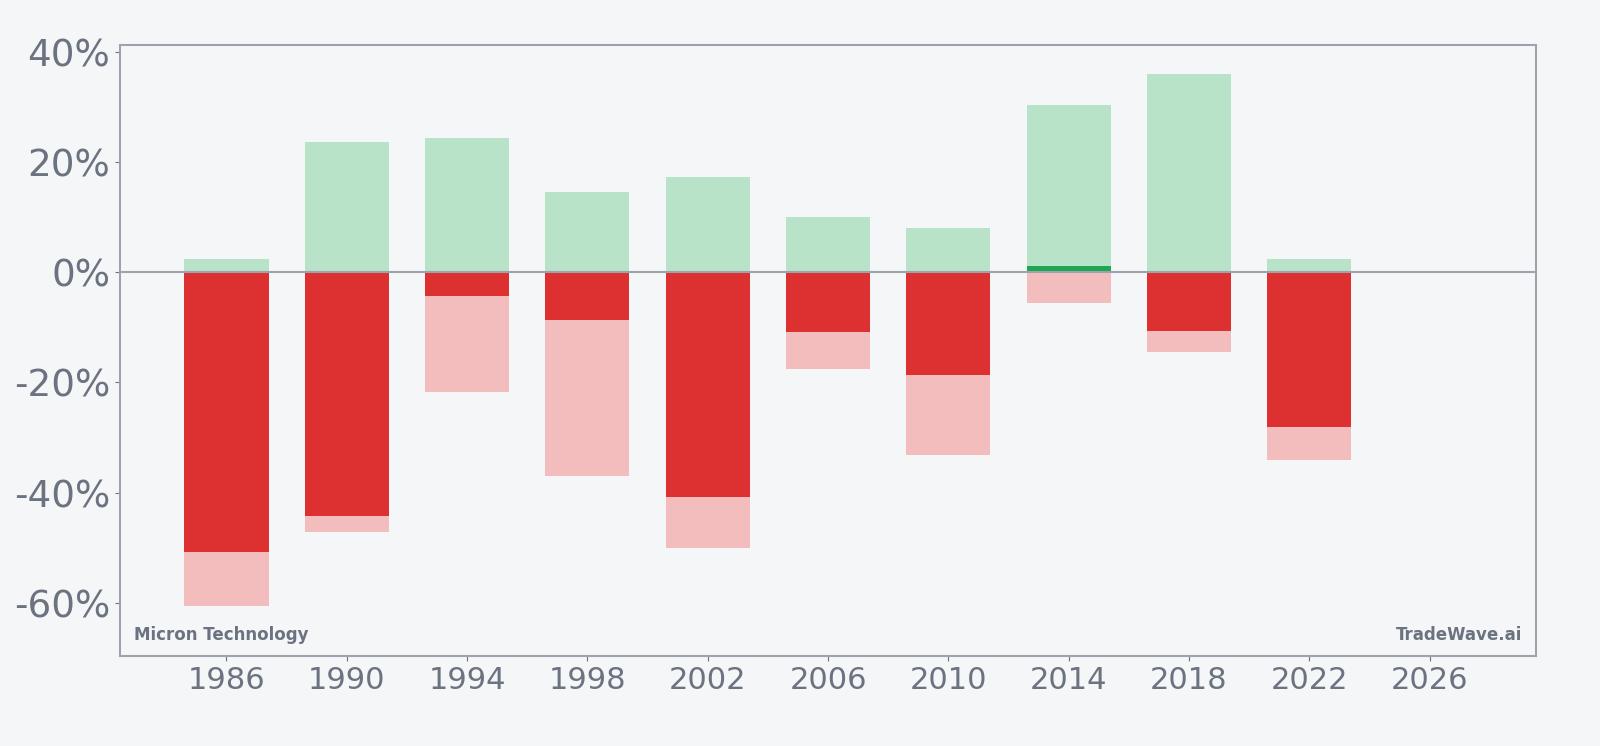
The bars with MFE and MAE make the pattern’s character clear: in most years, Micron has offered sizable downside follow-through for shorts while still subjecting traders to meaningful countertrend rallies. The TradeWave Ratio of 1.75 reinforces that price has typically traveled far in the trade direction within the window, independent of where it finished.
History does not guarantee future results; adverse excursions can be large even in winning windows, and Micron’s intraperiod drawdowns have at times exceeded 50% in this pattern.
Why does Micron Technology (MU) follow this seasonal pattern?
One likely driver is the way Micron’s earnings calendar and capex guidance tend to cluster around the middle of the year, when investors reassess the memory cycle and trim exposure in midterm election years. Analysts have also pointed to sector rotation between high-beta AI infrastructure names and more defensive technology as policy and rate uncertainty peaks in the mid-cycle phase.[7][8] This pattern may reflect institutional portfolio repositioning ahead of the historically stronger pre-election year, when risk appetite often broadens again.
What is driving Micron Technology (MU) today?
Micron closed at 377.76 on Tuesday, up 3.1% on the day and roughly 2.1% higher over the past month, leaving the stock about 19.8% below its 52-week high of 470.94 even after a 58% year-to-date surge.[3][5][7] The move caps a stretch of blockbuster results, including Q2 fiscal 2026 revenue of $23.86 billion and EPS of $12.20, both far ahead of expectations, and guidance that calls for Q3 revenue of $33.5 billion and EPS of $19.15 as AI-driven demand for high-bandwidth memory and data center products accelerates.[1][4][7]
That fundamental backdrop has turned Micron into one of the purest AI infrastructure plays in the market. Fresh analysis in mid-March highlighted how AI workloads are driving a surge in DRAM and NAND pricing, with Micron’s gross margin outlook climbing toward 81% as supply tightens in key nodes.[1][4][8] At the same time, some strategists warn that the memory market’s history of boom-and-bust cycles has not disappeared, and a March 16 note flagged the risk of a downcycle arriving sooner than many investors expect as capacity ramps and customers work through inventory.[8]
Options traders have been leaning into that volatility. Ahead of Micron’s March earnings, options flow skewed bullish with an implied move of roughly 8% to 9% priced in, signaling expectations for a significant post-report swing rather than a quiet consolidation.[9] Short interest sits near 2.61%, a modest level for such a high-beta name but one that reflects lingering concern that any hint of a demand pause or pricing rollover could trigger a sharp reset in expectations.[1]
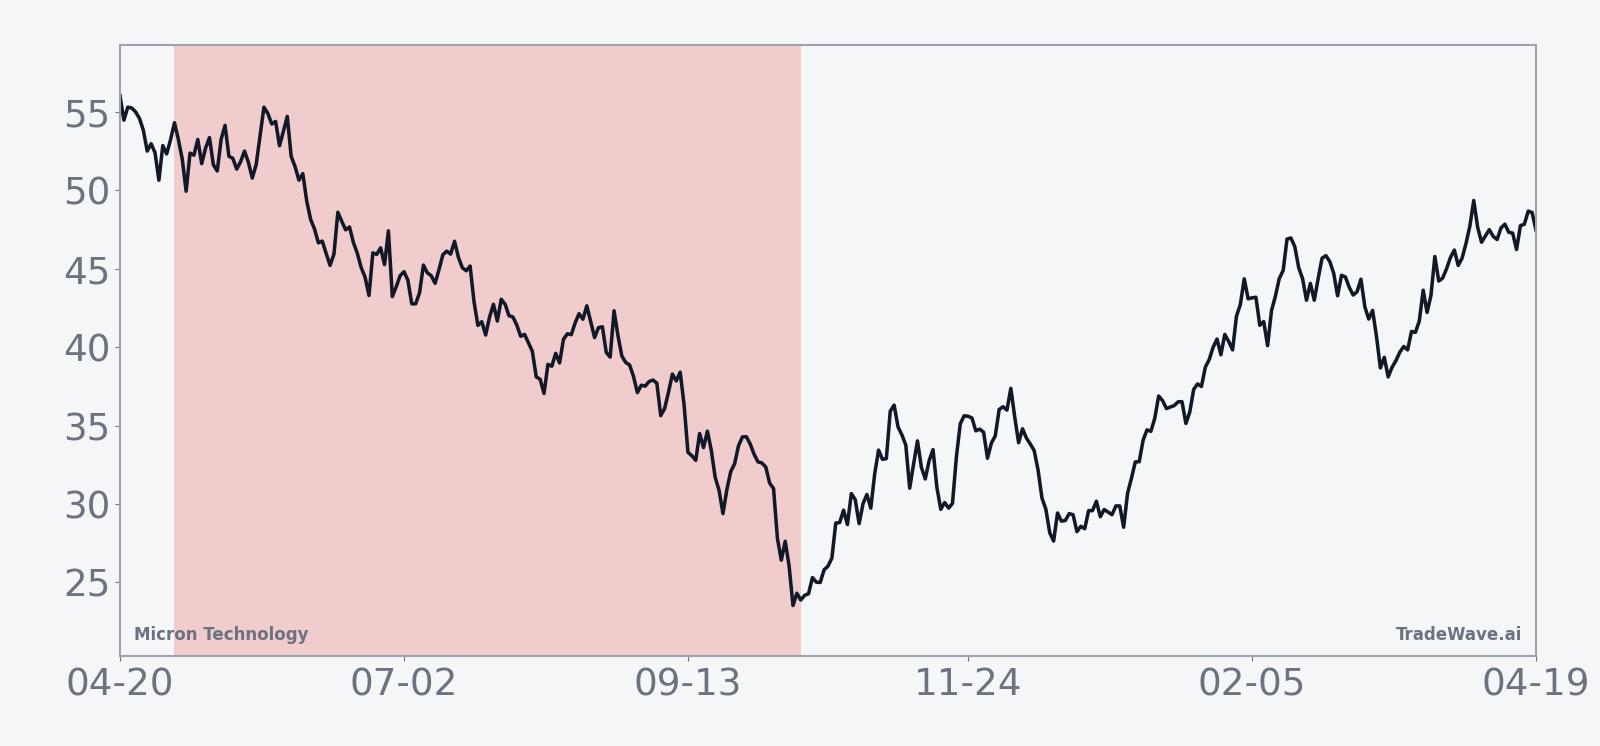
The chart below situates the latest move in its recent multi-month context, alongside a 60-day seasonal projection.
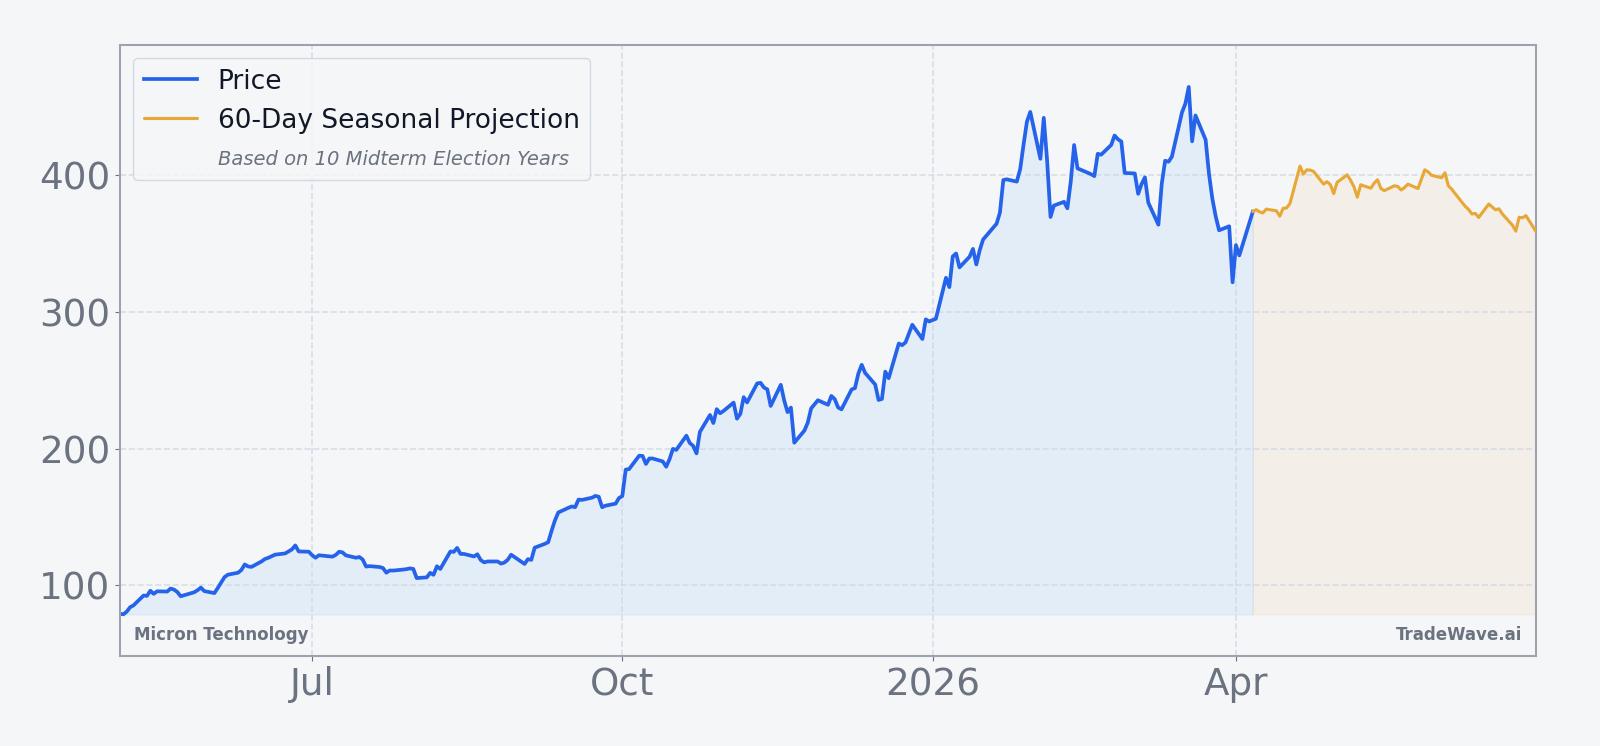
In the near term, Micron’s setup is a tug-of-war between powerful AI momentum and the calendar. The stock is trading above its 20-day average volume of about 51.2 million shares and remains just under its 50-day moving average of roughly 402.80, a sign that the latest pullback has not fully reset positioning.[3][5] As the market moves deeper into the midterm election year and closer to the May 4 seasonal start date, traders will be watching whether that AI narrative can keep overpowering a historical pattern that has usually rewarded patience on the short side.
What should traders watch as this Micron Technology (MU) window approaches?
First, the policy and macro calendar matters. Midterm election years often bring noisy debates over spending, industrial policy and regulation that can swing sentiment around capital-intensive chipmakers, especially those tied to AI infrastructure and data centers.[7][8] Any shift in guidance from Washington on subsidies, export controls or cloud spending incentives could either reinforce or blunt the historical midterm-year softness in this Micron Technology trading window.
Second, watch how Micron trades around key levels as the May 4 window opens. A sustained push back toward the 52-week high near 471 would mark a clear break from the historical seasonality, while a failure to reclaim the 50-day moving average around 403 ahead of the window would look more consistent with prior midterm-year patterns. Intraperiod behavior will matter as much as direction: history shows that even in winning short years, Micron has often staged sharp countertrend rallies before rolling over again.
Third, keep an eye on options flow and short interest as a real-time read on positioning. If bullish options activity continues to build and implied moves stay elevated, that would suggest traders are still bracing for big swings rather than a quiet drift, which fits the high-variance profile of this seasonal window.[9] A meaningful rise in short interest from the current 2.61% would signal that more investors are leaning into the historical pattern, while a squeeze in shorts would be one way this cycle could diverge from the past.[1]
Finally, the simplest tell will be how Micron behaves once the window is underway. If the stock starts to roll over on strong volume into the summer despite upbeat AI headlines, that would echo the 9-for-10 record that has defined this midterm-year stretch. If instead Micron grinds higher and shrugs off pullbacks, traders will have a live example of how powerful secular themes can override even the most striking seasonal trend.
Sources
- Seeking Alpha: Micron Q2 Earnings Preview: Expect Another Monster Quarter (Mar 14, 2026)
- Yahoo Finance: Analysts Lift Micron Price Targets Ahead of Quarterly Earnings (Dec 17, 2025)
- Seeking Alpha: Micron slides as investors take profits after historic run (Mar 19, 2026)
- Seeking Alpha: Micron Just Smashed Estimates - Buy The Dip (Mar 18, 2026)
- Yahoo Finance: Micron stock falls more than 4% despite Q2 earnings beat (Mar 19, 2026)
- Zacks Investment Research: The Surge in Micron Technology Stock Looks Poised to Continue (Feb 13, 2026)
- Seeking Alpha: Micron: Memory Downcycle Sooner Than Expected (Mar 16, 2026)
- Seeking Alpha: Micron options lean bullish ahead of earnings (Mar 18, 2026)
About this seasonal analysis
Seasonal pattern data is sourced from TradeWave.ai, which analyzes historical price behavior across annual calendar windows going back up to 30 years. Read the full data methodology or the book The 100-Year Pattern by Afshin Moshrefi (2026 edition). Past performance of seasonal patterns does not guarantee future results. This article is for informational purposes only and does not constitute investment advice.