Carnival (CCL) Has Dropped in 8 of 9 Midterm Summers, Averaging 14% Short-Side Profits
Carnival is trading below its recent highs just weeks before a midterm-year seasonal window that has historically leaned bearish for the stock.
What is the seasonal pattern for Carnival (CCL)?
Carnival has fallen in 8 of the last 9 midterm-year windows starting around May 9, with average winning-year gains of 15.48% for the short side.
Key seasonal stats for the upcoming window
- 8 wins and 1 loss for short positions in this 114-day midterm-year window, with 89% Percent Profitable.
- Average profit in winning years is 15.48%, while Avg Profit - All years, including the lone loser, is 14%.
- The window opens on May 9, 2026 and runs for 114 trading days, covering most of the summer travel season.
- Trade Direction is short, meaning the historical pattern has favored downside moves rather than rallies.
- The TradeWave Ratio is 1.72, indicating price has typically traveled meaningfully in the trade direction within the window.
- The Sharpe ratio of 1.16 points to a historically strong risk-adjusted profile for this specific short window.
According to historical data from TradeWave.ai, this midterm-year stretch has behaved very differently from a typical summer for Carnival. The next section looks at how that election-cycle pattern has played out in prior years and what it means for the coming window.
How has Carnival (CCL) traded in past midterm-year summer windows?
Carnival has fallen in 8 of the last 9 midterm election years during the 114 trading days starting around May 9, with a cumulative return of 205% for short positions across those cycles. Shares finished Friday at $27.85, down 0.6% on the day and about 18.2% below their 52-week high of $34.03.[3] That combination of a historically bearish summer window and a stock still well off its recent peak gives traders a clear seasonal backdrop as the next phase of the presidential election cycle approaches.
The pattern is grouped by the presidential election cycle, focusing on the last nine midterm election years rather than consecutive calendar years. That matters because midterm years often bring policy uncertainty, shifting fiscal priorities and bouts of volatility that can hit travel and leisure names differently than in election or pre-election years.
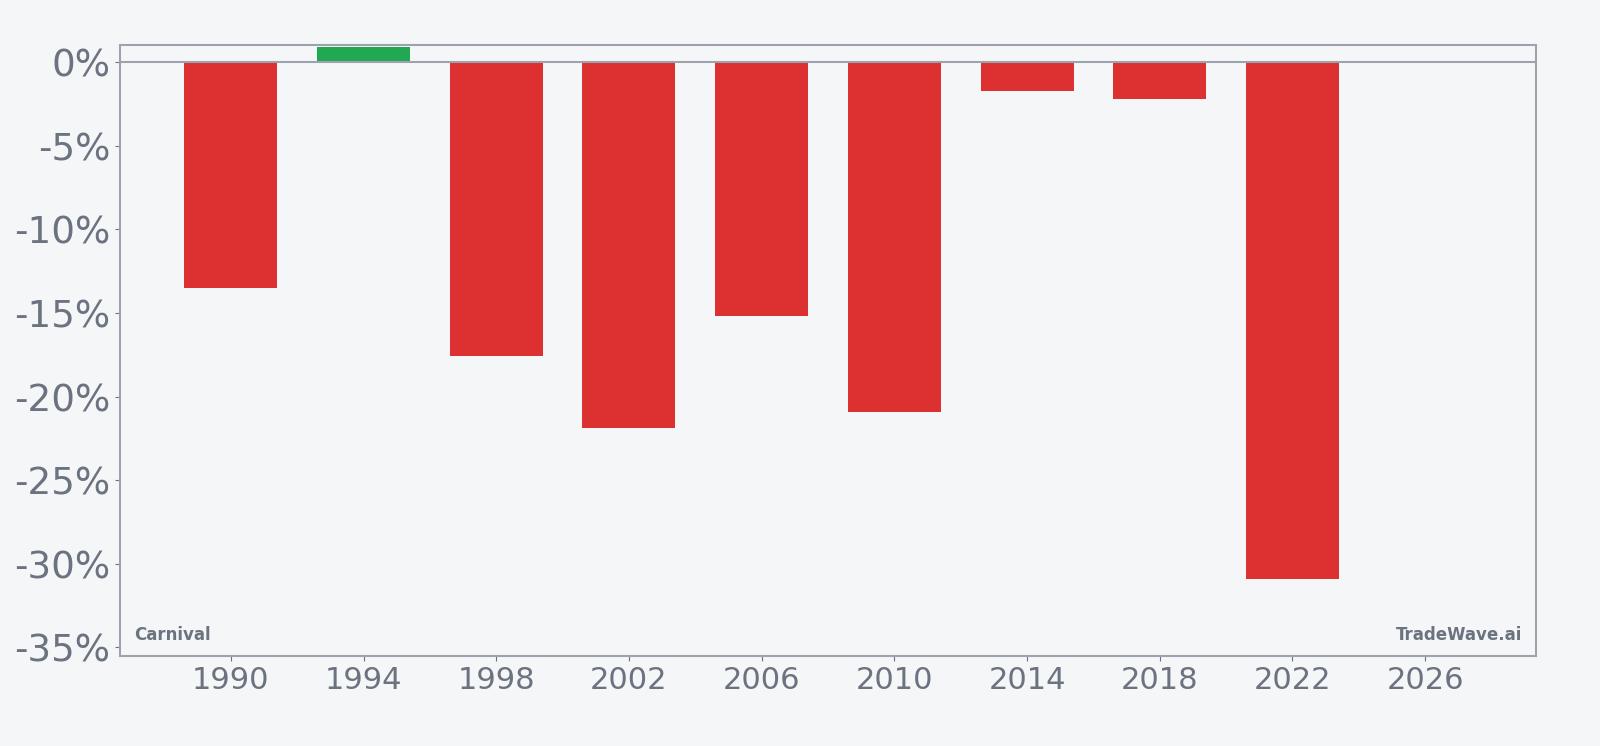
The historical seasonal average shows Carnival tending to weaken fairly steadily across the window, which runs from early May through much of the summer. For a short setup, negative returns are favorable, and the pattern’s 89% Percent Profitable with 8 winners and 1 loser reflects that bias. Average profit in winning years is 15.48%, while including the lone losing year brings Avg Profit - All down slightly to 14%, still a sizable move for a single seasonal regime.
Looking at individual years, 2022 stands out as the strongest short, with a net return of -30.91% for the stock over the window and a worst intraperiod drawdown of -42.72% from the entry price. At the other end of the spectrum, 1994 was the only losing year for shorts, with a small positive net return of 0.91% for the stock and a relatively modest worst adverse move of -6.14% from the short seller’s perspective. That spread between the best and weakest years underlines how much the Carnival trading window can vary even within a consistent midterm-year pattern.
The cumulative return profile across all nine midterm-year windows adds up to 205% for the short side, with an annualized return of 13.21%. The Sharpe ratio of 1.16 suggests that, historically, the risk-adjusted outcome of following this specific CCL seasonal trend has been strong compared with many single-name patterns. The TradeWave Ratio of 1.72 indicates that price has typically traveled meaningfully in the trade direction within the window, which matters for traders who manage risk around intraperiod swings rather than just end-of-window closes.
Intraperiod behavior has been volatile. Maximum favorable excursions have reached as high as 21.98% in 1990 and 21.4% in 1998, meaning that at some point during those windows, the stock moved more than 20% in the short seller’s favor before the final close. On the flip side, maximum adverse excursions have been deep in several years, including -29.51% in 1990 and -27.48% in 2002, showing that even in ultimately profitable short windows, traders had to sit through large rallies against their position.
Put together, the pattern is clear: this midterm-year summer window has historically favored shorts in Carnival, with 8 wins out of 9 and double-digit average gains for the trade direction. History does not guarantee a repeat, but the consistency across multiple election cycles is hard to ignore.
Why does Carnival (CCL) follow this seasonal pattern?
One likely driver is the clash between peak summer cruise demand and mid-cycle policy and macro uncertainty in midterm election years. Analysts have pointed to fuel price volatility and shifting consumer confidence as recurring headwinds for cruise operators during these stretches, especially when geopolitical risks are elevated.[1] The pattern may also reflect institutional portfolio repositioning around the travel and leisure sector as investors reassess discretionary spending and risk appetite heading into the back half of the election cycle.
History does not guarantee future results; adverse excursions (MAE) can be large even in winning windows.
What is driving Carnival (CCL) today?
Carnival closed at $27.85 on Apr 10, down 0.6% on the session, after a choppy few weeks that still leave the stock up 7.24% over the past month and about 70.6% above its 52-week low of $16.335.[3] The shares remain below their 50-day moving average of $28.51 and are trading with heavy liquidity, with 20-day average volume near 29.8 million shares.[3]
Fundamentally, the story is still about demand and fuel. In March, HSBC upgraded Carnival to Buy with a $30.10 price target, arguing that the stock looked undervalued even as fuel price volatility tied to Middle East conflict kept earnings sensitivity high.[1] Strong cruise demand and record bookings have supported higher ticket prices and better margins, helping Carnival raise its profit outlook for fiscal 2025, including an adjusted EPS forecast that climbed to about $2.14 as demand stayed resilient despite cost pressures.[4][5]
In March 2026, Forbes highlighted that Carnival’s recovery from its earlier slide had been driven by improving fundamentals and a clearer path to deleveraging, even as investors weighed the risk of another pullback after a strong run.[3] Earlier, in June 2025, Carnival shares jumped almost 8% after the company beat Q2 estimates and lifted its annual profit target, a move that underscored how quickly sentiment can swing when earnings surprise to the upside.[4] By late September 2025, the company again raised its annual profit forecast on resilient cruise demand, though Reuters noted that higher costs remained a concern.[5]
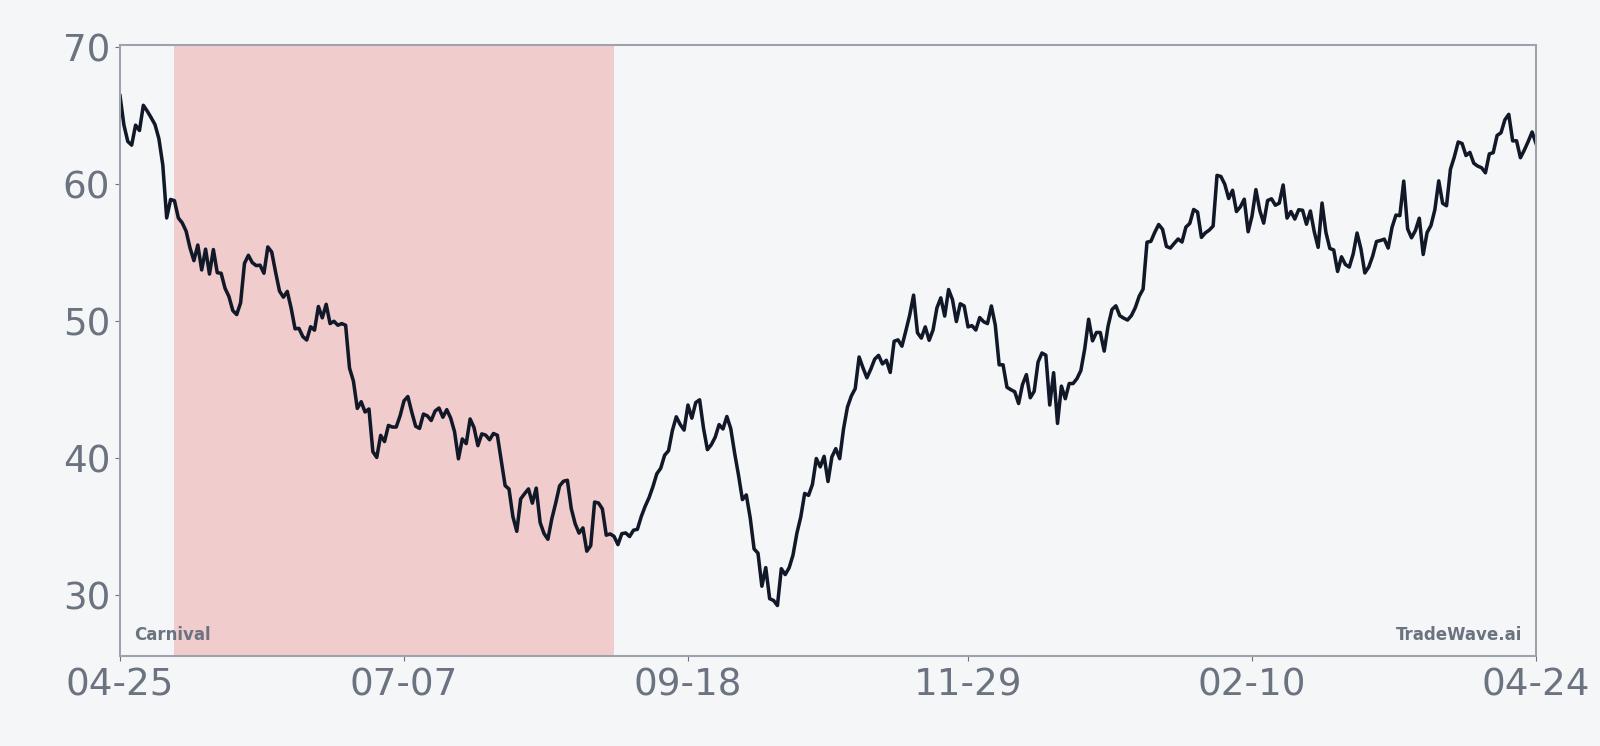
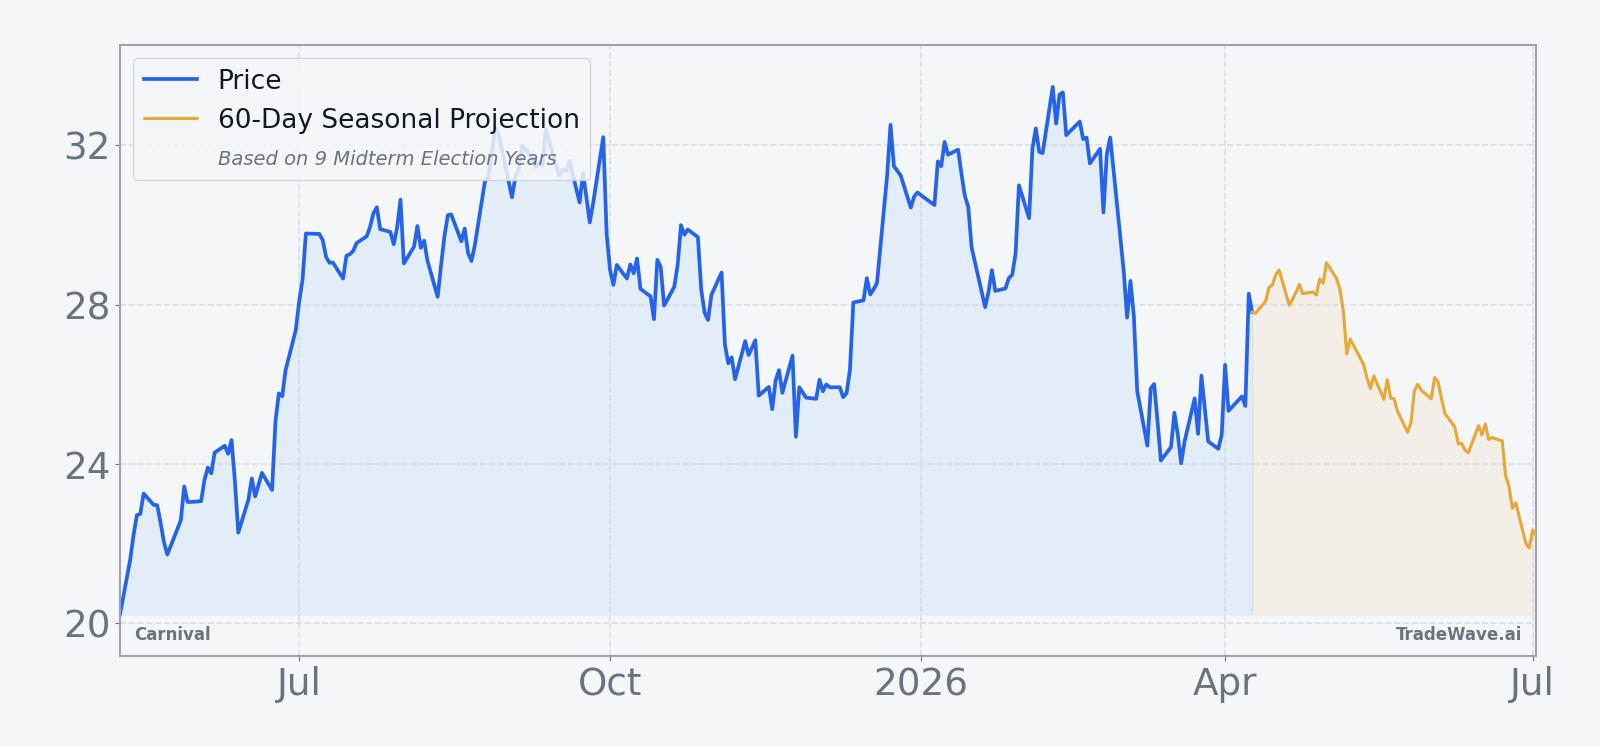
The chart below situates the latest move in its recent multi-month context, alongside a 60-day seasonal projection.
What should traders watch as this Carnival seasonal window approaches?
The upcoming 114-day window opens on May 9, placing it squarely in the early part of the midterm election year and running through much of the core cruise season. Traders watching this CCL seasonal trend will focus on whether the stock continues to lag its 52-week high into the start of the window or stages a late pre-window rally that could change the risk-reward profile for shorts.[3]
Macro-wise, fuel prices and geopolitical headlines remain key swing factors. HSBC has already flagged Carnival’s unhedged exposure to fuel price volatility tied to Middle East conflict, so any renewed spike in energy costs during the window could reinforce the historical downside bias.[1] On the demand side, updates on booking trends and pricing power will matter, especially as investors test whether the record booking environment described in 2025 can persist into another summer season.[4][5]
From a pattern-confirmation standpoint, traders will be watching how quickly any downside develops once the window opens. In several past midterm years, the stock’s maximum favorable move for shorts came early in the window, followed by choppy trading. If Carnival instead grinds higher through June and July, that would mark a clear departure from the typical CCL seasonal pattern and could signal that strong fundamentals are overpowering the historical election-cycle effect.
Finally, liquidity and reaction to news will be important tells. The sharp, almost 8% single-day move after the June 2025 earnings beat showed how violently the stock can respond when expectations reset.[4] If similar earnings or guidance surprises land inside this year’s window, the way the stock trades around those catalysts will show whether the long-running midterm-year short edge is still in play or starting to fade.
Sources
- [1] CNBC, "Stocks making the biggest moves midday: ServiceNow, Salesforce, Southwest, Carnival & more" (Jan 29, 2026)
- [2] Forbes, "Buy Or Fear Carnival Stock?" (Sep 30, 2025)
- [3] Forbes, "Is Carnival Stock A Buy After The Recent 8% Slide?" (Mar 3, 2026)
- [4] Reuters, "Carnival hikes annual profit target on steady cruise demand" (Jun 24, 2025)
- [5] Reuters, "Carnival raises annual profit forecast on resilient cruise demand, high costs loom" (Sep 29, 2025)
- [6] CNBC, "Stocks making the biggest moves midday: Lamb Weston, KB Home, Carnival, Oracle, CoreWeave & more" (Dec 19, 2025)
About this seasonal analysis
Seasonal pattern data is sourced from TradeWave.ai, which analyzes historical price behavior across annual calendar windows going back up to 30 years. Read the full data methodology or the book The 100-Year Pattern by Afshin Moshrefi (2026 edition). Past performance of seasonal patterns does not guarantee future results. This article is for informational purposes only and does not constitute investment advice.