UnitedHealth Group (UNH) Has Rallied 6 of 6 Midterm Springs in This 71-Day Bullish Window
UnitedHealth Group is heading toward a 71-day midterm-election-year seasonal window that has never been negative in this dataset, even as shares trade deep below their 52-week high and insiders have been buying into the slide.

What is the seasonal pattern for UnitedHealth Group (UNH)?
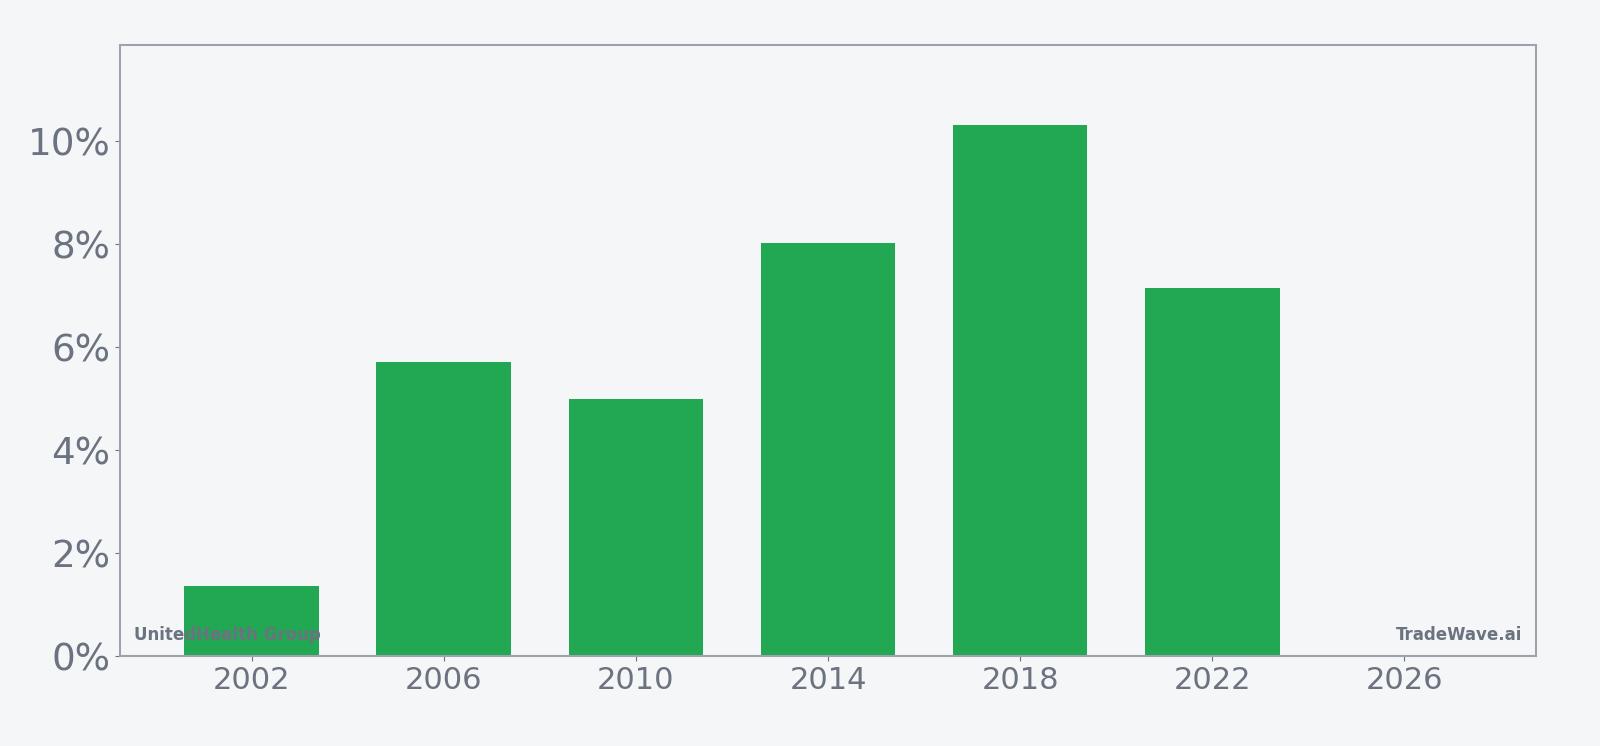
UnitedHealth Group has risen in 6 of 6 midterm-election-year spring windows starting around May 7, with an average gain of 6.25% in winning years.
- 6 for 6 in this window, averaging 6.25% gains in winning years across the last six midterm election cycles.
- The upcoming pattern runs 71 trading days from May 7, 2026, and has historically favored long positions in UNH.
- Percent Profitable is 100%, with 6 winners and 0 losers in this specific UnitedHealth Group trading window.
- Average profit in winning years is 6.25%, with a cumulative return of 43% across all six historical windows.
- Intraperiod swings have been meaningful, with best-case rallies above 10% in some years and adverse moves that have briefly exceeded 8% before recovering.
- The TradeWave Ratio of 9.95 and Sharpe ratio of 1.8 point to a historically strong, directional seasonal trend rather than random noise.
According to historical data from TradeWave.ai, this midterm-election-year stretch has behaved very differently from an average spring for UnitedHealth Group, and the next iteration is less than a month away.
How has UnitedHealth Group (UNH) traded in this midterm-year spring window?
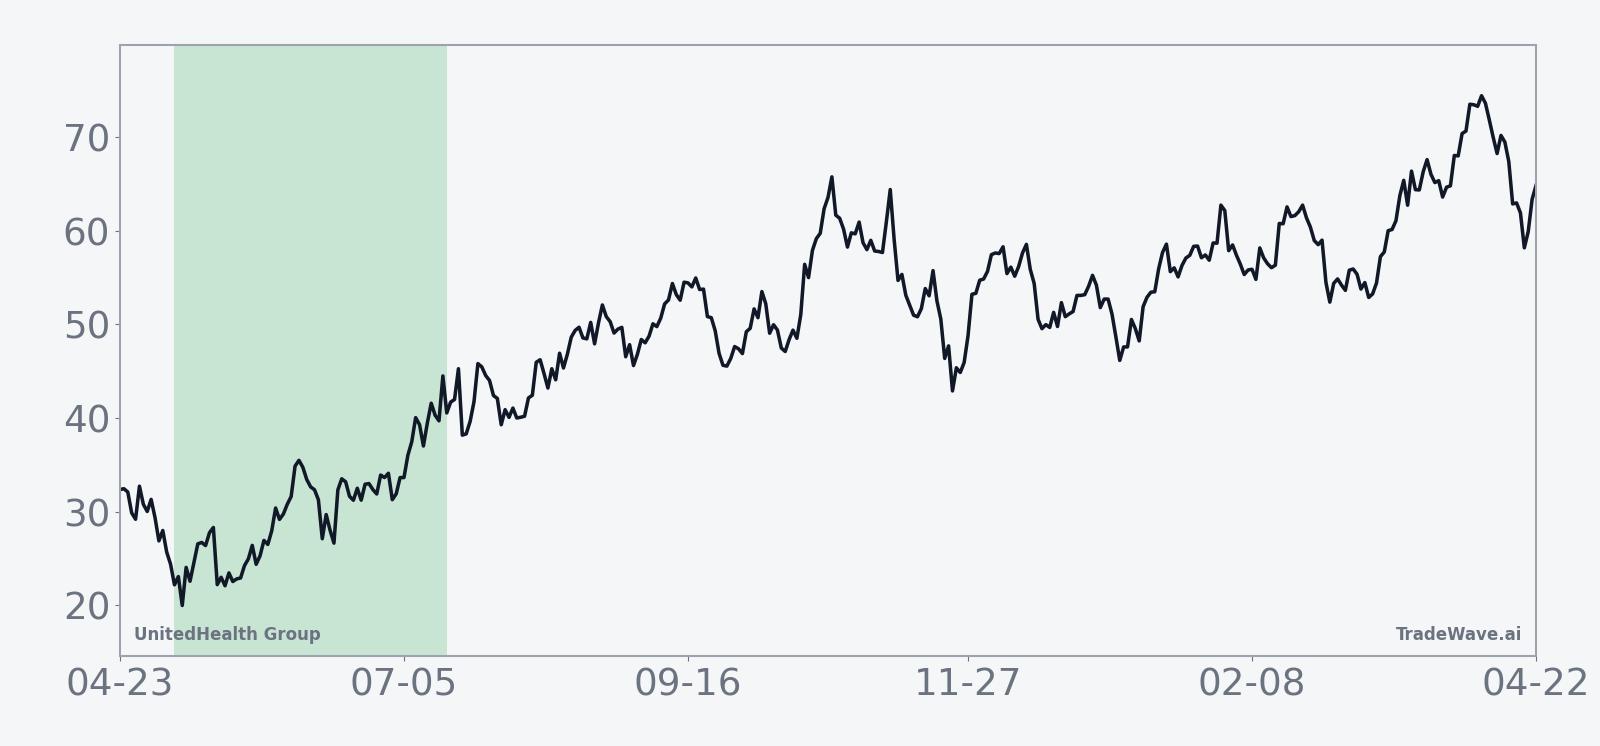
UnitedHealth Group has posted gains in every one of the last six midterm-election-year windows starting around May 7, averaging a 6.25% advance over 71 trading days. Shares finished Thursday at $305.98, down 0.6% on the day and sitting about 47.5% below their 52-week high of $582.51, a backdrop that makes this historically strong UNH seasonal trend stand out. In May 2025, CNBC reported that insiders stepped in to buy stock as UnitedHealth sold off, signaling that some executives viewed the weakness as an opportunity rather than a lasting impairment.[12] That mix of deep drawdown, insider support and a clean seasonal record gives this upcoming UnitedHealth Group trading window unusual weight on the healthcare sector’s calendar.
Because this pattern is grouped by the presidential election cycle, it only looks at the last six midterm election years rather than every calendar year. That matters for a politically sensitive healthcare stock like UnitedHealth Group, since midterm years often bring budget fights, Medicare debates and regulatory noise that can cluster volatility into specific parts of the year.
This seasonal window begins on May 7, 2026 and spans 71 trading days. Historically, during this period, UnitedHealth Group has shown a strong bullish tendency in midterm election years, with all six prior windows finishing higher and a cumulative gain of 43% across the sample. The trade direction is long, so those positive returns line up with the intended side of the trade rather than coming from short squeezes or one-off spikes.
The win–loss record is clean: Percent Profitable is 100%, with 6 winners and 0 losers. Average profit in winning years is 6.25%, while the median outcome is slightly higher at 6.43%, which suggests the distribution has not been skewed by a single outlier year. The weakest year in the sample was 2002, when the stock still gained 1.36% over the window, while the strongest was 2018 with a 10.31% net return.
Intraperiod swings have been meaningful. In 2006, UnitedHealth’s best point-to-peak move, or maximum favorable excursion, reached 8.58%, but the worst drawdown from entry, or maximum adverse excursion, hit -8.07% before the stock recovered into a positive close. In 2022, the pattern delivered a 7.15% net gain, with a 9.79% peak run-up and a -7.22% worst drawdown along the way, underscoring that even “all green” windows can feel volatile in real time.
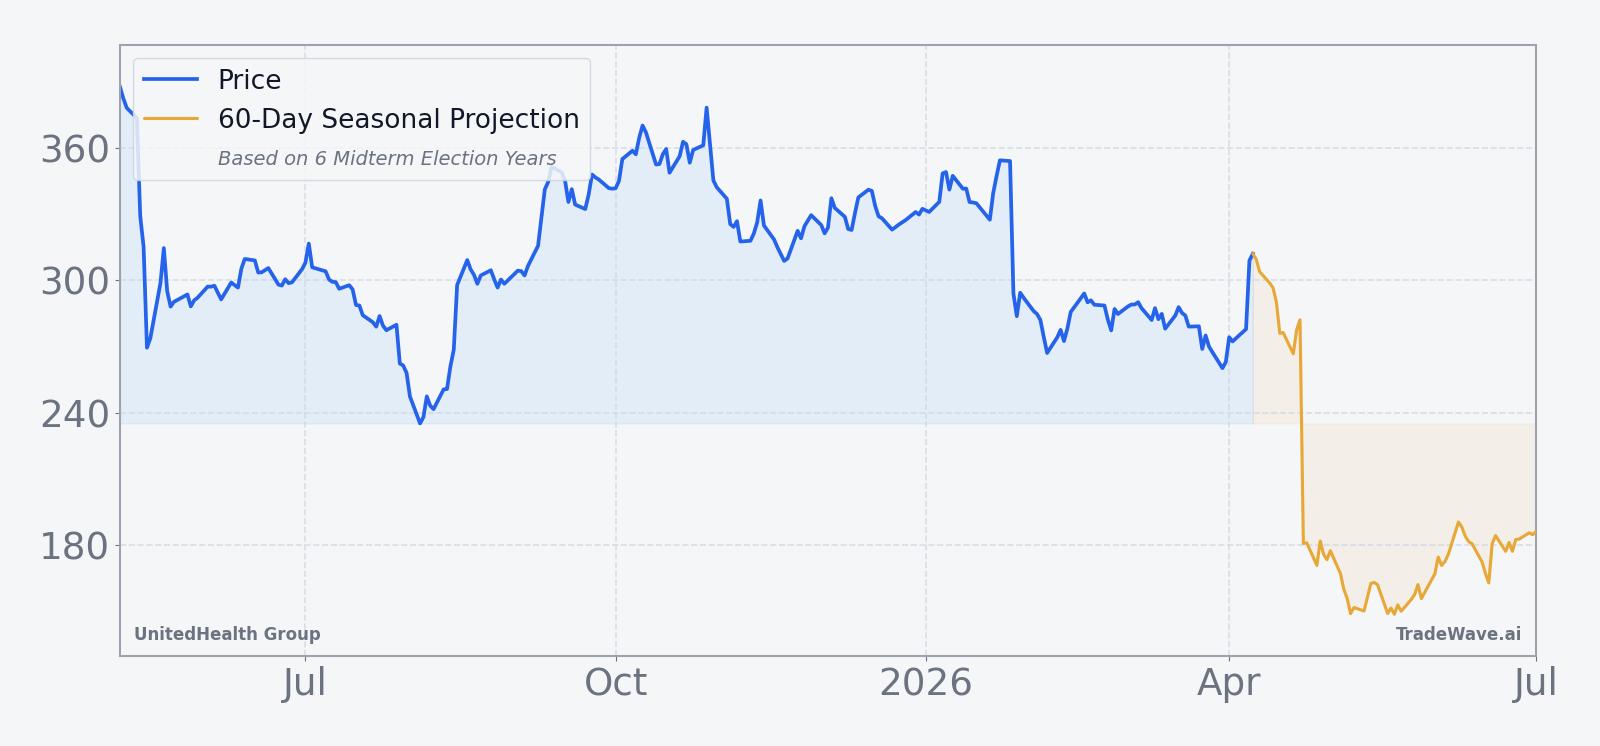
The historical seasonal average trend for this window slopes higher for most of the 71 days, with gains tending to build steadily rather than arriving in a single burst. The profile shows modest early strength, a brief consolidation phase, and then a more persistent climb into the back half of the window, which lines up with the idea that policy headlines often clear after early-summer budget and Medicare debates.
The combined net-return and excursion bars put those rallies and drawdowns side by side for each year.
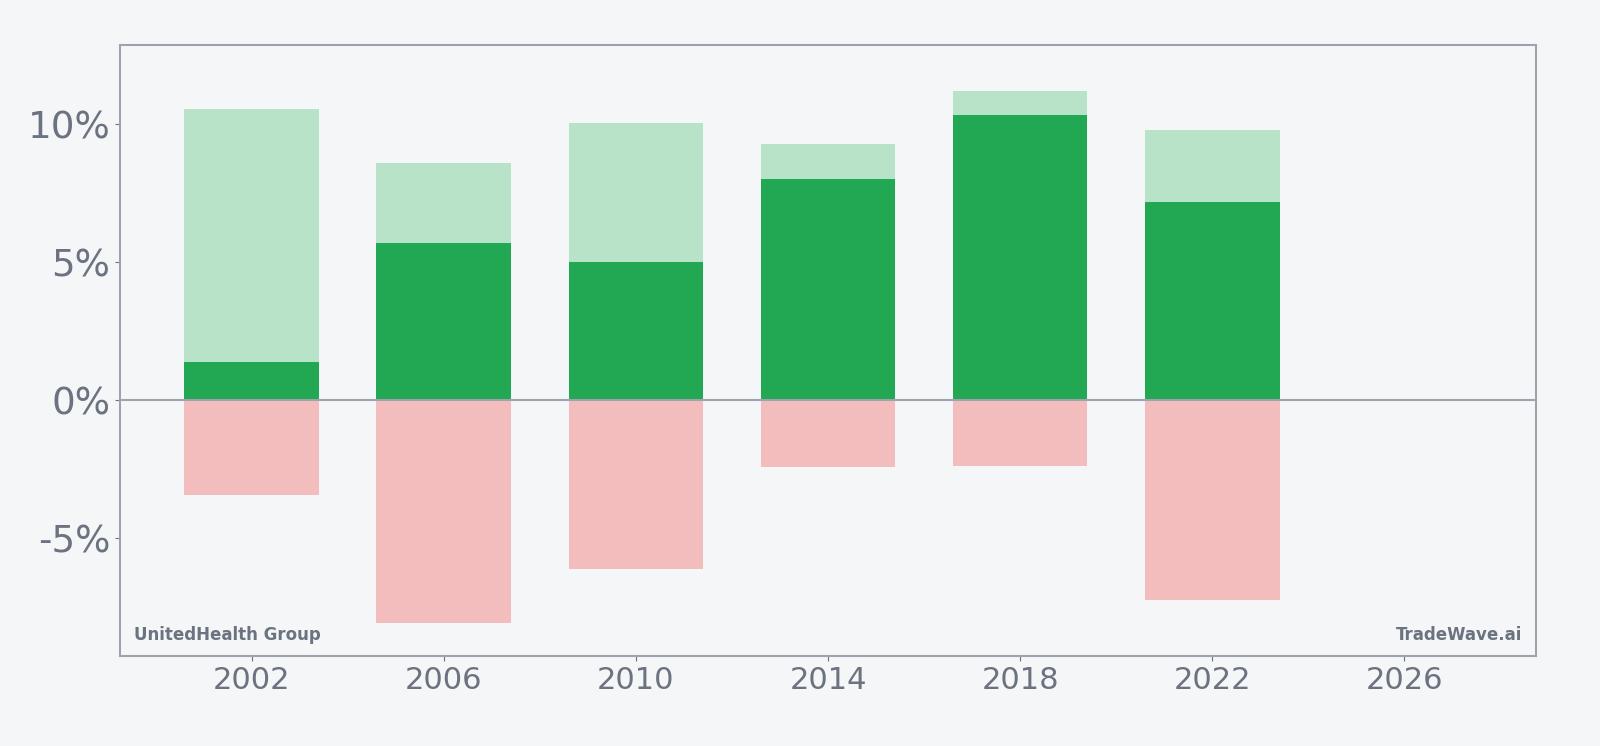
The stacked net, maximum favorable excursion and maximum adverse excursion bars show a consistent pattern: every year finished positive, most years saw double-digit peak rallies at some point, and several years also experienced mid-window drawdowns of 6% to 8% before recovering. Add it up: this has been a bullish but bumpy stretch for longs, with enough intraperiod downside to shake out weak hands even in winning years.
History does not guarantee future results; adverse excursions can be large even in winning windows, and traders should treat this seasonal pattern as context rather than a forecast.
Why does UnitedHealth Group (UNH) follow this seasonal pattern?
One likely driver is the way healthcare policy and Medicare funding debates bunch up in the first half of midterm election years, often clearing enough by late spring to reduce headline risk for managed-care stocks. Analysts have also pointed to institutional portfolio repositioning around midyear, as investors rebalance exposure to defensive sectors like healthcare once early-year volatility in broader markets has played out. This UNH seasonal trend may reflect that combination of fading policy uncertainty and renewed demand for stable earnings growth as the midterm election year moves from its choppy early phase toward the historically stronger pre-election year.
What is driving UnitedHealth Group (UNH) today?
UnitedHealth Group closed Thursday at $305.98, down 0.6% on the session, after trading between $304.83 and $312.97 on volume of about 9.6 million shares, slightly above its 20-day average of roughly 9.4 million. The stock sits well below its 50-day moving average of $282.49 and about 47.5% under its 52-week high of $582.51, a collapse that has turned a former market leader into one of the more controversial names in large-cap healthcare. In May 2025, CNBC reported that some insiders were buying shares as they “tanked,” a move that suggested confidence in the company’s long-term fundamentals despite pressure from rising medical costs and regulatory uncertainty around drug pricing.[12]
In April 2025, Reuters reported that UnitedHealth shocked investors with a first-quarter earnings miss and cuts to its full-year profit forecast, citing higher medical costs that squeezed margins.[7] Later that year, the company’s own October 2025 earnings release showed a rebound, with third-quarter revenues of $113.2 billion, up 12% year over year, and adjusted EPS of $2.92 that beat expectations while management raised full-year 2025 earnings guidance to at least $16.25 per share.[3] Those swings in fundamentals and sentiment help explain why the stock’s chart has been so volatile heading into 2026, even as the longer-term UNH seasonal trend around midyear has remained consistently positive in the historical data.
Regulatory risk remains a key overhang. In May 2025, Yahoo Finance highlighted how an executive order on drug pricing from former President Trump added to the pressure on UnitedHealth’s shares by raising questions about reimbursement and pricing power across the healthcare ecosystem.[2] Sector commentary from Seeking Alpha has also focused on rising medical costs and potential Medicare funding cuts as structural headwinds for managed-care margins, even for a scale player like UnitedHealth.[1] That policy backdrop is exactly why the election-cycle framing matters: midterm years often concentrate these debates, and the historical UNH seasonal pattern suggests that once the early-year storm passes, the stock has tended to find its footing in the May-to-summer window.
The chart below situates the latest move in its recent multi-month context alongside a 60-day seasonal projection.
What should traders watch as this UNH seasonal window approaches?
First, the calendar: the 71-day window starting May 7 sits in the early part of the midterm election year and runs into the heart of summer, a period when Washington’s budget and Medicare debates often cool down. Traders will be watching whether UnitedHealth can stabilize above the recent lows and reclaim the 50-day moving average before or early in the window, which would align more closely with the historical pattern of steady gains rather than deep mid-window drawdowns.
Second, policy and macro catalysts will matter. Any fresh headlines on Medicare reimbursement, drug pricing or broader healthcare reform could either reinforce or disrupt the typical UNH seasonal trend, especially if they land in the first few weeks of the window when historical drawdowns have sometimes been sharp. The next major earnings update and any revisions to guidance will also be key checkpoints for whether the fundamental story is improving from the 2025 shock or still under pressure.[3][7]
Third, traders should keep an eye on insider behavior. In May 2025, CNBC reported that insiders were buying into UnitedHealth’s weakness, a signal that helped frame the subsequent debate over whether the stock had overshot to the downside.[12] If a similar pattern of insider accumulation appears as this seasonal window opens, it would echo the historical script of a bruised but ultimately resilient stock; if insider activity dries up or flips to selling, that would be a clear divergence from the supportive backdrop seen in the last cycle.
Finally, the behavior inside the window itself will be the real test. A path that features early volatility but ultimately delivers a mid-single-digit or better gain by the end of the 71 days would be consistent with the last six midterm election years. A flat or negative outcome, especially if accompanied by unusually deep intraperiod drawdowns, would mark a clear break from the established UNH seasonal trend and could signal that the combination of regulatory risk and cost pressure has shifted the playbook for this cycle.
Sources
- Seeking Alpha: UnitedHealth stock rises on Q3 beats, raised guidance (UNH:NYSE) (Oct 28, 2025)
- Yahoo Finance: Donald Trump’s Executive Order Maintains the Pain on UnitedHealth Stock (UNH) (May 16, 2025)
- UnitedHealth Group: Third Quarter 2025 results and raised full-year 2025 earnings outlook (Oct 28, 2025)
- Seeking Alpha: UnitedHealth Group: Recovery Might Take Longer, But Contrarians Know What To Do (Jan 27, 2026)
- Seeking Alpha: UnitedHealth faces critical test as Q2 results loom (UNH:NYSE) (Jul 28, 2025)
- Forbes: Buy or Fear UNH Stock At $345? (Sep 26, 2025)
- Reuters: UnitedHealth shares crash after surprise earnings miss, cuts to forecast (Apr 17, 2025)
- Seeking Alpha: UnitedHealth: Should You Buy This Falling Knife? (NYSE:UNH) (May 15, 2025)
- Seeking Alpha: UnitedHealth Group: Double Whammy Disaster (NYSE:UNH) (Jan 27, 2026)
- Seeking Alpha: UnitedHealth: Stock Plunges, But Looks Cheap On Valuation Models (May 16, 2025)
- CNBC: Tanking UnitedHealth shares see some insiders step in to buy (May 16, 2025)
About this seasonal analysis
Seasonal pattern data is sourced from TradeWave.ai, which analyzes historical price behavior across annual calendar windows going back up to 30 years. Read the full data methodology or the book The 100-Year Pattern by Afshin Moshrefi (2026 edition). Past performance of seasonal patterns does not guarantee future results. This article is for informational purposes only and does not constitute investment advice.