Data Center AI Demand Can't Offset Intel (INTC) Margin Squeeze Into Seasonally Weak 33-Day Run
Intel is trading just off a 52-week high as it approaches a 33-day midterm-year window that has often leaned lower, setting up a tension between momentum and historical seasonality.

What is the seasonal pattern for Intel (INTC)?
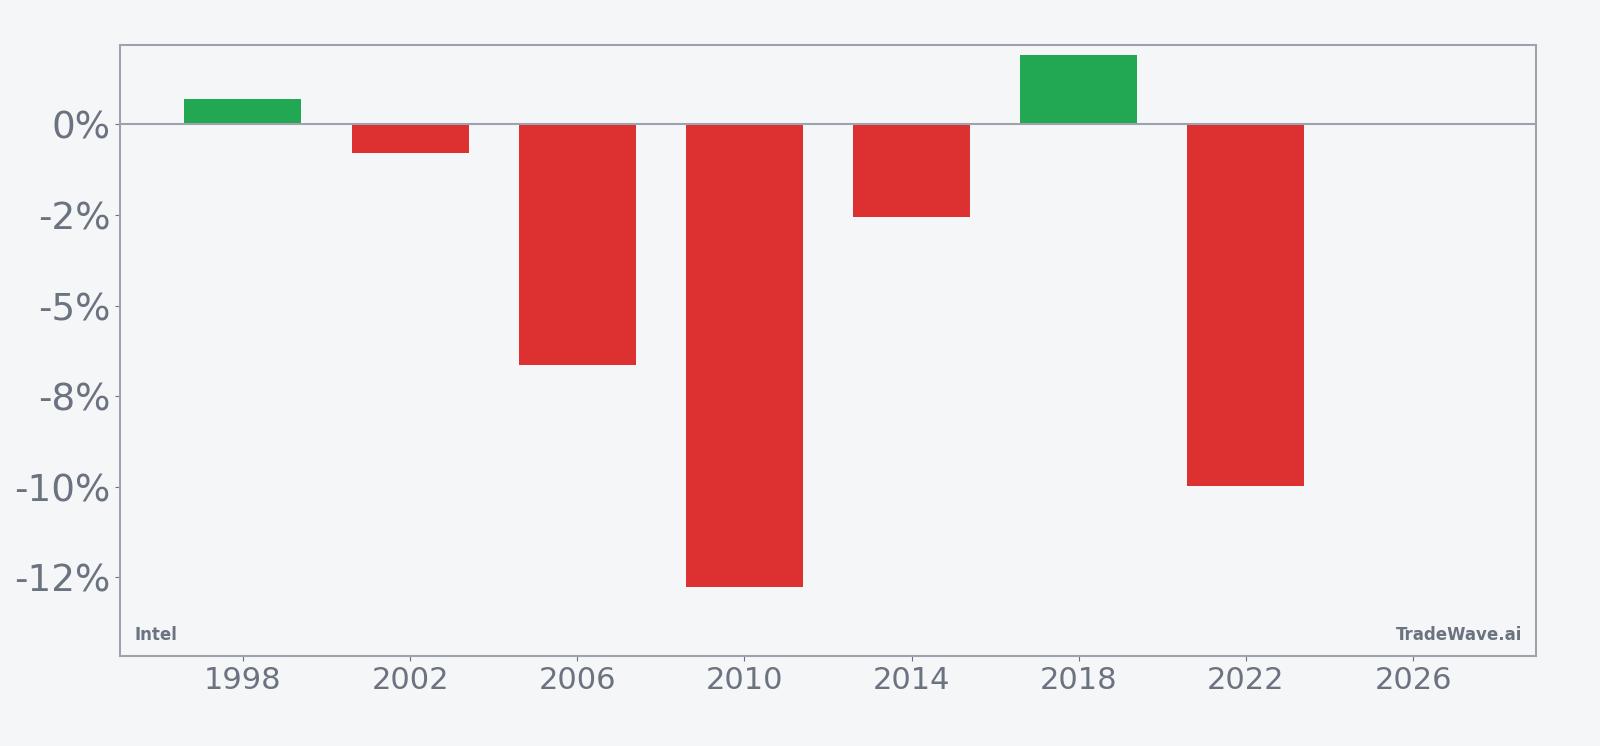
Intel has fallen in 5 of 7 midterm-year spring windows during this 33-day pattern, with an average gain of 6.55% in winning years.
- 5 winners and 2 losers in this window, with winning years averaging 6.55% moves in Intel.
- The 33-day window starts Apr 18 and covers the last 7 midterm election years, a phase that often trades differently from normal cycles.
- Percent Profitable is 71%, with 5 winners and 2 losers, while the all-years average outcome is a smaller 4% move.
- Trade Direction is short, meaning the historical pattern has tended to reward downside positioning when the window turns out well.
- Maximum adverse excursions have reached as deep as about 16% in some years, showing that even “good” setups can see sharp squeezes.
- The TradeWave Ratio of 1.32 and a Sharpe ratio of 0.71 point to a window where moves in the trade direction have been meaningful but not one-way.
According to historical data from TradeWave.ai, this specific midterm-year spring stretch has behaved differently from a typical month for Intel, with a distinct short-side bias that shows up across multiple cycles.
How has Intel (INTC) traded in this midterm-year spring window?
Intel has tended to struggle in this 33-day midterm-year spring window, with a short-side pattern that has worked in 5 of the last 7 cycles and an all-years average move of 4% in the trade direction. The next iteration begins on Apr 18, just as the stock trades at 58.95, about 0.4% below its 52-week high of 59.17. That combination of a stretched price and a historically soft Intel trading window is what makes this slice of the calendar stand out for stock pattern analysis.
Because this pattern is grouped by the presidential election cycle, it only looks at the last 7 midterm election years rather than every calendar year. That matters for a stock like Intel, where policy swings around industrial subsidies, export controls and data center spending can cluster in specific phases of the White House cycle and shape how chipmakers trade.
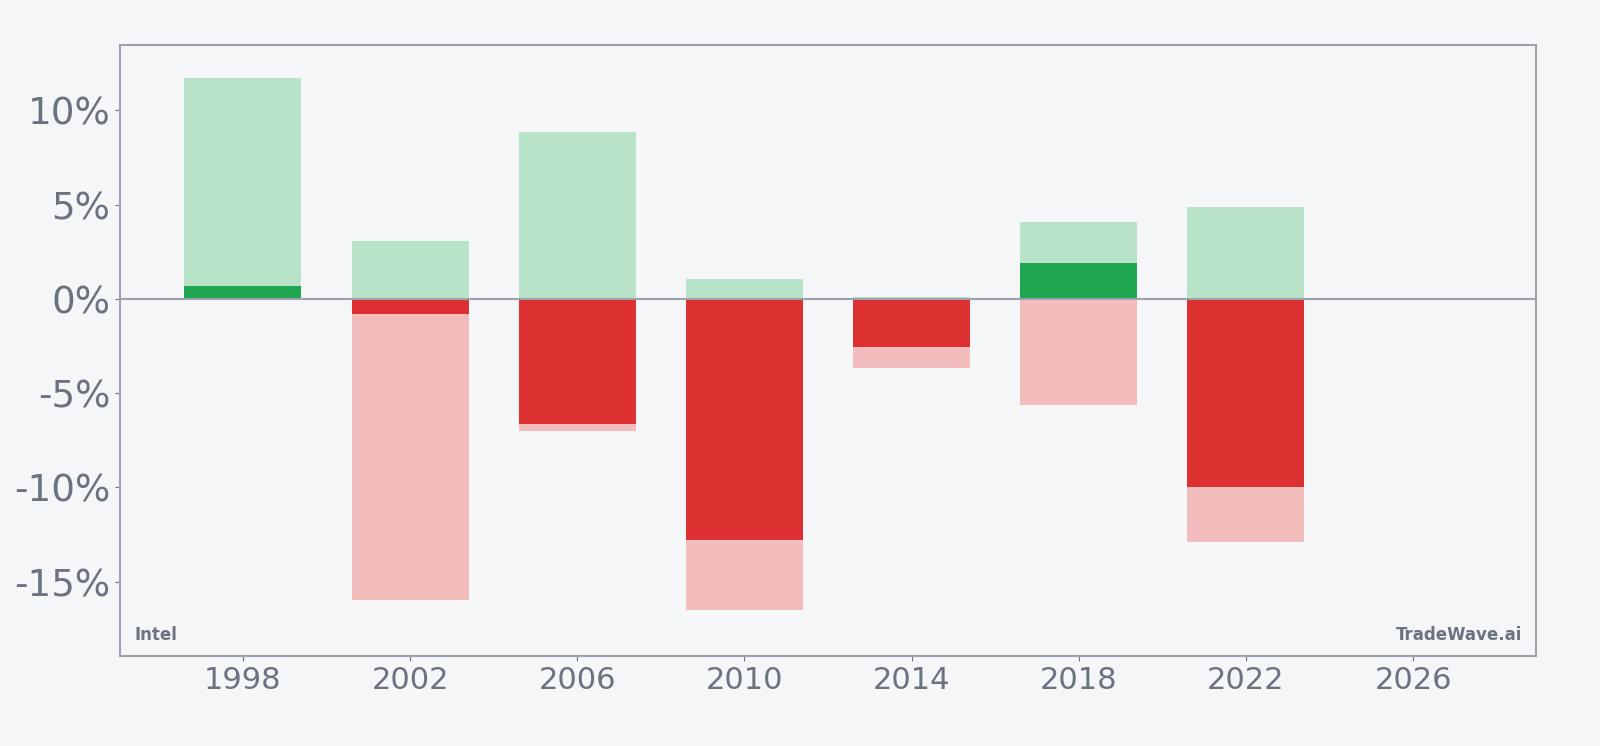
A stacked view of net results alongside best and worst intraperiod swings shows how far Intel has tended to travel in both directions inside this window.
Across the seven midterm-year samples, the short-side Intel seasonal trend has more winning years than losing ones, but the path has not been smooth. Percent Profitable sits at 71%, with 5 winners and 2 losers, and winning years show an average move of 6.55% in favor of the short direction, while including all years trims that to a 4% average outcome. The historical seasonal trend chart suggests that when the pattern works, much of the move tends to build during the middle of the 33-day window rather than in a single gap at the start or end.
The per-year table shows how wide the range of outcomes has been. In 2010, for example, Intel delivered a net return of about -12.77% over the window, a strong year for the short setup, with the worst intraperiod drawdown from entry reaching roughly -16.5% and only a modest 1.04% favorable move at best. By contrast, 1998 printed a small 0.69% net gain against the short direction, but the maximum favorable move inside the window reached 11.72%, meaning a trader leaning short could have seen a large unrealized profit evaporate before the final close.
The MFE and MAE profile underlines that point. Maximum favorable excursions have reached into the high single digits in several years, while maximum adverse excursions have pushed into the low to mid-teens, including about -16.0% in 2002 and -12.89% in 2022. That mix of large positive and negative swings is what the TradeWave Ratio of 1.32 and Sharpe ratio of 0.71 are capturing: this Intel trading window has historically offered meaningful travel in the short direction, but with enough volatility that timing and risk controls mattered as much as direction.
Put together, the pattern is clear: this midterm-year spring window has leaned in favor of shorts more often than not, but the swings inside the 33 days have been big enough that both squeezes and follow-through have shown up in the record.
Why does Intel (INTC) follow this seasonal pattern?
One likely driver is the way Intel’s earnings calendar and guidance updates line up with the midterm-year policy backdrop, when Washington often debates budgets, industrial subsidies and export rules that matter for chipmakers. Analysts have also pointed to institutional portfolio rebalancing around early-year tech rallies, which can leave high-flying semiconductor names vulnerable to profit-taking in April and May. This Intel seasonal trend may reflect that mix of policy uncertainty, sector rotation and post-earnings digestion that tends to cluster in the early part of midterm election years.
History does not guarantee future results; adverse excursions can be large even in winning windows, and past Intel seasonal behavior may not repeat.
What is driving Intel (INTC) today?
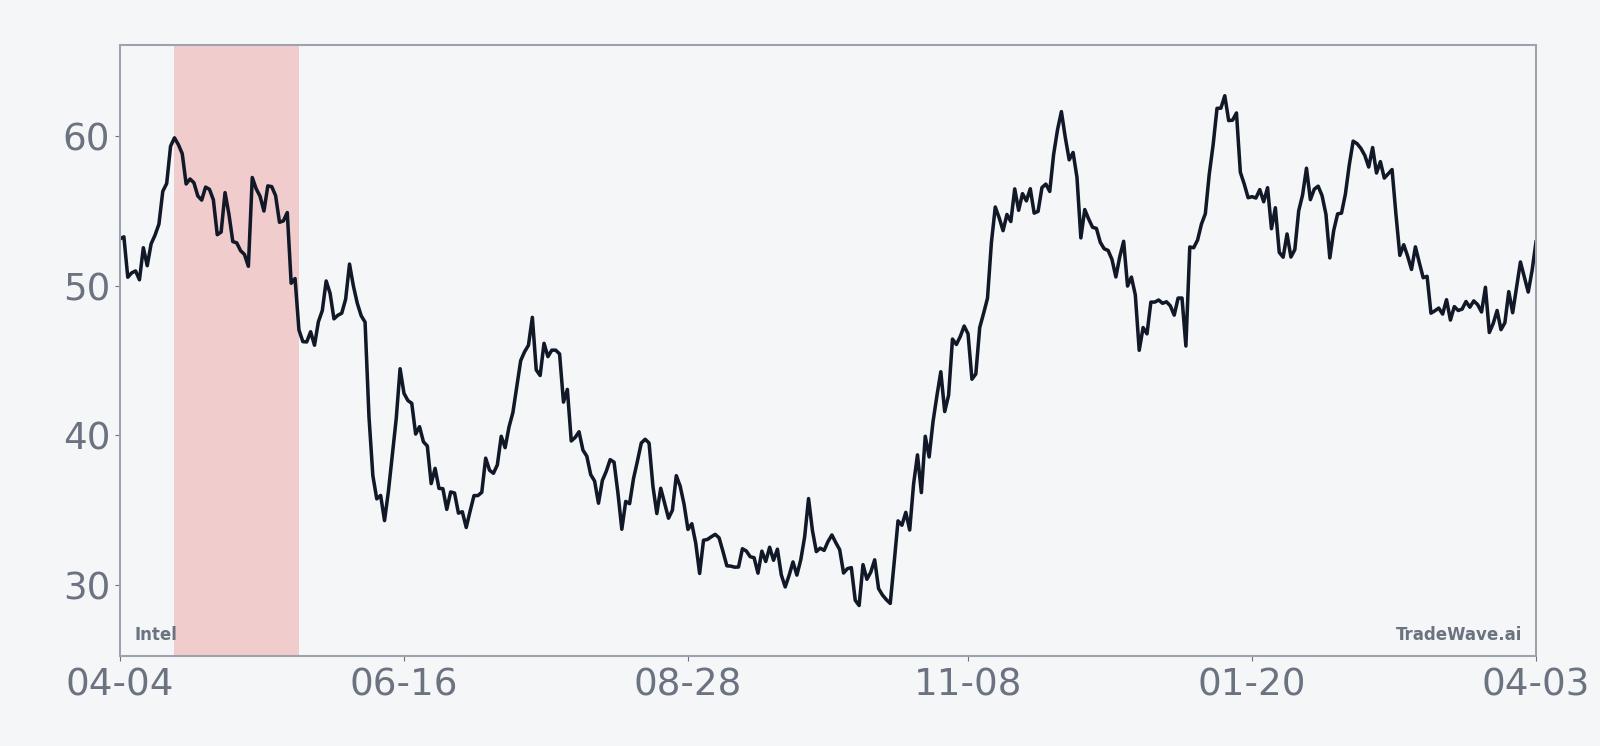
Intel closed at 58.95 on Apr 8, up 11.4% on the day and roughly 26.02% over the past month, leaving the stock just about 0.4% below its 52-week high of 59.17 on heavy volume of 183.5 million shares versus a 20-day average of 96.8 million. That surge has come after a string of AI and data center headlines in early 2026, including strong server CPU demand and optimism around Intel’s role in powering AI data centers, even as earlier guidance flagged manufacturing constraints and a seasonally weaker first quarter for 2026.[1][3][6][14]
The chart below situates the latest move in its recent multi-month context alongside a 60-day seasonal projection.
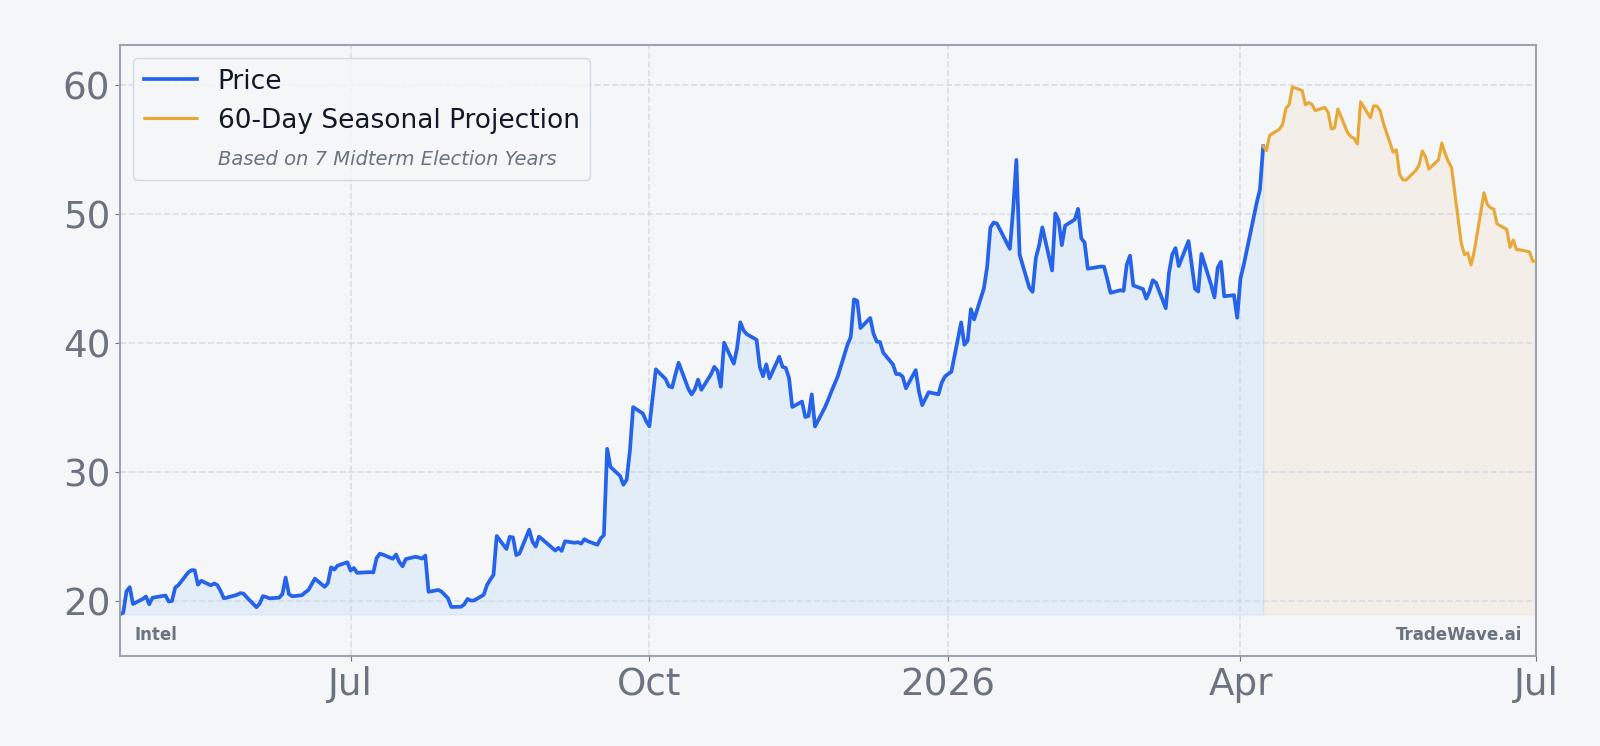
In January 2026, coverage from major outlets described how strong fourth-quarter 2025 data center demand and a strategic investment and partnership with Nvidia helped fuel Intel’s rally, even as analysts debated whether the stock’s valuation had run ahead of fundamentals.[3][4][7][9][10][14] Earlier reports in late 2025 detailed how Intel’s push into advanced 18A manufacturing, foundry customers and high-profile backing from large tech buyers were central to its turnaround narrative, but also highlighted that weak near-term outlooks and macro headwinds could keep volatility elevated.[2][5][6][11][12][13]
For traders watching the upcoming Intel seasonal window, the setup is straightforward: a stock that has ripped higher on AI enthusiasm and policy-sensitive capex themes is about to enter a midterm-year stretch that has historically leaned lower for this name. What happens inside that 33-day Intel trading window will show whether the current AI and data center story is strong enough to overpower the historical seasonality, or whether the pattern of midterm-year giveback reasserts itself.
Sources
- CNBC, "Intel’s earnings beat couldn’t offset a weaker-than-expected outlook. Here’s what analysts are saying" (Jan 23, 2026)
- Bloomberg, "Intel Faces High Earnings Bar as Stock Soars and Cash Pours In" (Oct 23, 2025)
- Yahoo Finance, "Why Intel (INTC) Stock Is Trading Up Today" (Jan 13, 2026)
- Barron's, "Intel Stock Surges to 4-Year High Ahead of Earnings. Why Optimism Is Growing" (Jan 21, 2026)
- GuruFocus, "Intel (INTC) Secures Business for Advanced Chip Manufacturing Pr" (Oct 17, 2025)
- Yahoo Finance, "Intel Shares Plunge After Weak Outlook Overshadows Solid First-Quarter Beat" (Apr 25, 2025)
- Forbes, "Is Intel Stock Overvalued?" (Jan 9, 2026)
- Barchart.com, "Intel Stock Pops on Estimate-Beating Q3. Options Data Tells Us INTC Could Be Headed Here Next" (Oct 24, 2025)
- Yahoo Finance, "Why Is Intel (INTC) Stock Soaring Today" (Jan 2, 2026)
- Yahoo Finance, "Intel (INTC) Draws Strategic Nvidia Investment as Chip Testing Plans Shift" (Jan 3, 2026)
- Seeking Alpha, "Intel looks to Apple as Tan seeks to bring shine back to chipmaker: report" (Sep 24, 2025)
- Reuters, "Intel results to show if barrage of investments in chipmaker paying off" (Oct 22, 2025)
- Seeking Alpha, "Intel, Nvidia deal may have implications for Astera Labs, Morgan Stanley says" (Sep 19, 2025)
- Reuters, "Intel results to spotlight turnaround efforts as AI data centers boost chip demand" (Jan 21, 2026)
About this seasonal analysis
Seasonal pattern data is sourced from TradeWave.ai, which analyzes historical price behavior across annual calendar windows going back up to 30 years. Read the full data methodology or the book The 100-Year Pattern by Afshin Moshrefi (2026 edition). Past performance of seasonal patterns does not guarantee future results. This article is for informational purposes only and does not constitute investment advice.