Marvell Technology (MRVL) Has Dropped in 6 of 6 Midterm Summers, Averaging 14.37% Short Profits
Marvell Technology is heading into a midterm-year summer stretch that has consistently favored the short side, just as the AI chip name trades near record highs after a powerful earnings-driven run.

What is the seasonal pattern for Marvell Technology (MRVL)?
Marvell Technology has fallen in 6 of 6 midterm-year summer windows during this 72-day pattern, with an average gain of 14.37% in winning short trades.
- 6 for 6 in this window for short trades, with average profits of 14.37% across winning years.
- Seasonal window starts Jun 6 and runs 72 trading days, covering the heart of the midterm-year summer.
- Percent Profitable is 100%, with 6 winners and 0 losers for the short-side pattern.
- Annualized return across these midterm-year windows is 14.23%, with a Sharpe ratio of 2.15 for end-of-window outcomes.
- TradeWave Ratio of 2.14 signals that price has typically traveled meaningfully in the trade direction within the window.
- Individual years have seen adverse moves as deep as about 42.73% against the short before finishing profitable, underscoring intraperiod volatility.
According to historical data from TradeWave.ai, this midterm-year summer stretch has behaved very differently from an average quarter for Marvell, and the next iteration is about to open.
How has Marvell Technology (MRVL) traded in past midterm-year summer windows?
Marvell Technology has delivered profitable short-side trades in every one of the last six midterm-year summer windows, with an average gain of 14.37% for those shorts. The stock closed Thursday at $204.70, up 3.0% on the day and about 6.2% below its 52-week high of $218.26, after more than doubling year to date. That combination of a powerful AI-driven uptrend and a historically bearish midterm-year summer pattern sets up a sharp contrast for traders watching the June 6 window.
The pattern is grouped by the presidential election cycle, focusing on the last six midterm election years rather than consecutive calendar years. That matters because policy uncertainty, rate debates and fiscal wrangling often cluster in midterm summers, and semiconductor names tied to data-center capex can feel those swings more acutely than the broader market.
Across those six midterm-year samples, every window ended with Marvell lower than where it started, which is favorable for a short setup. The strongest year for shorts was 2002, when the stock fell 24.49% over the window, while the softest was 2018 with an 8.06% decline. Even the most modest of those moves still produced a meaningful short-side gain in a 72-day span.
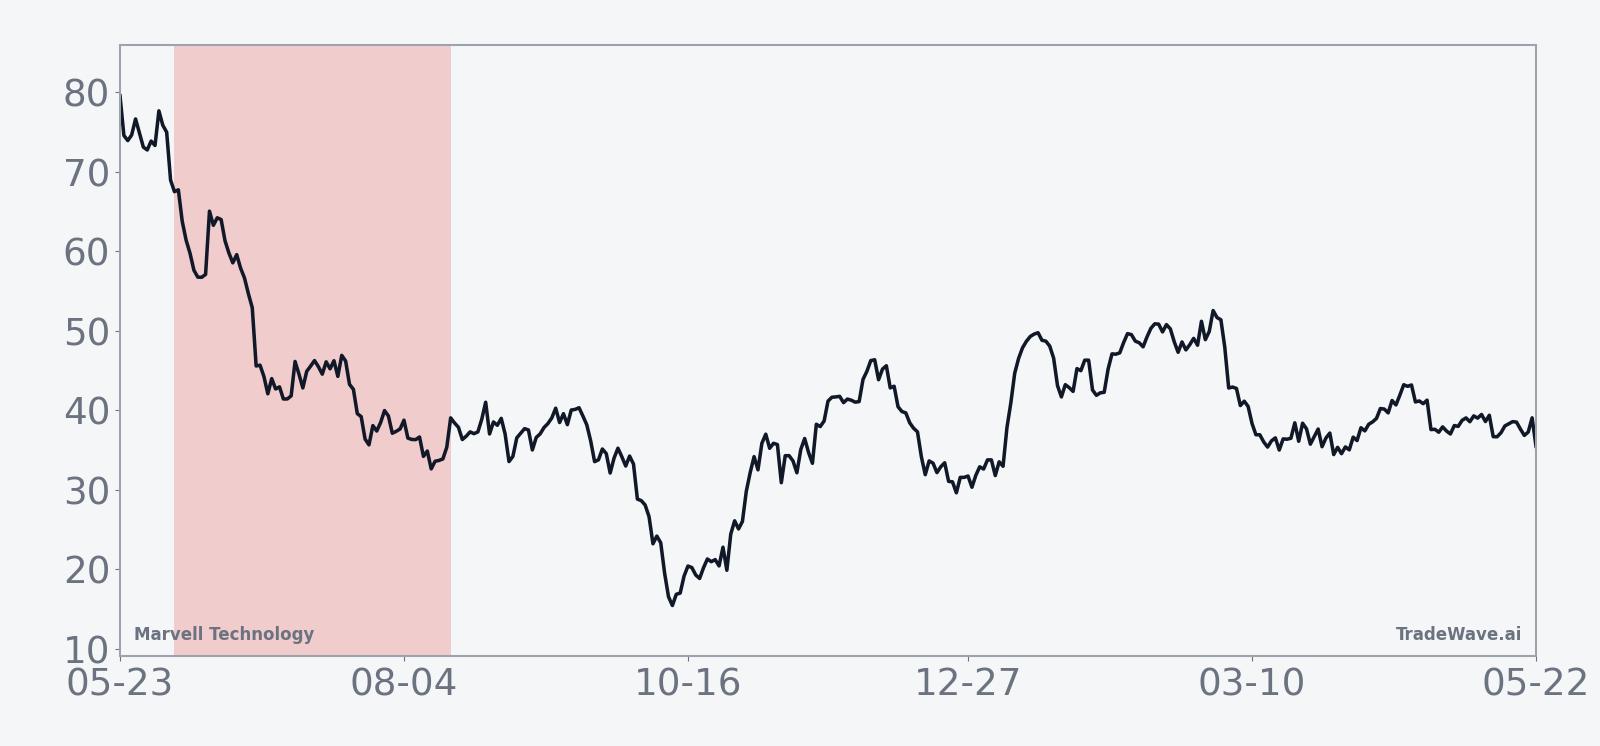
The historical seasonal trend line slopes steadily lower through much of the window, with the bulk of the downside accruing in the middle third of the period. That suggests prior midterm summers have often started with some noise, then seen selling pressure build as the window progressed, before stabilizing toward the end.
Year-by-year bars with maximum favorable and adverse moves show how far MRVL has tended to swing inside this window.
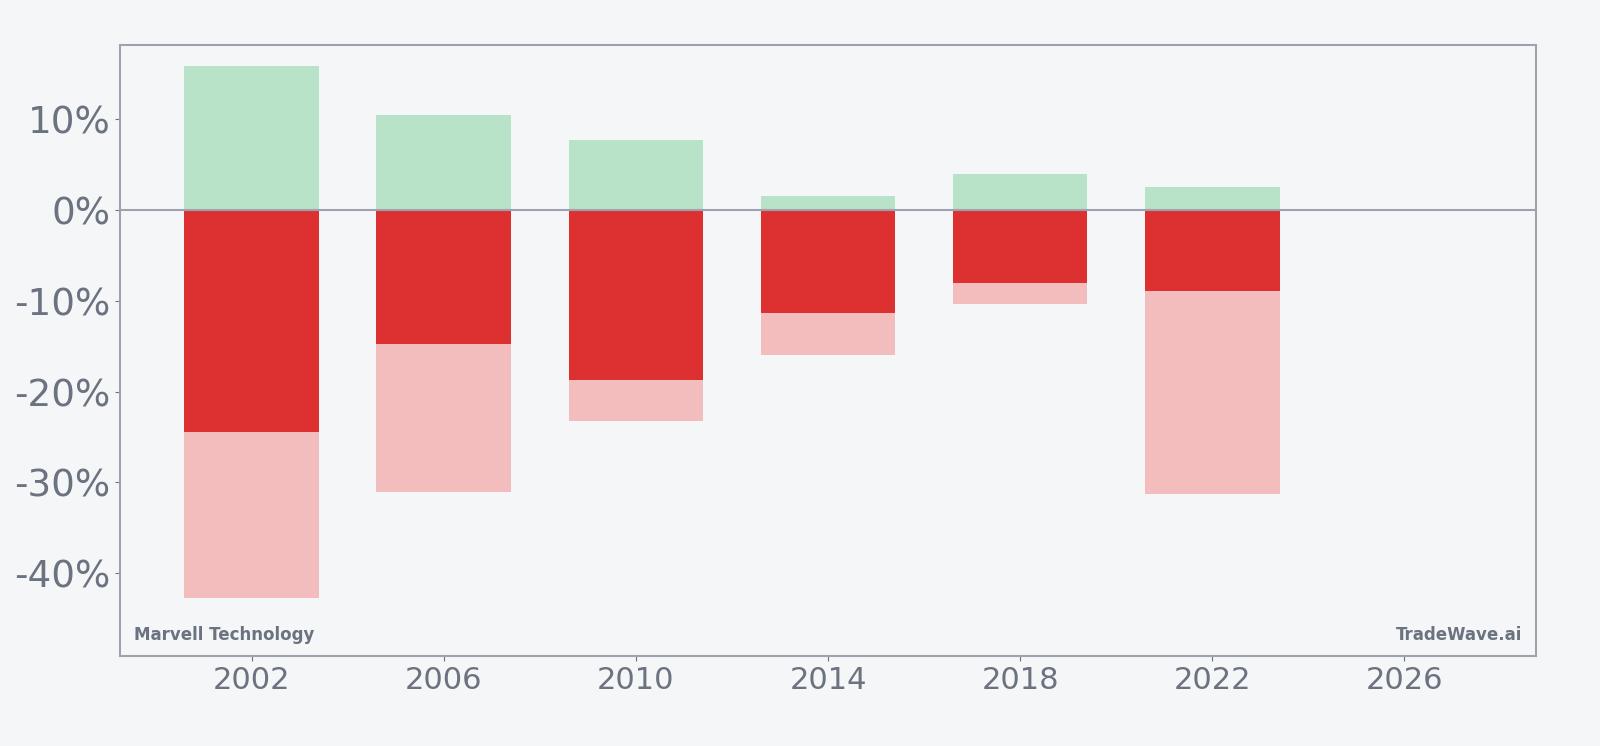
The maximum favorable move for shorts has ranged from 7.7% to 15.78%, while the worst intraperiod move against the trade has been as large as 42.73% in 2002 and 31.25% in 2022. That profile points to a high-variance window where the eventual direction has been consistent but the path has often included sharp squeezes before the downtrend reasserted itself.
History does not guarantee future results, and the size of those adverse excursions shows that even winning seasonal windows can involve deep drawdowns along the way.
Why does Marvell Technology (MRVL) follow this seasonal pattern?
One likely driver is the way midterm-year summers concentrate macro and policy uncertainty just as corporate buyers reassess data-center and networking budgets. Analysts have pointed to AI and cloud capex cycles that can pause or rotate in the middle of the year, especially when rates and regulation are in flux.[2] For a high-beta semiconductor name like Marvell, that mix of shifting enterprise demand and election-year noise may translate into the repeated summer air pockets seen in the historical seasonality.
What is driving Marvell Technology (MRVL) today?
Marvell shares closed at $204.70 on Thursday, up 3.0% on the session and roughly 6.2% below their 52-week high, after a year-to-date surge of 133.8% that has turned the stock into one of the standout AI plays in semiconductors.[2] The latest leg higher followed fiscal first-quarter results on May 27 that topped expectations on both revenue and adjusted earnings, and came with guidance that pointed to Q2 revenue of about $2.70 billion and adjusted EPS of $0.93, both ahead of Wall Street estimates.[3] Management highlighted record quarterly revenue, non-GAAP gross margin of 58.9% and “exceptional AI-related bookings,” reinforcing the narrative that custom accelerators and optical connectivity for data centers are driving a step-change in growth.[3]
In the days around the report, coverage from major banks framed Marvell as a key beneficiary of the next wave of AI infrastructure spending, citing momentum in optical connectivity and custom chips tied to programs such as Microsoft’s Maia initiative.[1] A separate analysis in late March described how the company’s growth story had shifted as AI orders scaled, arguing that investors were still underestimating the earnings power of its data-center franchise.[4] The stock’s sharp after-hours and next-day moves around earnings, including a roughly 7% pop following the latest beat, underline how sensitive positioning has become to incremental AI news and guidance tweaks.[3]
The chart below shows how that AI-driven rally has unfolded over the past year, alongside a 60-day seasonal projection for the upcoming window.
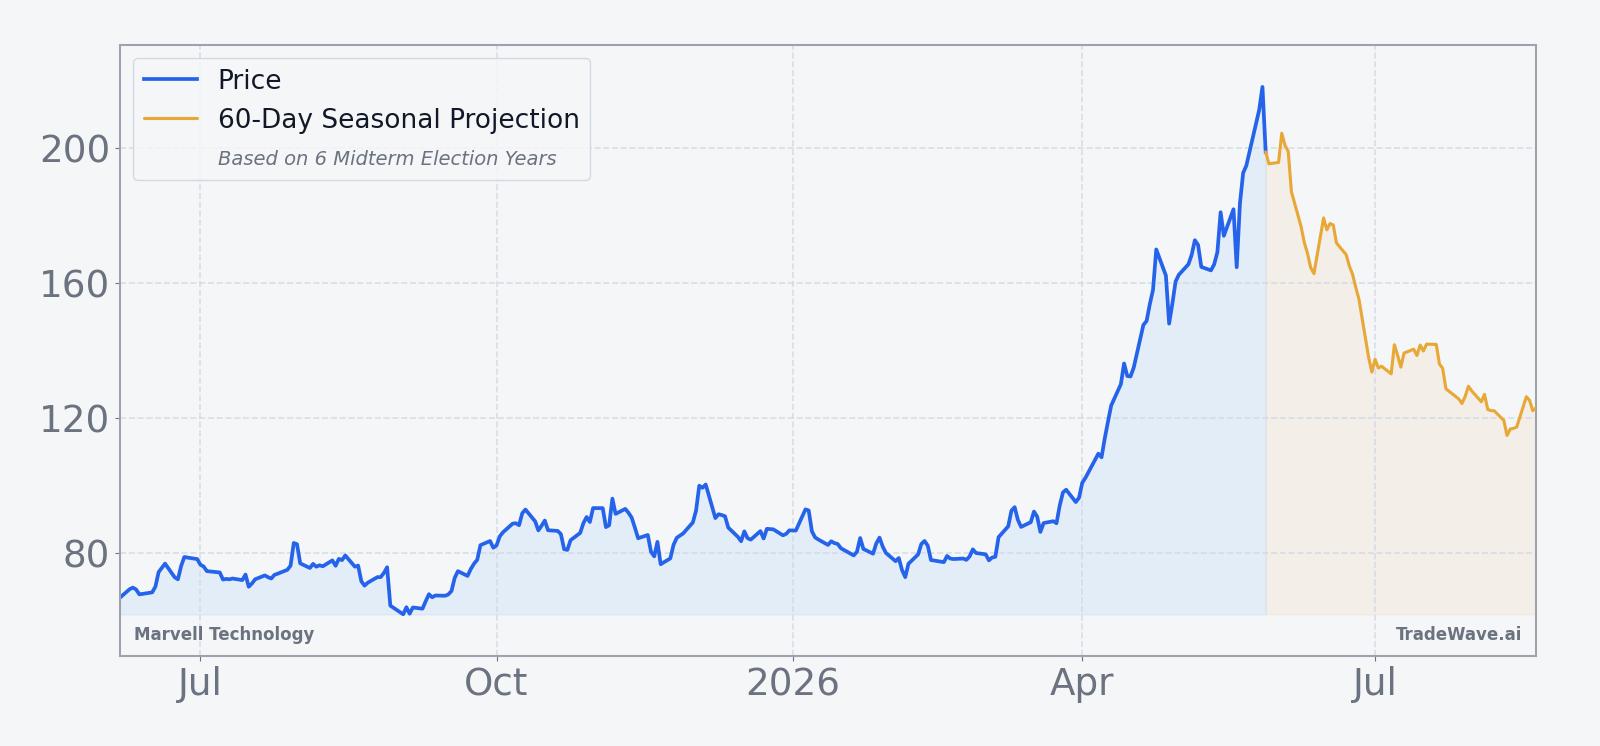
Against that backdrop, the looming seasonal window stands out because it runs counter to the prevailing trend. Marvell is in a powerful AI-led bull run, yet the midterm-year summer pattern has historically been a soft spot for the stock, with every prior instance rewarding short exposure. For traders, the key question is whether this cycle’s AI demand and raised guidance are strong enough to overpower a calendar stretch that has repeatedly produced downside in past midterm years.
What should traders watch as this MRVL seasonal window opens?
First, the calendar: the 72-day window begins on Jun 6 and runs through late summer, overlapping a period when Washington’s policy debates and Fed communication can inject extra volatility into growth stocks. If Marvell starts to stall or roll over during that span, especially after such a steep year-to-date climb, it would rhyme with the historical midterm-year pattern.
Second, price levels matter. The 52-week high near $218 is the obvious upside reference, while the stock’s prior consolidation zones from the spring rally will be watched as potential support if selling emerges. A failure to hold those prior breakout areas during the window would be more consistent with the past short-side wins, whereas a clean breakout to new highs that sticks would mark a clear departure from the historical script.
Third, traders will be tracking how AI-related headlines and earnings revisions evolve through the summer. The latest quarter showed record revenue and strong bookings tied to data-center AI workloads, and analysts framed the guidance raise as a sign that demand is broadening beyond a handful of hyperscale customers.[1][3] If that narrative stays intact and estimate revisions continue to trend higher, it could blunt the typical midterm-year seasonal weakness; if orders or commentary wobble, the historical pattern of summer air pockets could reassert itself.
Finally, watch liquidity and volume around catalysts. The recent after-hours spikes around earnings show that positioning can be crowded and reactions amplified when new information hits.[3] If similar volume surges appear during the seasonal window on down days rather than up days, it would suggest that the midterm-year pattern is once again lining up with how traders are voting with their capital.
Sources
- [1] MarketWatch, "Marvell’s stock has soared ahead of earnings. Why analysts say it’s still ‘underestimated.’" (May 27, 2026)
- [2] CNBC, "This chip stock has more than tripled in the past year; analysts say buy more after latest earnings." (May 28, 2026)
- [3] Yahoo Finance, "MRVL Stock Rises After-Hours On Q1 Earnings Beat And Strong Outlook." (May 27, 2026)
- [4] Seeking Alpha, "Marvell’s Growth Story Just Changed." (Mar 31, 2026)
- [5] Reuters, "Marvell forecasts first quarter revenue above estimates." (Mar 5, 2026)
- [6] Forbes, "Marvell Stock: AI Forecast Sparks Massive Investor Interest." (Mar 9, 2026)
About this seasonal analysis
Seasonal pattern data is sourced from TradeWave.ai, which analyzes historical price behavior across annual calendar windows going back up to 30 years. Read the full data methodology or the book The 100-Year Pattern by Afshin Moshrefi (2026 edition). Past performance of seasonal patterns does not guarantee future results. This article is for informational purposes only and does not constitute investment advice.