Marvell Technology Shares Have Fallen in Six Straight Midterm Windows
Marvell Technology is heading toward a historically weak midterm-year seasonal window even as AI-fueled gains and Nvidia’s investment keep the stock near record territory.

What is the seasonal pattern for Marvell Technology (MRVL)?
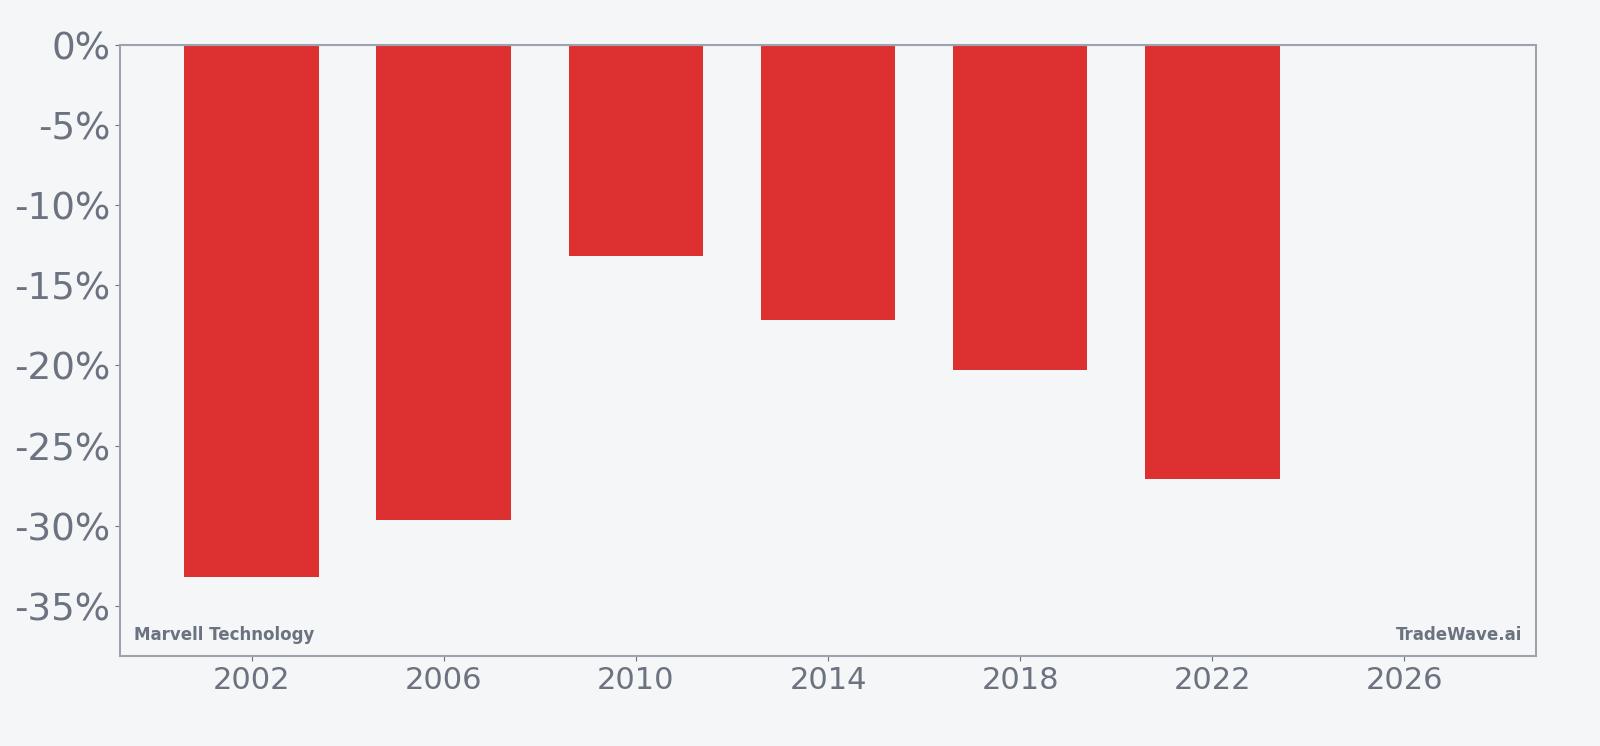
Marvell Technology has fallen in 6 of 6 midterm-election-year windows starting around Apr 29, with an average gain of 23.42% in winning short years.
- 6 for 6 in this window, with short trades averaging 23.42% gains across the last six midterm election years.
- The upcoming 202-day window begins Apr 29 and has historically been a bearish seasonal stretch for MRVL when viewed from the short side.
- Percent Profitable is 100%, with 6 winners and 0 losers for the short pattern in this midterm-year slice.
- Average winner profit of 23.42% comes alongside a TradeWave Ratio of 2.32, indicating sizable travel in the trade direction within the window.
- A Sharpe ratio of 2.73 signals unusually strong risk-adjusted returns for the historical short setup in this MRVL seasonal trend.
- Individual years have seen deep adverse moves before resolving lower, so intraperiod drawdowns have been meaningful even in winning short trades.
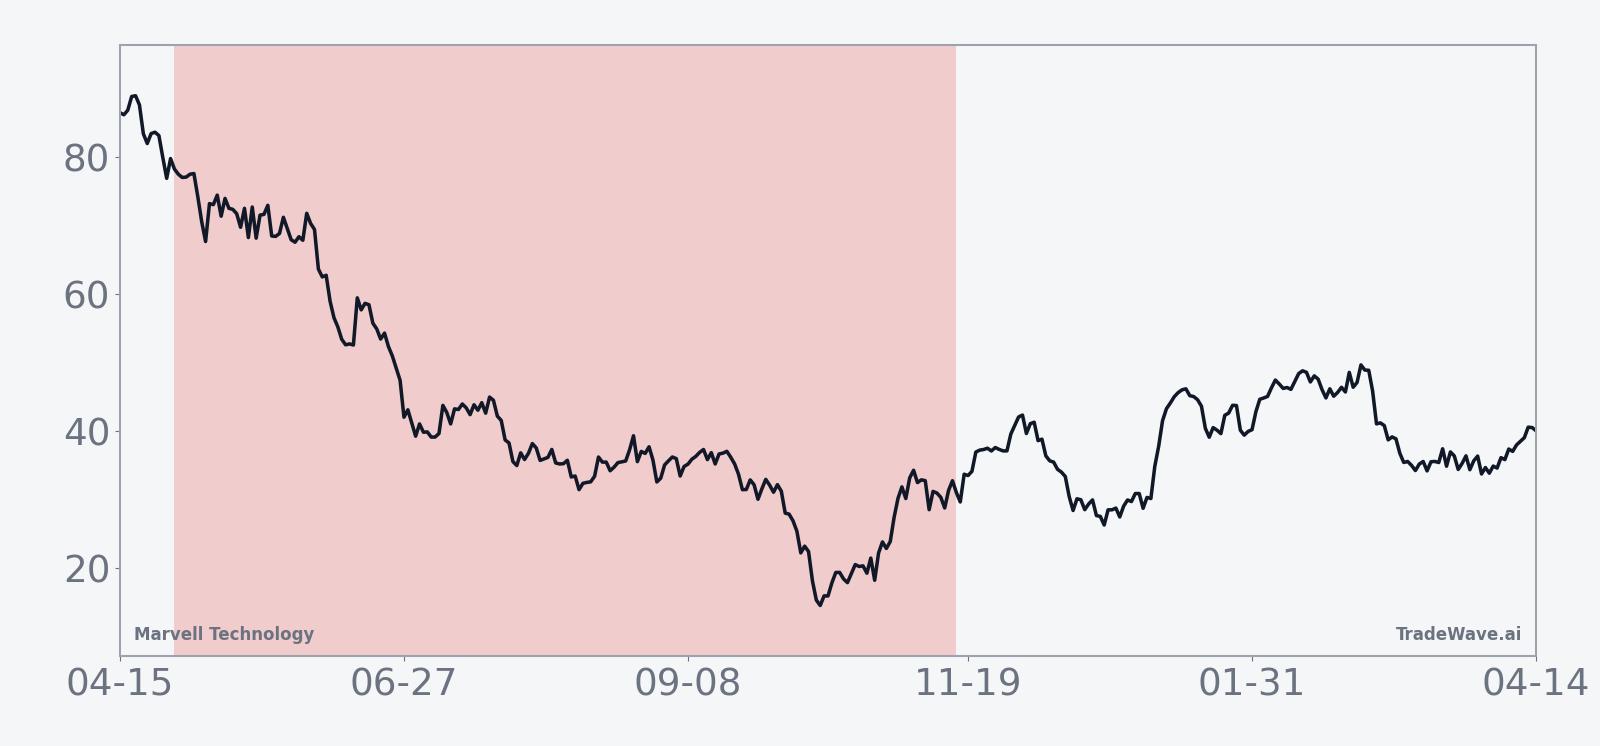
According to historical data from TradeWave.ai, this midterm-election-year window for Marvell behaves very differently from an average stretch on the calendar, and the next iteration is about to open.
How has Marvell Technology (MRVL) traded in this midterm-year window?
Marvell Technology has declined in every one of the last six midterm election years during the 202-day window that starts around Apr 29, with short trades averaging 23.42% gains. Today the stock closed at 128.49, up 7.1% on the session and sitting about 25.2% above its 52-week high of 102.62, underscoring how stretched the current AI rally has become.[2] Significant insider stock purchases and heavy-volume spikes around Nvidia’s investment and Marvell’s earnings beat suggest management and large investors are positioning for a long-term story even as near-term volatility picks up.[1][2][5] That mix of a powerful historical seasonal headwind, a stock trading well above its prior range, and fresh conviction buying sets up a tension that traders will be watching closely as this window opens.
Grouping the data by the presidential election cycle matters here because this pattern only looks at the last six midterm election years, a phase that often brings policy uncertainty, shifting fiscal priorities and more volatile risk appetite for high-growth tech. In that context, the MRVL seasonal trend is striking: every midterm-year window in this slice has rewarded being short, even when the broader semiconductor sector was strong.
A second view shows how far MRVL has typically swung in both favorable and adverse directions inside this window.
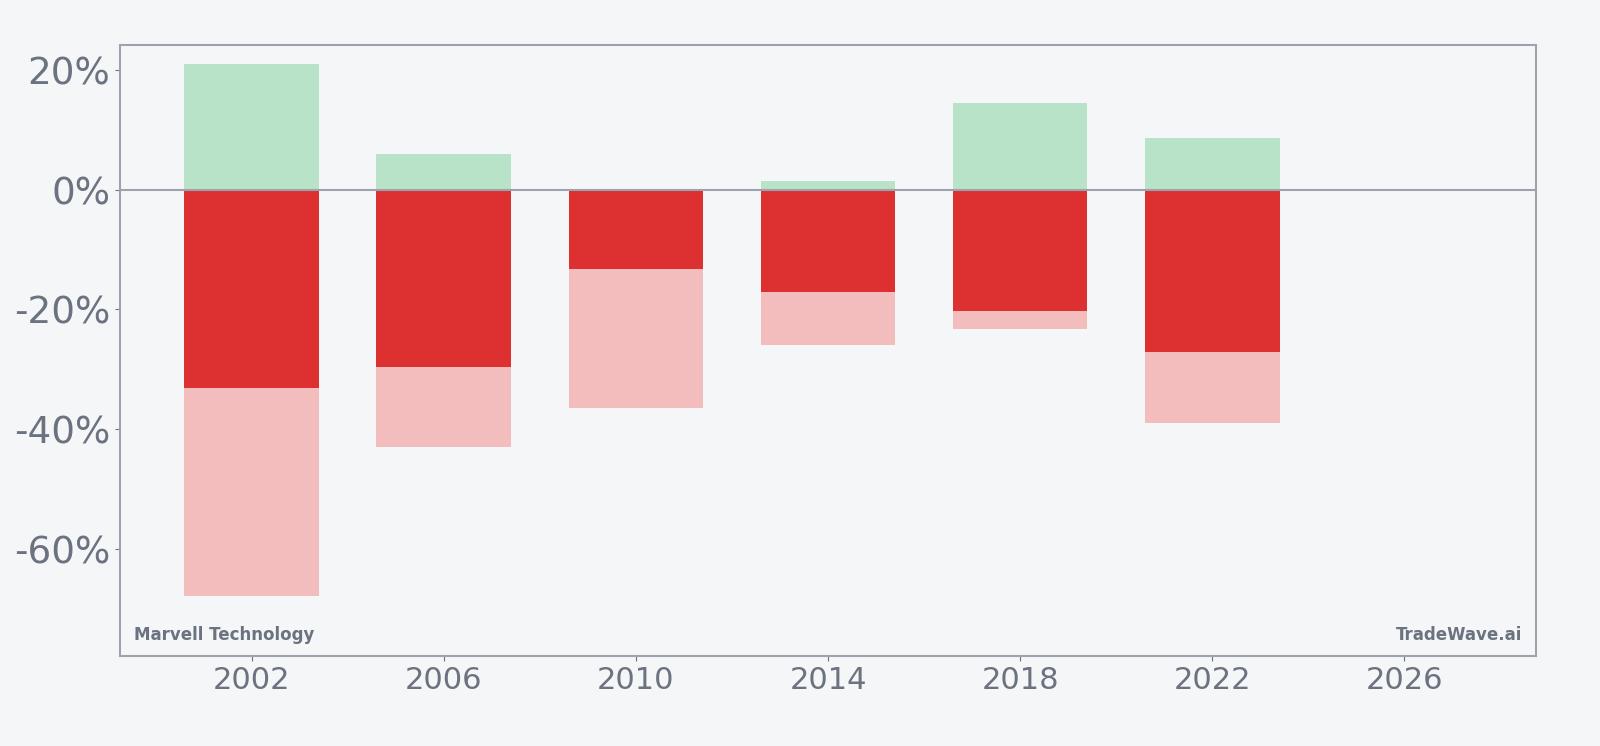
The per-year table shows how consistent that pattern has been. In 2002, a short entered around 7.46 and exited near 4.98, a 33.18% gain for the short side, but the stock still rallied as much as 21.07% at one point and dropped as much as 67.82% from entry before the window closed. In 2022, the short pattern captured a 27.07% move from roughly 57.20 to 41.72, with a best intraperiod rally of 8.66% against the short and a worst drawdown in the trade direction of 39.06%, underscoring how sharp the swings can be.
Across all six midterm-year windows, the average winner profit of 23.42% and a Sharpe ratio of 2.73 point to a historically powerful bearish seasonal bias for MRVL when viewed from the short side. The TradeWave Ratio of 2.32 indicates that price has typically traveled meaningfully in the trade direction inside the window, not just drifted lower. At the same time, the maximum adverse excursions show that even winning short years often included sizable countertrend rallies, which matters for anyone trying to time entries or manage risk around this Marvell Technology trading window.
Put simply, this midterm-year slice has been a clean sweep for shorts so far: six for six, with double-digit percentage moves in every case.
Why does Marvell Technology (MRVL) follow this seasonal pattern?
One likely driver is the way midterm election years cluster key policy debates and regulatory headlines that can hit high-beta semiconductor names hardest. Analysts have also pointed to institutional portfolio repositioning around this phase, as managers rebalance AI and data-center exposure after early-year rallies.[4] The pattern may also reflect how Marvell’s earnings calendar and guidance updates line up with shifting expectations for AI infrastructure spending in the middle of the political cycle, amplifying volatility in this specific stretch.
History does not guarantee future results, and even in winning seasonal windows, maximum adverse excursions have been large enough to challenge poorly timed positions.
What is driving Marvell Technology (MRVL) today?
Marvell shares closed at 128.49 on Apr 13, up 7.1% on the day and roughly 27.8% over the past month, as investors continue to crowd into AI infrastructure winners.[2] The stock is trading well above its 50-day moving average of 83.92 and has seen 20-day average volume of about 25.3 million shares, a backdrop that sets the stage for outsized moves if sentiment shifts. On Mar 5, Marvell reported a strong Q4 earnings beat driven by robust AI demand in its data-center business, with gross margins near 60% and upbeat revenue guidance tied to AI chips and optical solutions.[5] That was followed on Mar 31 by Nvidia’s announcement of a $2 billion investment in Marvell, deepening a strategic partnership that pushed both the stock and related leveraged ETFs sharply higher on heavy volume.[2] In parallel, sector commentary has highlighted Marvell’s pivot toward custom AI silicon and connectivity, with some analysts projecting revenue growth of 33% in fiscal 2027 and 37% in fiscal 2028 as AI infrastructure spending ramps.[4]
Those catalysts have also produced a Special Insight in the form of notable insider buying and repeated volume spikes, which signal that both management and fast-money traders see long-term value in the AI story despite the stock’s rapid climb.[1][2] For a name that now sits far above its prior 52-week high, that combination of strong fundamentals, aggressive flows and stretched technicals makes the upcoming seasonal window more than just a statistical curiosity.
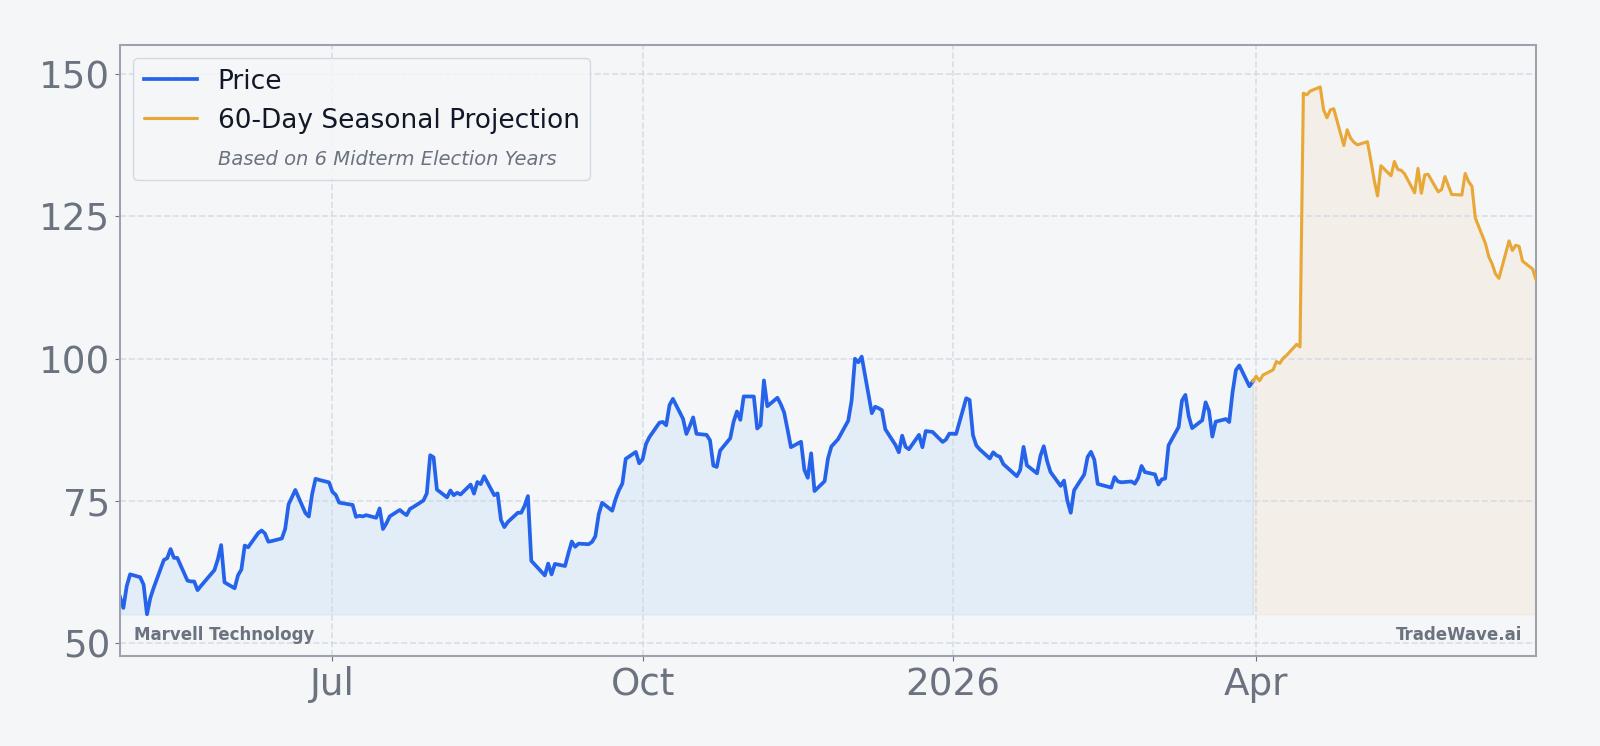
The chart below situates the latest surge in the context of MRVL’s past year of trading and a short-term seasonal projection.
What should traders watch as this MRVL seasonal window approaches?
The first marker is the calendar itself: the midterm-year window opens on Apr 29 and runs for 202 trading days, covering the heart of the policy and earnings cycle for 2026. Inside that span, traders will be watching whether MRVL can hold above the 120 to 130 zone that has defined the latest breakout, or whether any pullback toward the 50-day moving average signals that the historical midterm-year pattern is starting to reassert itself. Earnings and guidance updates tied to AI infrastructure demand, along with any new disclosures around the Nvidia partnership, will be key tests of whether the current growth narrative can overpower the stock’s historical seasonality.[2][4][5]
The second marker is behavior in the Special Insight signals. If insider buying remains active and volume stays elevated on up days, that would suggest long-term capital is still leaning into the AI story despite the seasonal headwind.[1][2] If, instead, volume spikes start to appear on down days or short interest begins to build, it would look more like prior midterm-year windows where rallies eventually gave way to sustained downside. Add it up: the next few weeks will show whether Marvell’s AI momentum can break a six-for-six midterm pattern, or whether this historically weak seasonal stretch once again turns a hot semiconductor name into a source of volatility.
Sources
- Seeking Alpha: "Marvell Stock Could Be A Marvellous Buy" (Oct 5, 2025)
- Seeking Alpha: "ETFs tied to Marvell Technology jumped following Nvidia investment news" (Mar 31, 2026)
- Forbes: "Should You Buy Marvell Technology Stock Today?" (Dec 30, 2025)
- Seeking Alpha: "Marvell’s Growth Story Just Changed" (Mar 31, 2026)
- MarketWatch: "Marvell’s stock rockets as data-center business demand grows" (Mar 5, 2026)
About this seasonal analysis
Seasonal pattern data is sourced from TradeWave.ai, which analyzes historical price behavior across annual calendar windows going back up to 30 years. Read the full data methodology or the book The 100-Year Pattern by Afshin Moshrefi (2026 edition). Past performance of seasonal patterns does not guarantee future results. This article is for informational purposes only and does not constitute investment advice.