Six-for-six midterm slide: Marvell Technology (MRVL) shorts averaged 25.61% profits
Marvell Technology is heading into a historically weak midterm-election seasonal window just as its AI-fueled rally pushes the stock to fresh highs, raising the stakes for traders watching volatility and downside risk.

What is the seasonal pattern for Marvell Technology (MRVL)?
Marvell Technology has fallen in 6 of 6 midterm-election-year windows starting around Apr 23, with an average 25.61% gain for short positions in winning years.
- 6 for 6 in this window for shorts, with an average 25.61% profit in winning years across the last six midterm election cycles.
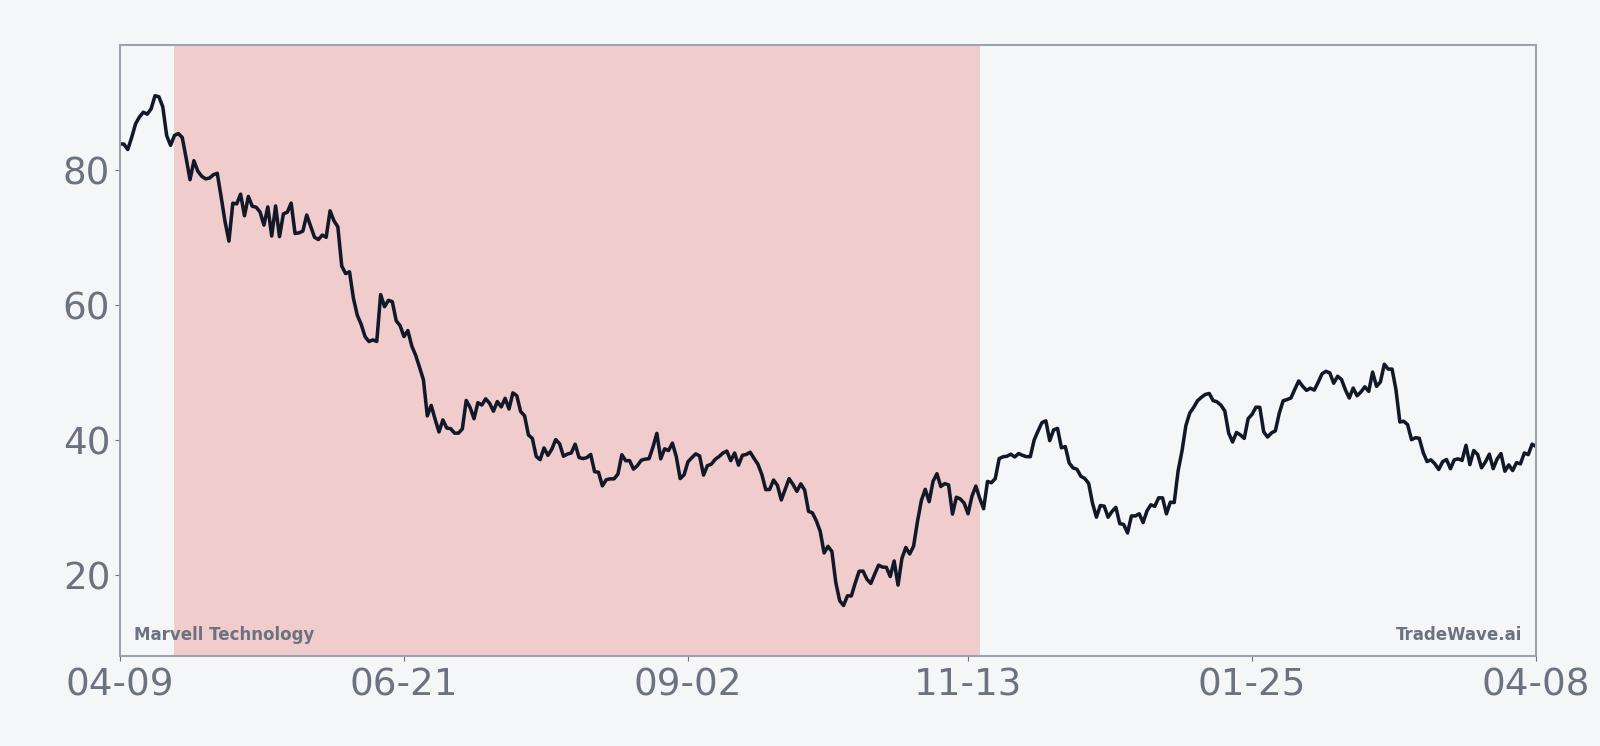
- Seasonal window starts Apr 23 and runs 208 trading days, covering the heart of the midterm election year into the following spring.
- Percent Profitable is 100%, with 6 winners and 0 losers for the short-side pattern in this specific Marvell Technology trading window.
- Average annualized return for the pattern is 25.3%, with a Sharpe ratio of 2.41 and a TradeWave Ratio of 2.27, indicating strong risk-adjusted performance for shorts.
- Individual years have seen net returns for shorts ranging from about 14.6% to 40.0%, with intraperiod drawdowns (worst adverse moves) as deep as 71.1% against the position.
- Add it up: cumulative gains across the six midterm-year windows total 286% for the short strategy, but the path has included sharp rallies against shorts before the trend reasserted.
According to historical data from TradeWave.ai, this upcoming midterm-election stretch has behaved very differently from an average year for Marvell, with a clear short-side bias that most investors never see discussed.
How has Marvell Technology (MRVL) traded in past midterm-year windows?
Marvell Technology has fallen in every one of the last six midterm-election-year windows starting around Apr 23, with shorts averaging gains of 25.61% over 208 trading days. The next iteration of that window begins Apr 23, 2026, just as the stock trades at 151.31, about 1.2% above its 52-week high of 149.58 after a powerful AI-driven run and a 22% slide year to date from even higher levels.[4] In early March, Marvell shares rocketed 18% in a single session on an earnings beat and upbeat AI outlook, a volume and price spike that signaled aggressive positioning into the name.[4]
The pattern is grouped by the presidential election cycle, focusing on the last six midterm election years rather than consecutive calendar years. That matters because midterm years often bring policy uncertainty, shifting fiscal priorities and tighter financial conditions, which can hit high-multiple semiconductor names harder than the broader market.
Year-by-year bars with maximum favorable and adverse moves show how consistently the short pattern has worked and how violent the swings have been inside the window.
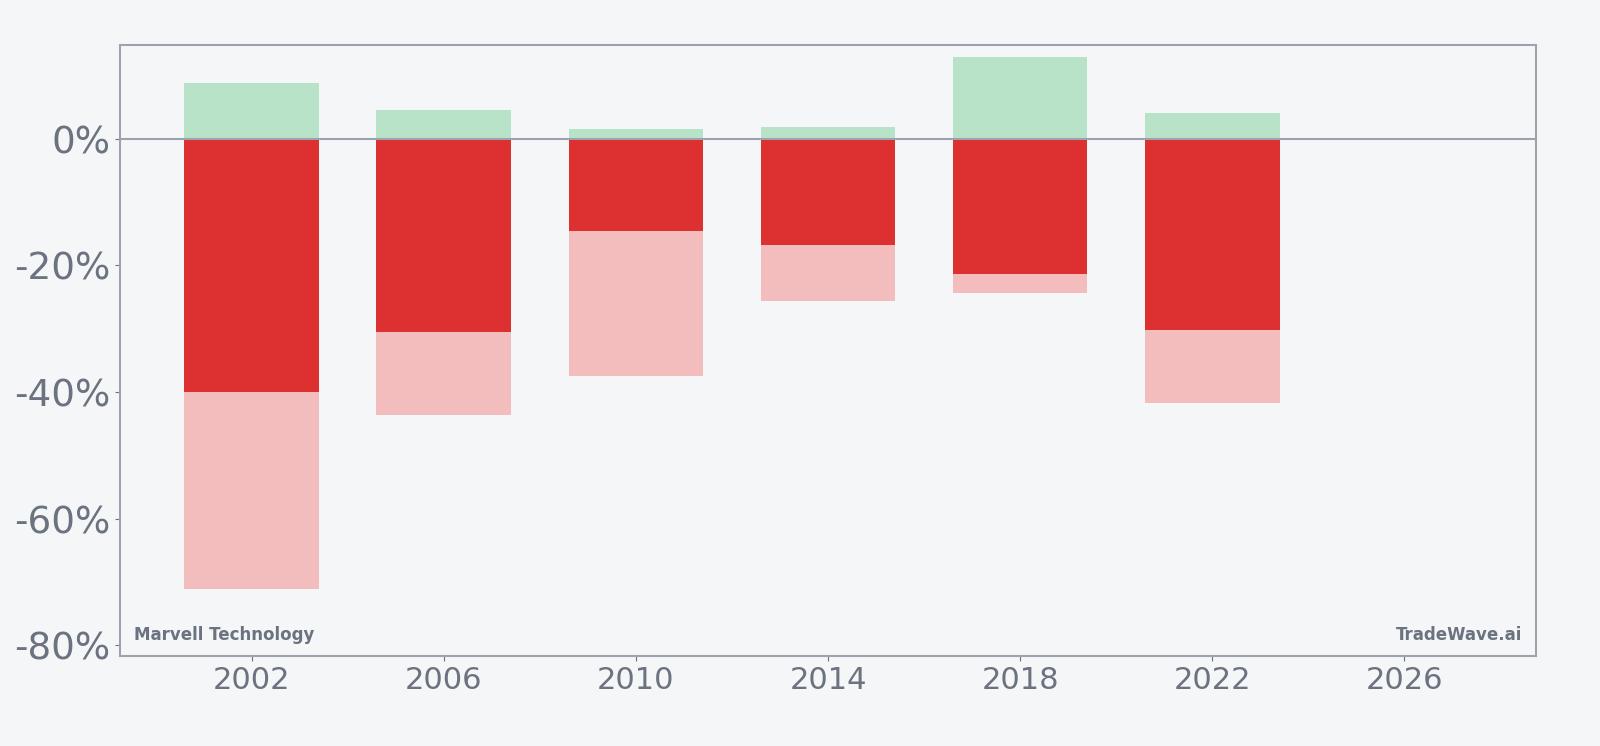
Across the six midterm-year samples, every single window ended with Marvell lower, which is favorable for the short-side pattern. Net returns for shorts ranged from about 14.61% in 2010 to 40.0% in 2002, with cumulative gains of 286% across the sample. The annualized return of 25.3% and Sharpe ratio of 2.41 point to a historically strong risk-adjusted profile for traders who were positioned short during this specific slice of the calendar.
The intraperiod swings have been anything but gentle. Maximum favorable moves for shorts, which capture the best point-to-trough decline within each window, reached as much as 12.87% in 2018. On the other side, maximum adverse moves against shorts hit 71.1% in 2002 and more than 40% in 2006 and 2022, meaning the stock often staged sharp rallies before ultimately rolling over. That combination of large MFE and large MAE signals a high-variance window where both squeezes and breakdowns have been common.
Trend metrics in the pattern show 90 “Trend Long” days and zero “Trend Short” days, which in this framework means the stock has tended to drift lower in a relatively steady fashion once the downtrend is established, rather than chopping sideways. The cumulative return curve for the pattern slopes consistently in favor of shorts, with few flat stretches, suggesting that when this window has worked, it has often rewarded patience over the full 208-day span rather than quick in-and-out trades.
History does not guarantee future results, and the worst adverse excursions inside this window have been large enough that even ultimately profitable shorts would have had to sit through deep rallies against their positions.
Why does Marvell Technology (MRVL) follow this seasonal pattern?
One likely driver is the way midterm election years cluster macro and policy uncertainty right as cloud and data center customers reassess capital spending plans. Analysts have pointed to Marvell’s heavy exposure to AI infrastructure and optical networking, which can leave the stock sensitive to any wobble in hyperscaler budgets or regulation around AI and data privacy.[3][5] This pattern may also reflect institutional portfolio repositioning in the back half of midterm years, when investors rotate within semiconductors and trim high-beta winners ahead of the historically stronger pre-election year.
What is driving Marvell Technology (MRVL) today?
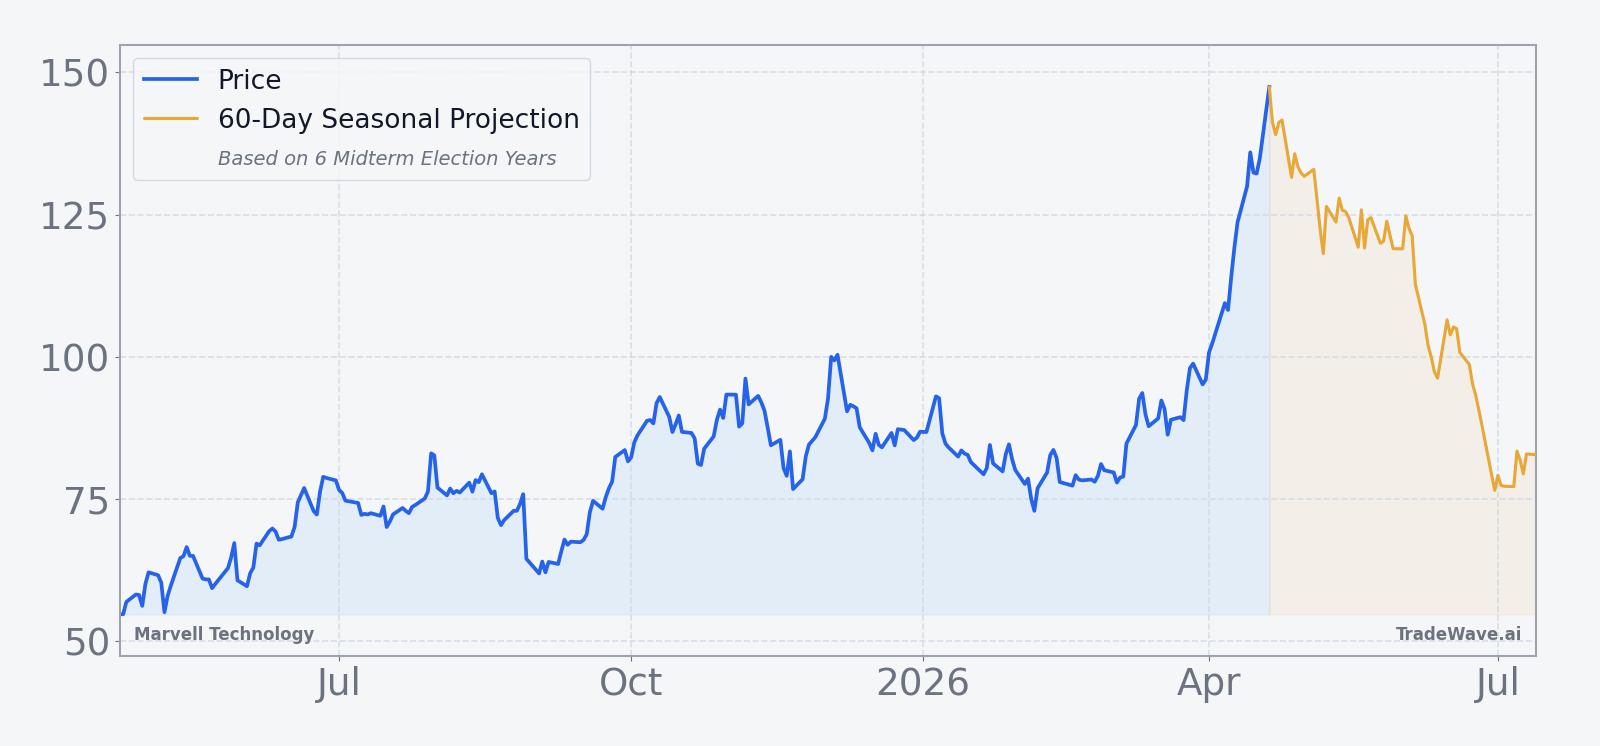
Marvell closed Monday at 151.31, up 2.35% on the day, leaving the stock about 1.2% above its 52-week high of 149.58 and far above its 52-week low near 47.88, even after a 22% decline year to date from earlier peaks.[4] The move caps a volatile stretch that began on Mar 5, when Marvell reported fiscal 2026 revenue of $8.195 billion, up 42% year over year on “robust” AI demand, and the stock jumped 18% in a single session on heavy volume after beating earnings expectations and guiding first-quarter revenue above estimates.[4][7][8] In early March, commentary from management and outside analysts framed Marvell as a key beneficiary of the AI infrastructure boom, with strong demand from cloud data centers and non-GAAP gross margins around 60% tied to its shift toward high-value data center and networking solutions.[2][5] On Mar 31, a detailed analysis of Nvidia’s $2 billion investment in Marvell for AI connectivity and optical networking reinforced the idea that the company’s growth story has pivoted decisively toward AI-centric revenue streams, with projected revenue growth of 33% in fiscal 2027 and 37% in fiscal 2028 despite nearer-term margin pressure.[3] The same research highlighted a $5 billion share buyback program and notable insider stock purchases as signals of management confidence, adding another layer of support beneath the stock after the earnings spike.[1][3]
The chart below shows how that AI-driven surge has reshaped Marvell’s price path over the past year, alongside a 60-day seasonal projection.
What should traders watch as this seasonal window opens?
The immediate catalyst is the calendar itself: the 208-day midterm-year window begins Apr 23 and runs deep into the following spring, overlapping a period when Washington’s policy debates on AI regulation, data privacy and fiscal priorities could inject more volatility into high-beta chip names. Traders will be watching whether Marvell can hold above the 150 area that roughly aligns with its recent breakout and 52-week high, or whether any pullback toward the low-100s region would echo the deeper drawdowns seen in prior midterm windows.[4] Earnings updates and guidance revisions tied to cloud AI spending will be critical tells; any sign that hyperscaler demand is normalizing rather than accelerating could test the rich expectations embedded in Marvell’s AI narrative.[3][5][8]
Options and volume behavior around these catalysts will also matter. The 18% post-earnings surge in early March came with a clear volume spike, suggesting that positioning in the name can change quickly when new information hits the tape.[4] If that kind of heavy upside flow fades while the stock stalls near highs, it would rhyme with prior midterm-year windows where early strength gave way to sustained downside. On the other hand, persistent high-volume buying and continued insider accumulation would argue that this cycle could diverge from the historical pattern, even if the seasonal backdrop has favored shorts in the past.[1][3][4]
Finally, the broader semiconductor and AI infrastructure backdrop will shape how this window plays out. The sector’s current tailwind from cloud data centers and AI accelerators has been strong, but midterm years often bring choppier macro conditions and shifting risk appetite.[2][5] If Marvell continues to secure large AI connectivity wins and maintain roughly 60% non-GAAP gross margins, the stock could remain a focal point for both momentum buyers and seasonal traders looking to fade strength. The key tell will be how Marvell behaves on negative headlines or softer guidance inside the window: quick recoveries would challenge the six-for-six short pattern, while sustained selling on bad news would fit it almost perfectly.
Sources
- [1] Seeking Alpha – “Marvell Stock Could Be A Marvellous Buy (NASDAQ:MRVL)” (Oct 5, 2025)
- [2] Forbes – “Should You Buy Marvell Technology Stock Today?” (Dec 30, 2025)
- [3] Seeking Alpha – “Marvell’s Growth Story Just Changed (NASDAQ:MRVL)” (Mar 31, 2026)
- [4] MarketWatch – “Marvell’s stock rockets 18% as data-center business demand grows” (Mar 5, 2026)
- [5] Forbes – “Marvell Stock: AI Forecast Sparks Massive Investor Interest” (Mar 9, 2026)
- [6] Seeking Alpha – “Marvell: Significant AI Win Coming Soon” (Oct 6, 2025)
- [7] Barron’s – “Marvell Earnings Beat Thanks to ‘Robust’ AI Demand” (Mar 5, 2026)
- [8] Reuters – “Marvell forecasts first quarter revenue above estimates” (Mar 5, 2026)
- [9] Reuters – “Marvell sinks as weak data center outlook stokes custom AI chip worries” (Aug 29, 2025)
- [10] Reuters – “Marvell shares jump as chipmaker bolsters AI ambitions with Celestial deal” (Dec 3, 2025)
About this seasonal analysis
Seasonal pattern data is sourced from TradeWave.ai, which analyzes historical price behavior across annual calendar windows going back up to 30 years. Read the full data methodology or the book The 100-Year Pattern by Afshin Moshrefi (2026 edition). Past performance of seasonal patterns does not guarantee future results. This article is for informational purposes only and does not constitute investment advice.