NextEra Energy (NEE) Has Risen in Every Midterm Summer, Averaging 6.34% Gains
NextEra Energy is heading into an 82-day midterm-year seasonal window with a perfect win record just as traders digest its $67 billion Dominion deal and the stock trades near recent highs.
What is the seasonal pattern for NextEra Energy (NEE)?
NextEra Energy has risen in 8 of 8 midterm-year summer windows during this 82-day stretch, with an average gain of 6.34% in winning years.
- 8 for 8 in this window, averaging 6.34% gains in winning years across the last eight midterm election cycles.
- Seasonal window starts Jun 7 and runs for 82 trading days, covering much of the midterm-year summer.
- Percent Profitable is 100%, with 8 winners and 0 losers in the historical sample.
- Trade Direction is long, with a TradeWave Ratio of 2.23 and a Sharpe ratio of 1.37 for end-of-window outcomes.
- Individual years have seen strong upside bursts, but adverse moves inside the window have at times exceeded 20% before recovering.
- Cumulative return across all eight windows totals 62%, pointing to a persistent bullish seasonal trend for NEE in this phase of the election cycle.
According to historical data from TradeWave.ai, this midterm-year summer stretch has behaved very differently from an average month on the calendar for NextEra Energy. The next section walks through how that pattern has played out in prior cycles and what it means for the upcoming 82-day window.
How has NextEra Energy (NEE) traded in past midterm-year summer windows?
NextEra Energy has posted gains in every one of the last eight midterm election years during this 82-day summer window, averaging a 6.34% rise with no losing cycles. The upcoming iteration begins on Jun 7, with NEE last changing hands around 90.06, leaving it about 9.6% below its 52-week high of 98.75.[5]
Because this pattern is grouped by the presidential election cycle, it only looks at midterm election years, which often feature regulatory noise and rate uncertainty for utilities. For a name like NextEra Energy that sits at the intersection of regulated power and growth themes, that election-cycle filter can matter more than a simple calendar-month view.
Across the eight midterm-year samples, the long trade direction has lined up cleanly with the historical outcomes. Percent Profitable is 100%, with 8 winners and 0 losers, and cumulative return across those windows totals 62%. Average gains of 6.34% per window sit slightly above the 6.85% median, which suggests the distribution has been relatively balanced rather than driven by a single outlier year.
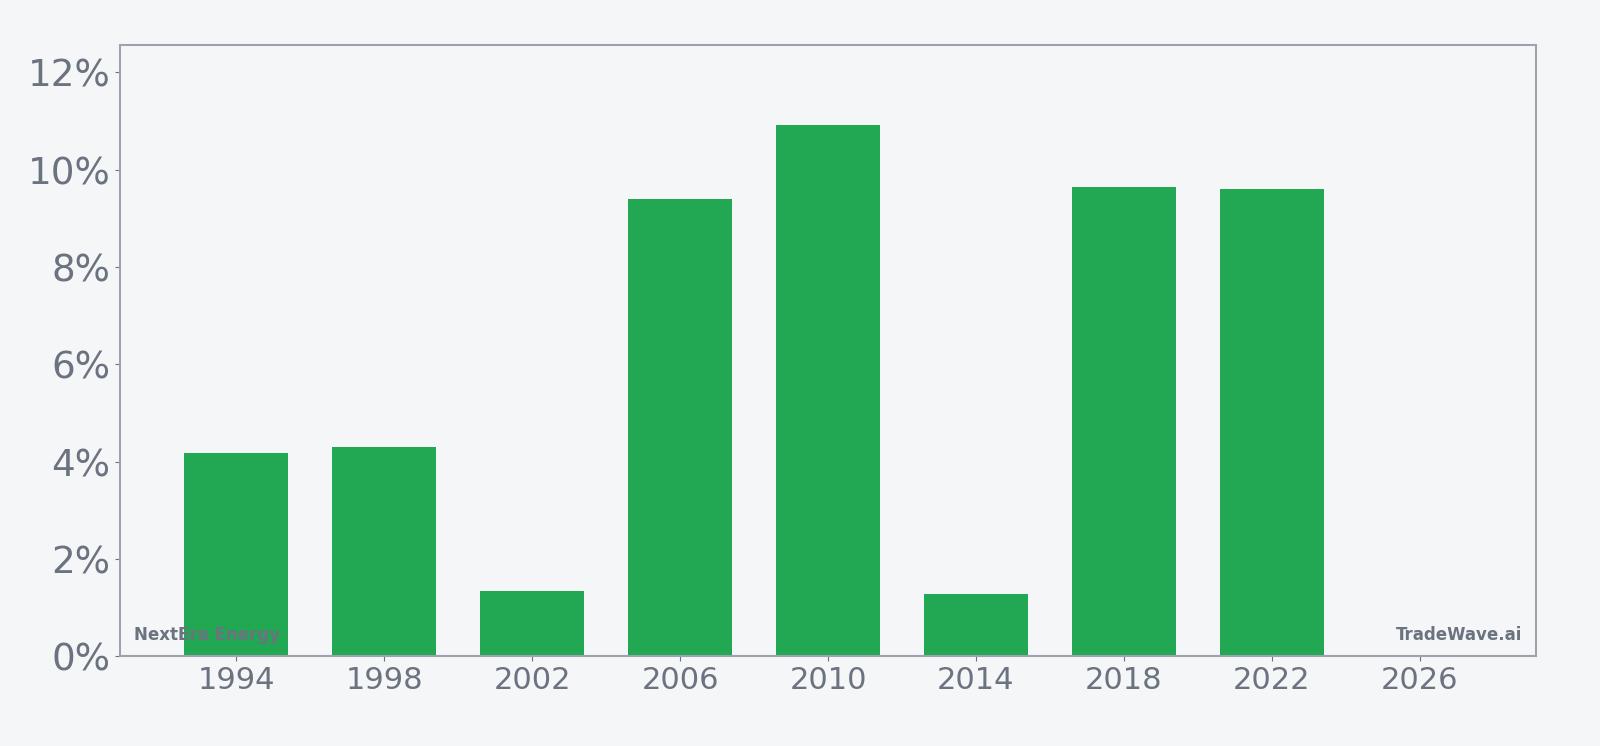
The per-year table shows how that has played out in practice. The weakest net outcome was 1.29% in 2014, while the strongest years, such as 2010, 2018 and 2022, delivered net returns between roughly 9.4% and 10.93% over the 82 trading days. Add it up and NEE has been consistently positive in this midterm-year summer stretch, even when broader markets were choppy.
The historical seasonal trend chart shows a fairly steady climb rather than a single explosive burst. Returns tend to build over the life of the window, with some early noise but a clearer upward slope into the back half, which fits a pattern of investors adding utility exposure as midterm-year uncertainty peaks and then fades.
The next view combines net results with the best and worst intraperiod swings to show how far NEE has typically moved inside the window.
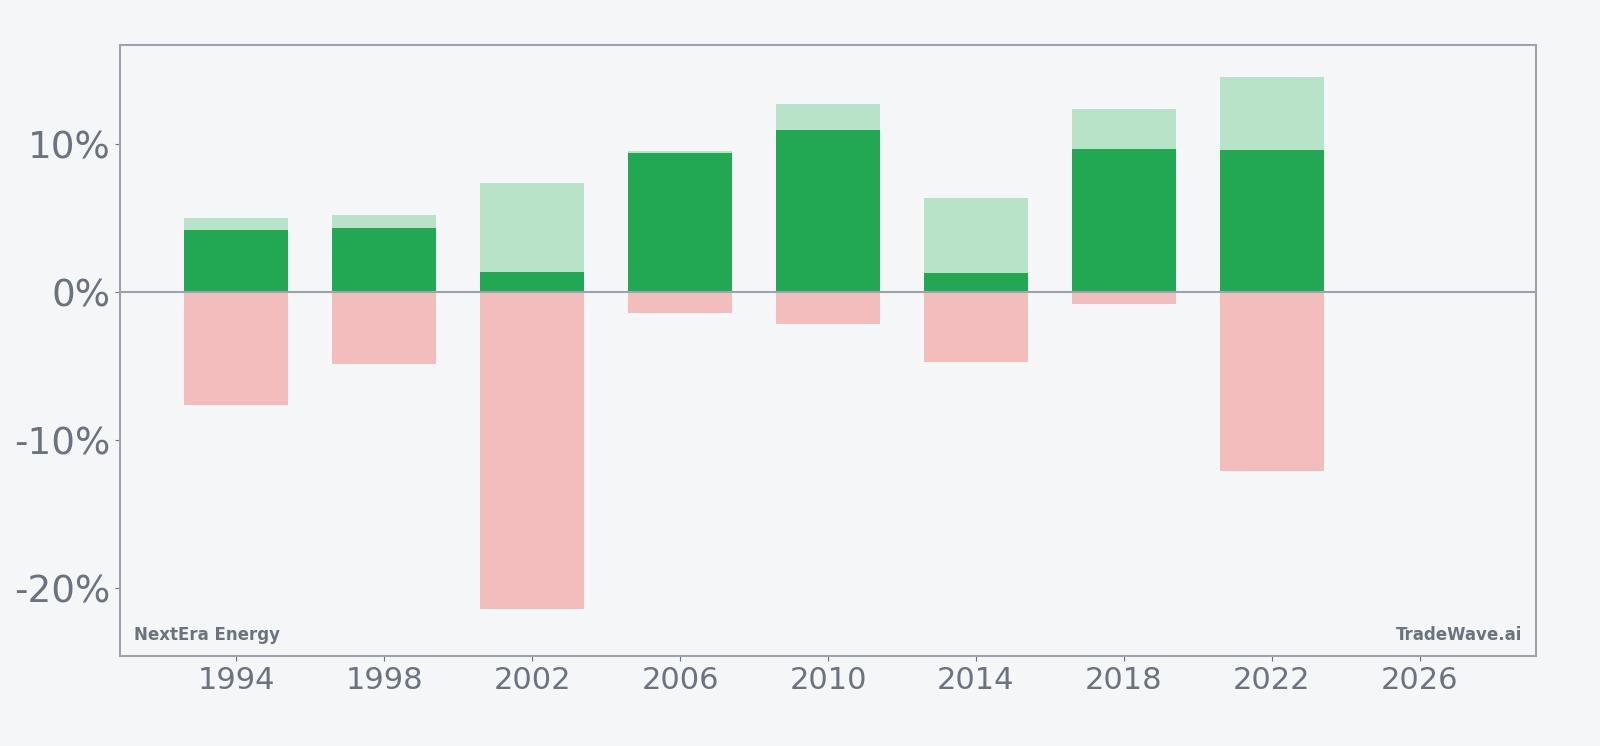
The combined net/MFE/MAE bars highlight why this NEE seasonal trend has mattered for traders. In strong years like 2018 and 2022, maximum favorable moves inside the window reached 12.32% and 14.5%, while the worst drawdowns stayed under roughly 12.11%. In more muted years such as 2002, the final gain was only 1.34%, but the worst intraperiod drop reached about 21.4% before the stock recovered, underscoring that even “all green” windows can involve sharp downside swings along the way.
History does not guarantee future results; adverse excursions can be large even in winning windows, and traders should treat this seasonal pattern as context rather than a forecast.
Why does NextEra Energy (NEE) follow this seasonal pattern?
This midterm-year summer pattern for NEE may reflect a mix of sector rotation and policy timing. One likely driver is that utilities often see renewed interest as investors reposition around midterm election headlines and rate expectations, especially when growth sectors feel crowded. For NextEra specifically, analysts have pointed to recurring windows where regulatory clarity, capital spending updates and index rebalancing tend to cluster in the middle of the election cycle, creating a tailwind for the stock pattern analysis in this part of the year.
What is driving NextEra Energy (NEE) today?
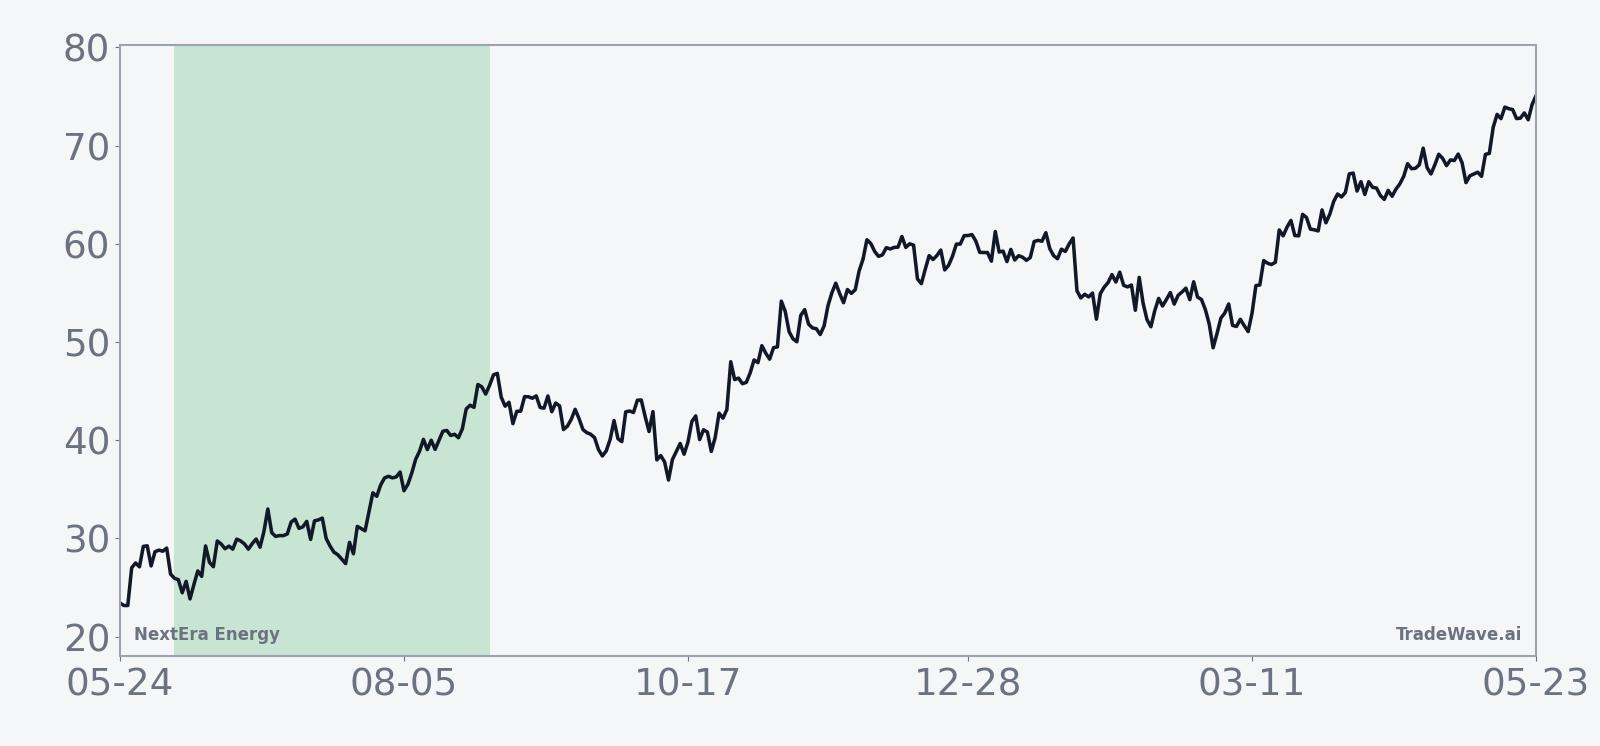
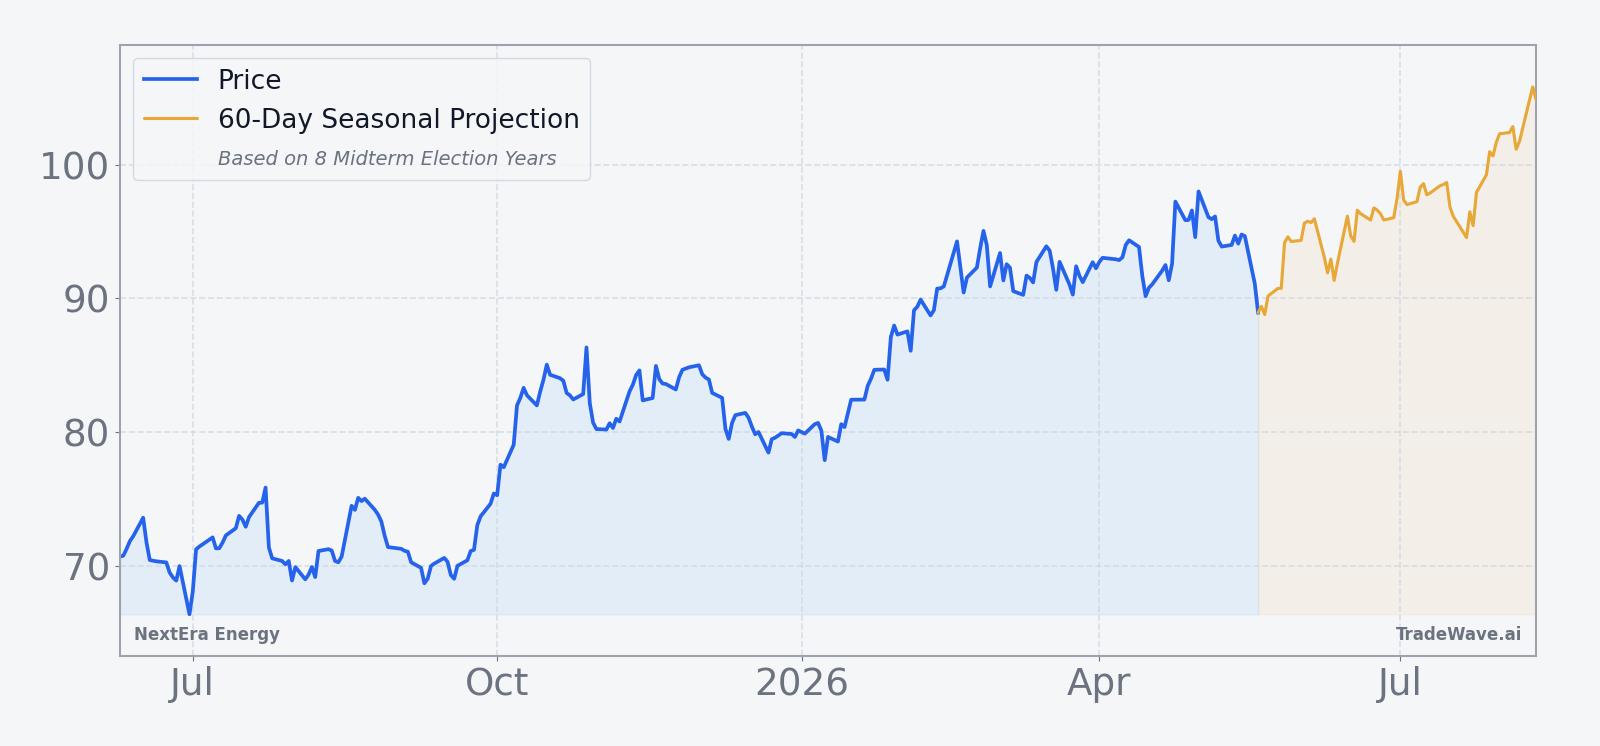
NextEra Energy shares last traded around 90.06, up modestly on the day and sitting roughly 9.6% below their 52-week high of 98.75, after a one-month pullback of about 0.6% from recent levels.[5] The stock is trading against a major strategic backdrop after NextEra agreed on May 18 to acquire Dominion Energy in a mostly stock deal valued at about $66.8 billion to $67 billion, a move that would significantly expand its regulated footprint and customer base across Virginia, North Carolina and South Carolina while promising $2.25 billion in bill credits to those customers.[5]
That deal lands as utilities have shifted from “bond proxies” to growth proxies, with investors chasing the AI-driven power demand story and data center buildout that is reshaping the sector’s earnings outlook.[6][9] NextEra has already been leaning into gas and data center developments tied to that theme, and the Dominion acquisition would deepen its role as a core supplier of electricity to AI infrastructure, which helps explain why NEE has traded with more of a growth-stock profile than a traditional utility.
The chart below situates the latest move in its recent multi-month context, including a 60-day seasonal projection overlay.
What should traders watch as this NEE seasonal window approaches?
First, the calendar: the 82-day midterm-year summer window starts on Jun 7, so any sharp move into that date will shape how much room the historical seasonality has to work with. A grind higher into the start of the window would leave NEE closer to its 98.75 high, while a pullback would reset the base for any typical seasonal climb.[5]
Second, policy and deal milestones around the Dominion acquisition will matter for how closely this cycle tracks the historical pattern. Traders should watch for regulatory commentary, integration timelines and any updated capital plans that could affect earnings visibility or balance-sheet leverage, since those factors often drive utility sector rotation in midterm years.[5][6]
Third, the AI power-demand narrative is likely to remain a key swing factor. If data center build plans and grid investment announcements continue to accelerate, that could reinforce the historical bullish NEE seasonal trend; if those expectations cool, the stock could diverge from its usual midterm-year summer behavior even if the long-term pattern remains intact.[6][9]
Finally, behavior inside the window will be just as important as the end result. Historically, NEE has seen sizable intraperiod drawdowns even in winning years, so traders will be watching whether any early weakness stays within the typical adverse range or breaks below it. A path that features normal-sized dips followed by renewed buying would be consistent with the past eight cycles, while a sustained breakdown or unusually muted upside would signal that this midterm-year window is writing a different script.
Sources
About this seasonal analysis
Seasonal pattern data is sourced from TradeWave.ai, which analyzes historical price behavior across annual calendar windows going back up to 30 years. Read the full data methodology or the book The 100-Year Pattern by Afshin Moshrefi (2026 edition). Past performance of seasonal patterns does not guarantee future results. This article is for informational purposes only and does not constitute investment advice.