9-of-10 Midterm Summer Slides: L3Harris (LHX) Nears a Weak 33-Day Window for Shorts
L3Harris is heading into a historically weak 33-day midterm-year trading window starting Jun 1, just as the stock trades well below its 52-week high and investors weigh defense spending momentum against past seasonal downside.

What is the seasonal pattern for L3Harris (LHX)?
L3Harris has fallen in 9 of 10 midterm-year summer windows starting around Jun 1, with an average 4.91% gain in winning years for the short-side pattern.
- 9 for 10 in this window, with the short-side pattern averaging 4.91% gains in winning years and a 4% average move across all years.
- The upcoming 33-day window begins Jun 1 and has historically been a bearish seasonal stretch for L3Harris in midterm election years.
- Percent Profitable sits at 90%, with 9 winners and 1 loser for the short-direction setup across the last 10 midterm cycles.
- Avg Profit reflects winners only at 4.91%, while Avg Profit - All, which includes the lone losing year, comes in at 4%.
- Intraperiod swings have been meaningful, with past years showing sizable peak run-ups in the trade direction alongside notable drawdowns against it.
- Add it up: a 50% cumulative return for the short-side pattern across these ten midterm-year windows makes this one of L3Harris’s more consistent seasonal trends.
According to historical data from TradeWave.ai, this early-summer stretch in midterm election years has behaved very differently from an average month for L3Harris, and the next iteration is about to open again.
How has L3Harris (LHX) traded in this midterm-year summer window?
L3Harris has fallen in 9 of the last 10 midterm election years during this 33-day window starting Jun 1, with the short-side pattern posting a 50% cumulative return. Shares last closed at 309.62, leaving the stock about 18.3% below its 52-week high of 379.23 and well above its 52-week low near 220.43. That combination of a clear historical downside bias and a stock trading in the middle of its one-year range gives this upcoming window more weight than a typical calendar quirk.
Because this pattern is grouped by the presidential election cycle, it reflects how L3Harris has behaved specifically in the last 10 midterm election years rather than in ten consecutive calendar years. Midterm years often bring budget wrangling, defense appropriations debates and shifting expectations for future spending, which can create a very different trading backdrop from the presidential election year or the year before it.
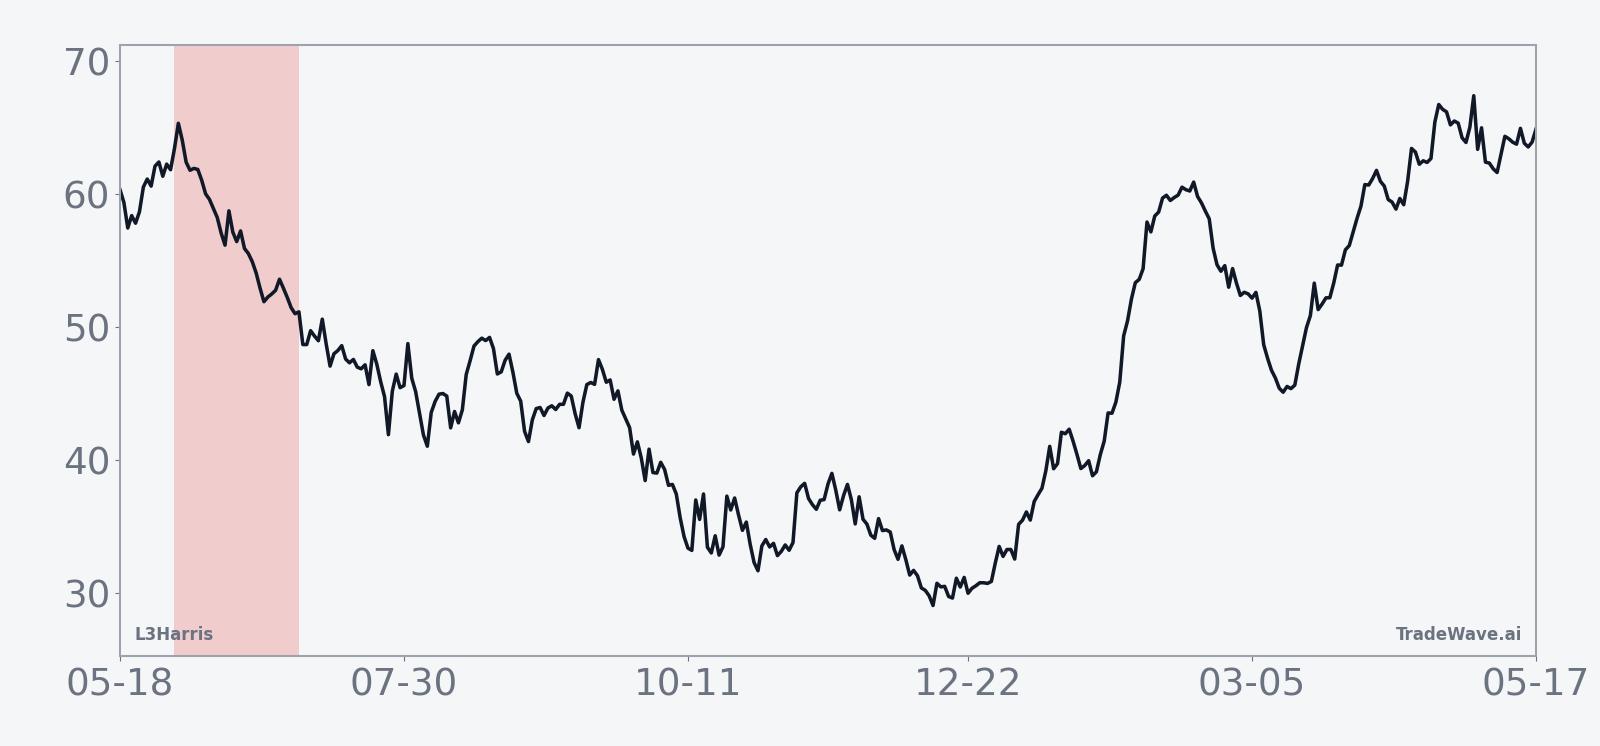
The historical seasonal average shows that, in many midterm years, the bulk of the favorable move for shorts has tended to build gradually across the window rather than in a single air pocket. Trend statistics list 44 days of short-favorable behavior versus 12 for longs across the broader pattern set, which lines up with the 90% win rate for the short direction.
Year-by-year bars with maximum favorable and adverse moves show how much L3Harris has typically swung inside this window.
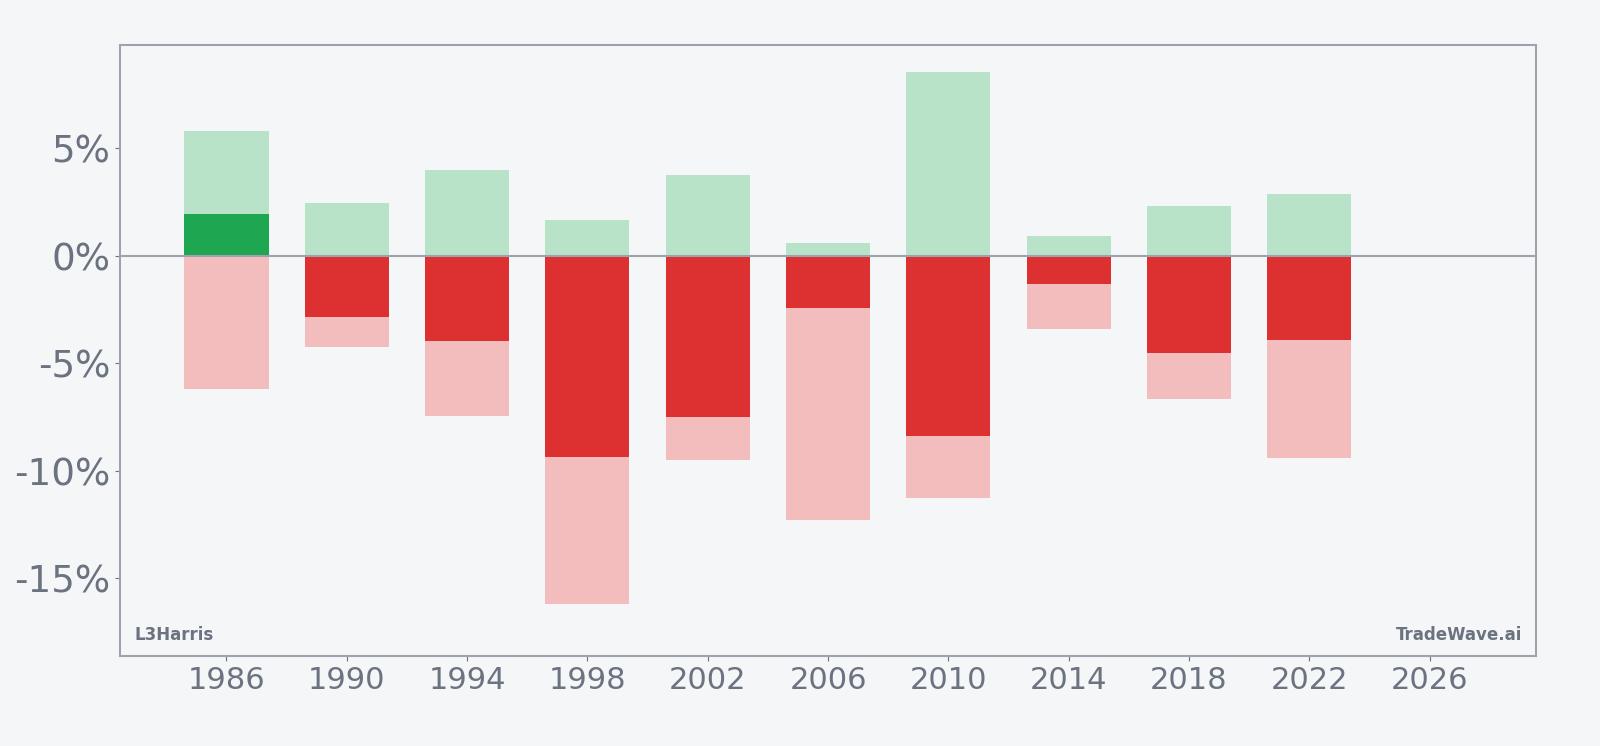
The per-year table shows how that plays out in practice. In 1998, for example, the short pattern posted a 9.34% gain with a best intraperiod move of 1.69% in the trade direction and a worst drawdown of 16.21% against it, underscoring how sharp squeezes can appear even in winning years. The lone losing year, 1986, saw a 1.94% net loss for shorts after a 5.82% favorable move and a 6.2% adverse excursion, a reminder that timing inside the window has mattered as much as direction.
Across all ten midterm-year samples, the pattern’s Sharpe ratio of 1.13 points to a relatively strong risk-adjusted profile for the short side, while the TradeWave Ratio of 2.13 signals that price has typically traveled meaningfully in the trade direction at some point during the window. The 4.91% Avg Profit for winners versus a 4% Avg Profit - All shows that the single losing year has not erased the edge built up by the nine successful shorts.
History does not guarantee future results; adverse excursions (MAE) can be large even in winning windows.
Why does L3Harris (LHX) follow this seasonal pattern?
This midterm-year pattern may reflect how defense contractors sit at the intersection of budget politics and procurement timing. One likely driver is that midyear in a midterm election cycle often coincides with appropriations debates and headline risk around Pentagon spending, which can pressure valuations even when long-term demand is solid. Analysts have also pointed to institutional portfolio repositioning around fiscal year milestones and shifting expectations for future contract awards as reasons defense names like L3Harris can trade softer in this specific slice of the calendar.
What is driving L3Harris (LHX) today?
L3Harris last changed hands around 311.16, up about 2.1% on the day, after closing at 309.62 in the prior session, yet the stock remains roughly 18.3% below its 52-week high of 379.23 and well above its 52-week low near 220.43. The shares have dropped 10.73% over the past month, trading below their 50-day moving average of 339.04 on lighter-than-normal volume relative to the 20-day average of about 1.62 million shares, a sign that the recent pullback has been more of a grind than a capitulation.
In January 2026, L3Harris reported that fourth-quarter revenue of $5.65 billion missed estimates of $5.78 billion after a 43-day U.S. government shutdown delayed contract awards, and the stock fell in premarket trading as investors digested the hit to near-term growth.[1] Earlier, in July 2025, the company had raised its 2025 outlook on steady demand, with second-quarter revenue of $5.43 billion topping expectations and full-year revenue guidance lifted to $21.75 billion alongside adjusted EPS of $10.40 to $10.60.[2]
In January 2026, L3Harris also moved to streamline its portfolio, selling about 60% of its space propulsion and power systems business to AE Industrial Partners for $845 million including debt and reorganizing into three segments more tightly focused on defense.[3] Around the same time, the Pentagon agreed to invest $1 billion in L3Harris’s rocket motor business via convertible preferred securities ahead of a planned IPO of the missile-solutions unit in the second half of 2026, underscoring Washington’s push to shore up domestic munitions capacity.[4]
Those moves sit against a broader backdrop of strong global demand for arms and missile systems amid geopolitical tensions, with investors watching how quickly delayed contracts from the shutdown period convert into backlog and revenue.[1][2] The seasonal pattern does not speak to fundamentals, but it does suggest that, in past midterm years, this early-summer stretch has often been when short-term worries have outweighed the longer-term defense spending story in the tape.
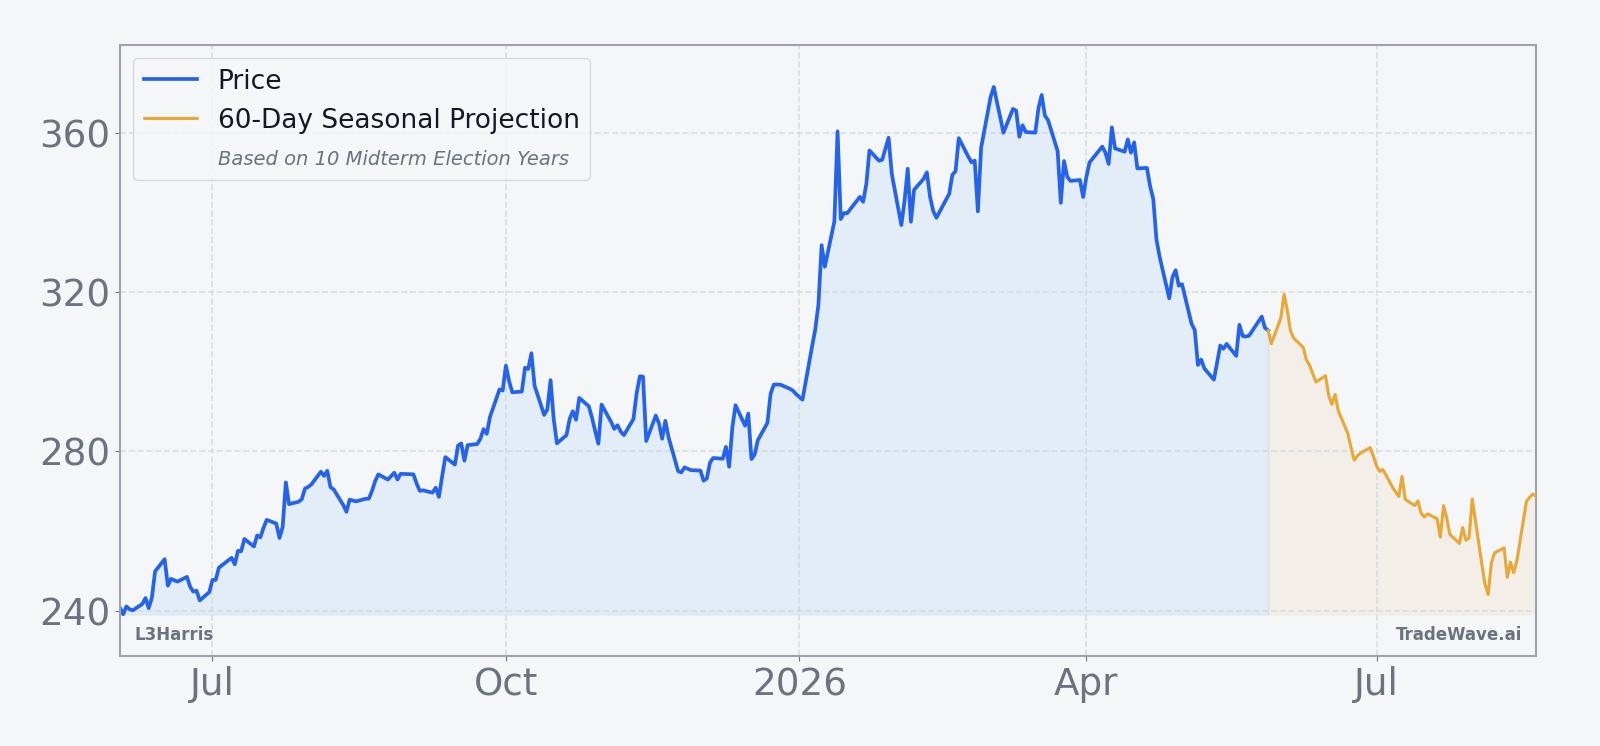
The chart below situates the latest move in its recent multi-month context and overlays the upcoming seasonal projection.
What should traders watch as this L3Harris seasonal window opens?
First, the calendar: the 33-day window begins on Jun 1, so price action in the final days of May will shape where L3Harris enters the pattern relative to its 50-day moving average and the recent 220 to 380 one-year band. A drift back toward the mid-300s before the window opens would leave more room for the kind of downside that has historically favored shorts, while a slide closer to the low 200s would change the risk-reward profile.
Second, watch the policy and budget tape. Any fresh headlines around defense appropriations, supplemental funding packages or the timing of the planned missile-solutions IPO could either reinforce or blunt the historical midterm-year softness. Traders will be looking to see whether intraperiod swings resemble past years, where maximum favorable moves for shorts often built over several weeks but were punctuated by sharp squeezes against the trade.
Finally, behavior inside the window will be the real test of this LHX seasonal trend. If the stock grinds lower on average volume and rallies are sold, that would line up with the 9-for-10 record for the short-side pattern. A decisive break above the 50-day moving average on strong volume during the window, by contrast, would look more like the lone losing year in the sample and would signal that current fundamentals and flows are overpowering the historical pattern.
Sources
- [1] Reuters: L3Harris quarterly revenue misses estimates on government shutdown pressures (Jan 29, 2026)
- [2] Reuters: Defense contractor L3Harris raises 2025 outlook on steady demand (Jul 24, 2025)
- [3] Reuters: L3Harris sells 60% stake in space propulsion business for $845 million (Jan 5, 2026)
- [4] Reuters: Pentagon to invest $1 billion in L3Harris rocket motor business (Jan 13, 2026)
About this seasonal analysis
Seasonal pattern data is sourced from TradeWave.ai, which analyzes historical price behavior across annual calendar windows going back up to 30 years. Read the full data methodology or the book The 100-Year Pattern by Afshin Moshrefi (2026 edition). Past performance of seasonal patterns does not guarantee future results. This article is for informational purposes only and does not constitute investment advice.