Cisco (CSCO) Slides 7% After Guidance as Weak Midterm May Window Opens for Shorts
Cisco is hovering near its 52-week high just as a midterm-year seasonal window that has often favored short setups gets underway, sharpening the risk-reward for traders riding the AI infrastructure boom.

What is the seasonal pattern for Cisco (CSCO)?
Cisco has fallen in 5 of the last 7 midterm-year May windows starting May 16, with an average gain of 5.1% in winning years.
Key takeaways
- 5 winners and 2 losers in this 14-day midterm-year window, with a 71% Percent Profitable record for the short setup.
- The window runs from May 16 for 14 trading days, and the historical pattern has leaned bearish for Cisco in midterm election years.
- Avg Profit in winning years is 5.1%, while Avg Profit - All, including losing years, comes in at 4% for the short strategy.
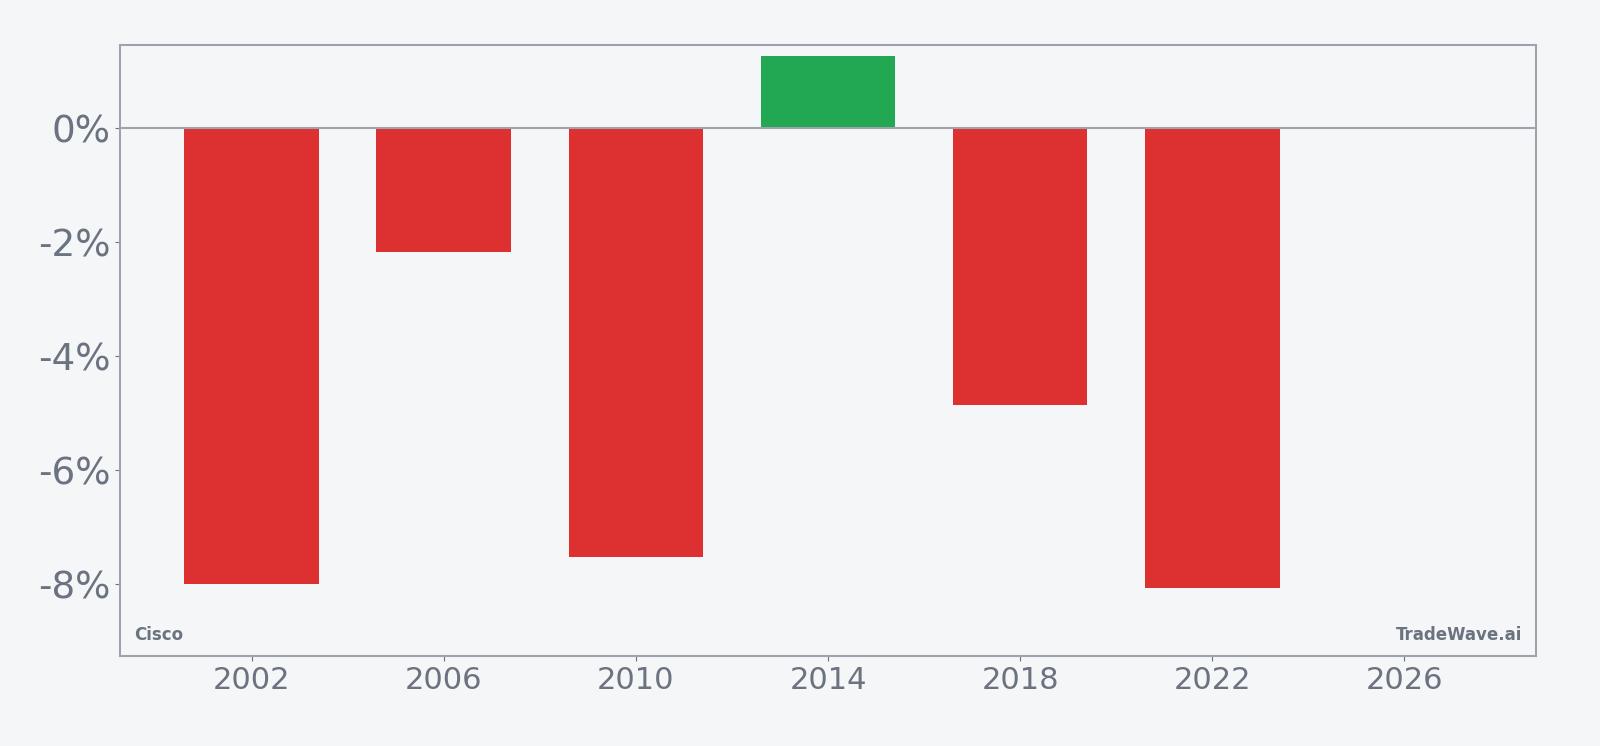
- Individual years have seen net returns as weak as -8.06% and as strong as 1.27%, underscoring a skew toward downside outcomes for longs.
- Intraperiod swings have been meaningful, with some years showing double-digit adverse moves from entry before stabilizing.
- Traders watching this Cisco trading window should treat it as a historically soft stretch rather than a guaranteed drop.
According to historical data from TradeWave.ai, this mid-May stretch has behaved differently from a typical month for Cisco, especially in midterm election years.
How has Cisco (CSCO) traded in this midterm-year May window?
Cisco is currently inside a 14-day midterm-year window that has historically leaned bearish, with the short setup profitable in 5 of the last 7 cycles and an Avg Profit of 5.1% in winning years. The stock closed Monday at $118.88, up 0.6% on the day and sitting about 0.4% below its 52-week high of $119.39, so any deviation from the usual CSCO seasonal trend would be playing out from near-record territory. That combination of a historically weak stretch and a price perched near the top of the range makes this Cisco seasonal pattern one of the more consequential short windows on the tech calendar.
Because this pattern is grouped by the presidential election cycle, it only looks at Cisco’s behavior in the last seven midterm election years, not every calendar year. That matters in 2026, which is itself a midterm election year, since policy uncertainty and shifting expectations for regulation and spending often cluster in this phase and can change how large-cap tech trades compared with the year after the presidential election or the pre-election year.
Historically, the short direction has been the favored side in this Cisco trading window. The Percent Profitable figure of 71% means the short setup has worked in 5 years and failed in 2, with losers concentrated in smaller upside squeezes rather than runaway rallies. Avg Profit of 5.1% in winning years shows that when the pattern has worked, it has tended to deliver meaningful downside for longs over just 14 trading days, while Avg Profit - All of 4% indicates that the losing years have not fully erased those gains.
The per-year table shows how uneven those outcomes can be. In 2002, a short in this window would have captured a net return of -7.99% as Cisco slid from about $11.01 to $10.13, while 2010 delivered a similar -7.52% net move lower from roughly $16.09 to $14.88. The weakest year for the short setup was 2014, when the stock actually rose 1.27% from about $17.02 to $17.24, reminding traders that even in a historically soft stretch, squeezes can and do happen.
Intraperiod swings have been large enough to matter for risk management. In 2022, the best point-to-peak move in the trade direction, or maximum favorable excursion, reached 3.51% for shorts, but the worst drawdown from entry, or maximum adverse excursion, hit -16.29% before the stock finished the window down 8.06%. Earlier cycles such as 2010 also saw a deep adverse move of -9.29% even though the short ultimately worked, which means traders leaning into this CSCO seasonal trend have historically needed room for the stock to move against them before the pattern played out.
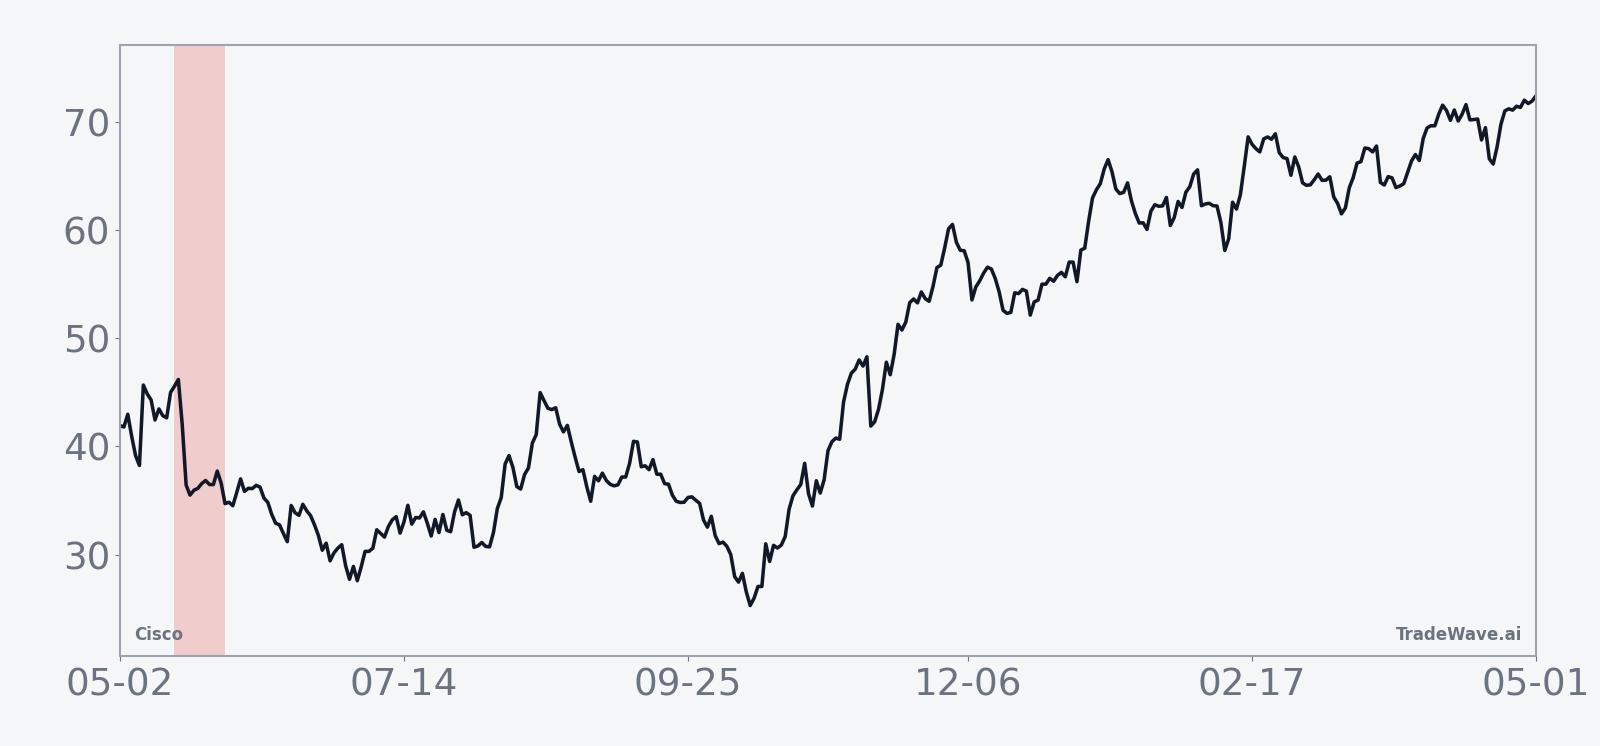
The historical seasonal average trend line for this window slopes modestly lower, with much of the downside accruing in the middle of the 14-day span rather than at the open or close. That profile suggests a tendency for Cisco to chop early, then drift or break lower before stabilizing toward the end of the window, which fits the idea of a short setup that often rewards patience rather than immediate follow-through.
A combined view of yearly net returns and intraperiod swings shows how often downside has eventually won out despite sharp countertrend moves.
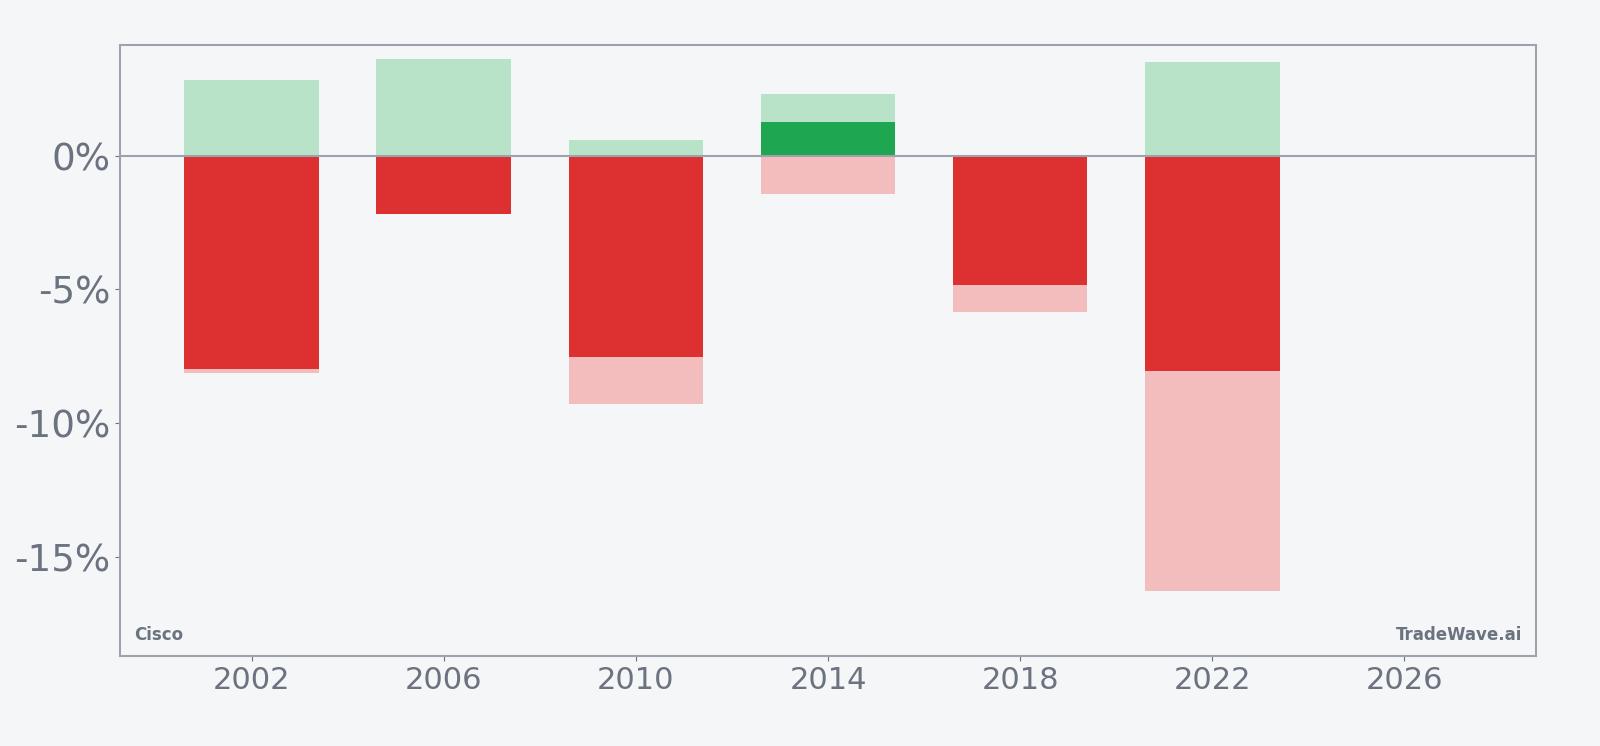
The stacked net, maximum favorable excursion and maximum adverse excursion bars reinforce that message. Years like 2002 and 2010 show net losses for longs alongside moderate favorable moves for shorts and contained adverse spikes, while 2022 stands out as a year where shorts ultimately worked but only after enduring a double-digit move against them. Add it up and this Cisco seasonal trend has favored the short side more often than not, but with enough volatility inside the window that position sizing and stop placement have mattered as much as direction.
History does not guarantee future results; adverse excursions can be large even in winning windows, so traders should treat this pattern as context rather than a forecast.
Why does Cisco (CSCO) follow this seasonal pattern?
One likely driver is the way Cisco’s fiscal calendar and guidance cadence intersect with the broader midterm election year. The company typically reports and updates its outlook around this part of the year, and in midterm cycles investors have often used that information to rebalance exposure to networking and AI infrastructure themes.[1] This pattern may also reflect sector rotation as large funds adjust tech weightings ahead of the stronger pre-election year, leaving stocks like Cisco more vulnerable to short-term profit-taking in late spring.
What is driving Cisco (CSCO) today?
Cisco shares finished Monday at $118.88, up 0.67 on the session, extending a powerful run that has taken the stock 35.54% higher over the past month and left it just about 0.4% below its 52-week high of $119.39. That surge has come in the wake of strong AI infrastructure demand, with the company previously flagging a multibillion-dollar pipeline of orders tied to hyperscaler data center buildouts and upgraded networking gear.[6] In February 2026, Cisco’s Q2 results topped expectations on both revenue and earnings, but the stock sold off on what investors saw as cautious guidance and concerns around costs, a reminder that even strong AI narratives can be sensitive to margin and spending details.[1]
The chart below situates the latest move in its recent multi-month context, alongside a 60-day seasonal projection path.
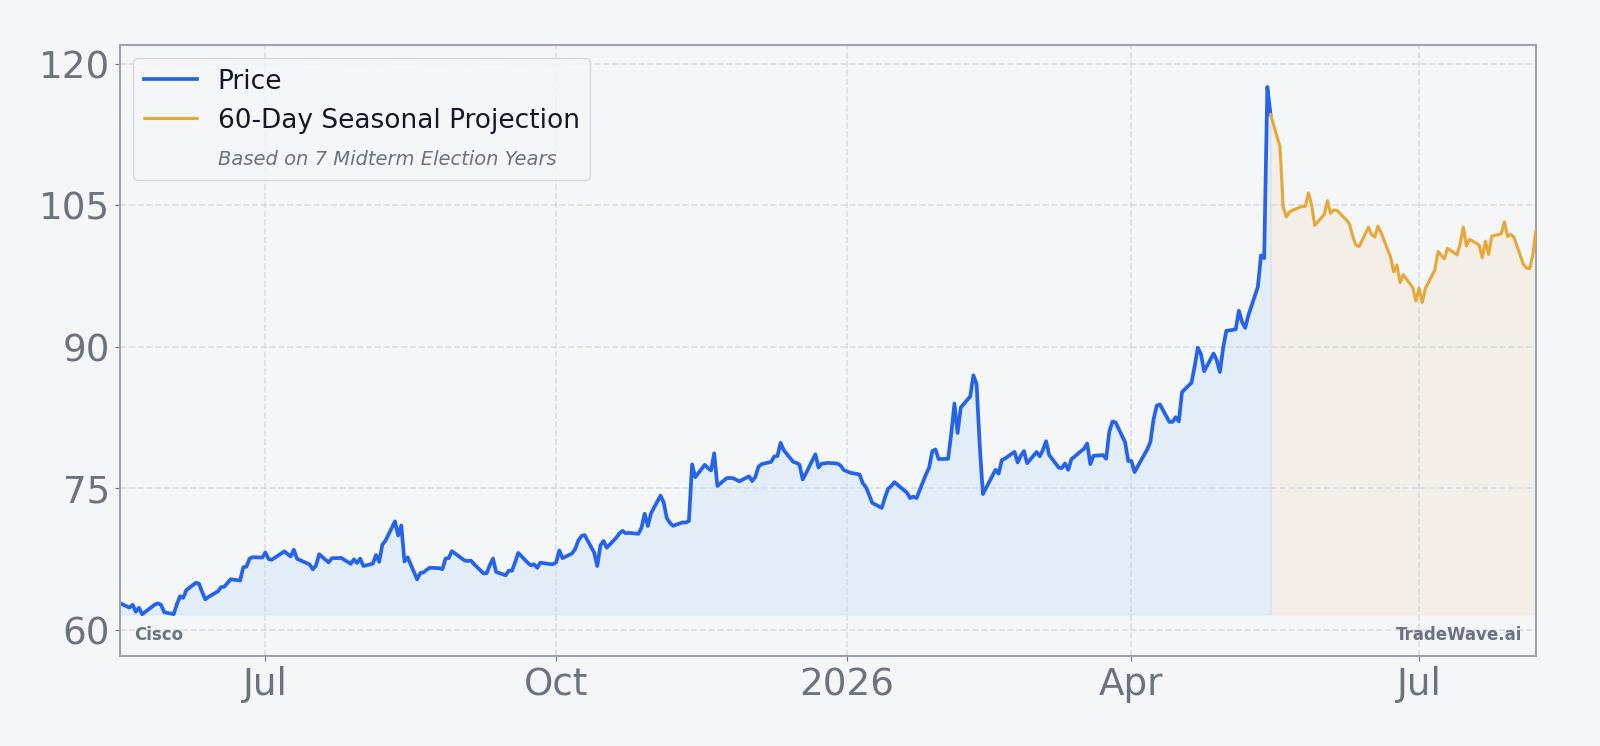
In November 2025, Cisco raised its full-year 2026 guidance on the back of AI-driven demand, lifting its revenue outlook to $60.2 billion to $61 billion and boosting its EPS range, which helped reset expectations for the stock ahead of this year’s midterm cycle.[3] Reuters reporting from the same period pointed to strong equipment demand and a more than $2 billion AI order pipeline, framing Cisco as a key beneficiary of the data center arms race rather than a slow-growth legacy hardware name.[6] That backdrop helps explain why the stock is pressing new highs even as the historical CSCO seasonal trend for this specific mid-May window has often favored the short side.
Options positioning has also been aggressive around earnings, with one recent setup showing heavy call buying of more than 75,000 contracts against roughly 16,000 puts and implied volatility near 47, a sign that traders have been willing to pay up for upside exposure in Cisco.[9] When a stock with that kind of bullish options skew enters a historically weak seasonal stretch, the risk is that any disappointment on guidance, AI commentary or macro data can trigger a sharp unwind as hedges are adjusted and short-term holders lock in gains.
What should traders watch in this Cisco (CSCO) window?
For this 14-day midterm-year window, the first thing to watch is whether Cisco can hold above the $116 to $119 band that has defined the latest push to new highs. A clean break below that zone during the window would line up with the historical pattern of mid-window weakness, while a grind higher or sideways consolidation would mark a clear departure from the usual CSCO seasonal trend.
Second, the policy and macro calendar matters more than usual in a midterm election year. Any shifts in expectations for regulation of large tech platforms, government IT spending or data center energy policy could feed directly into sentiment around Cisco’s AI infrastructure story, especially as investors look ahead to the stronger pre-election year that historically follows midterm volatility.[1]
Third, traders should keep an eye on options flow and implied volatility. If the heavy call buying and elevated IV seen around prior earnings periods persists or builds during this window, it would suggest that speculative appetite is still strong and could blunt the typical seasonal downside.[9] A sharp drop in call activity or a pivot toward put buying, by contrast, would be more consistent with the historical short-friendly behavior and could amplify any pullbacks that emerge while the window is open.
Finally, watch how Cisco trades into and out of this window relative to the broader tech sector. If the stock underperforms peers during a market that is otherwise stable or rising, that would echo prior midterm-year patterns where investors quietly rotated out of networking names ahead of the pre-election year. If instead Cisco continues to lead on the upside, it would signal that the AI infrastructure theme is overpowering the usual seasonal gravity, at least for this cycle.
Sources
- [1] CNBC, "Cisco's stock drops 7% on mediocre forecast even as earnings and revenue top estimates," Feb 11, 2026.
- [2] CNBC, "Cisco shares slide after earnings fail to wow the Street," Feb 12, 2026.
- [3] CNBC, "We're increasing our Cisco Systems price target after an AI-fueled beat and raise," Nov 13, 2025.
- [6] Reuters, "Cisco shares climb on strong AI-fueled equipment demand," Nov 13, 2025.
- [9] CNBC, options activity discussion in "Cisco shares slide after earnings fail to wow the Street," Feb 12, 2026.
About this seasonal analysis
Seasonal pattern data is sourced from TradeWave.ai, which analyzes historical price behavior across annual calendar windows going back up to 30 years. Read the full data methodology or the book The 100-Year Pattern by Afshin Moshrefi (2026 edition). Past performance of seasonal patterns does not guarantee future results. This article is for informational purposes only and does not constitute investment advice.