Micron Technology (MU) AI Boom Meets a 6-for-6 Midterm Summer Losing Streak for Bulls
Micron Technology is heading toward a 133-day midterm-election-year seasonal window that has been consistently bearish, even as the stock trades near record territory in the AI memory boom.

What is the seasonal pattern for Micron Technology (MU)?
Micron Technology has fallen in 6 of 6 midterm-election-year summer windows since 2002, with an average gain of 21.14% for traders positioned short in those winning years.
- 6 for 6 in this window for short setups, with an average profit of 21.14% across winning years.
- Seasonal window starts Jun 2, 2026 and runs 133 trading days across the last 6 midterm election years.
- Percent Profitable is 100%, with 6 winners and 0 losers for the short-side pattern.
- Annualized return of 20.52% and a Sharpe ratio of 1.46 point to a historically strong risk-adjusted edge for shorts.
- TradeWave Ratio of 1.72 signals that price has typically traveled meaningfully in the trade direction within the window, even before final closes.
- Individual years have seen net drops as deep as 39.6%, with intraperiod drawdowns against the short as large as 49.06% in the weakest entry year.
According to historical data from TradeWave.ai, Micron’s midterm-election-year summer stretch has behaved very differently from a typical tech bull run, and the next iteration is about to open.
How does Micron Technology (MU) trade in midterm-year summer windows?
Micron Technology has dropped in every single midterm-election-year summer window since 2002, with short-side trades averaging 21.14% profits across six cycles. Shares last closed at 668.97, leaving the stock about 18.3% below its 52-week high of 818.67 after a sharp pullback from recent peaks.[5]
Grouping the data by the presidential election cycle matters here because this window only looks at the last six midterm election years, a phase that often brings policy uncertainty, tighter financial conditions and choppier risk appetite than the pre-election year that follows. In that specific context, Micron’s mid-year stretch from early June through roughly late November has repeatedly favored traders positioned for weakness rather than strength.
This seasonal window begins on Jun 2, 2026 and spans 133 trading days. Historically, during this period, Micron Technology has shown a clear downside bias that aligns with a short trade direction, with every midterm-year sample delivering a net decline by the end of the window.
The win-loss record is stark. Percent Profitable is 100%, with 6 winners and 0 losers for the short-side pattern, and the median profit across those trades is 21.86%. The cumulative return across all six midterm-year windows is 206%, which means that a hypothetical strategy that repeated the same short setup each cycle would have more than tripled its capital before costs.
Average profit of 21.14% reflects the mean net move in Micron’s favor for shorts across all six years, while the annualized return of 20.52% adjusts that gain for the 133-day holding period. The Sharpe ratio of 1.46 indicates that, based on end-of-window outcomes, the reward per unit of volatility has been unusually strong for a single-stock seasonal pattern.
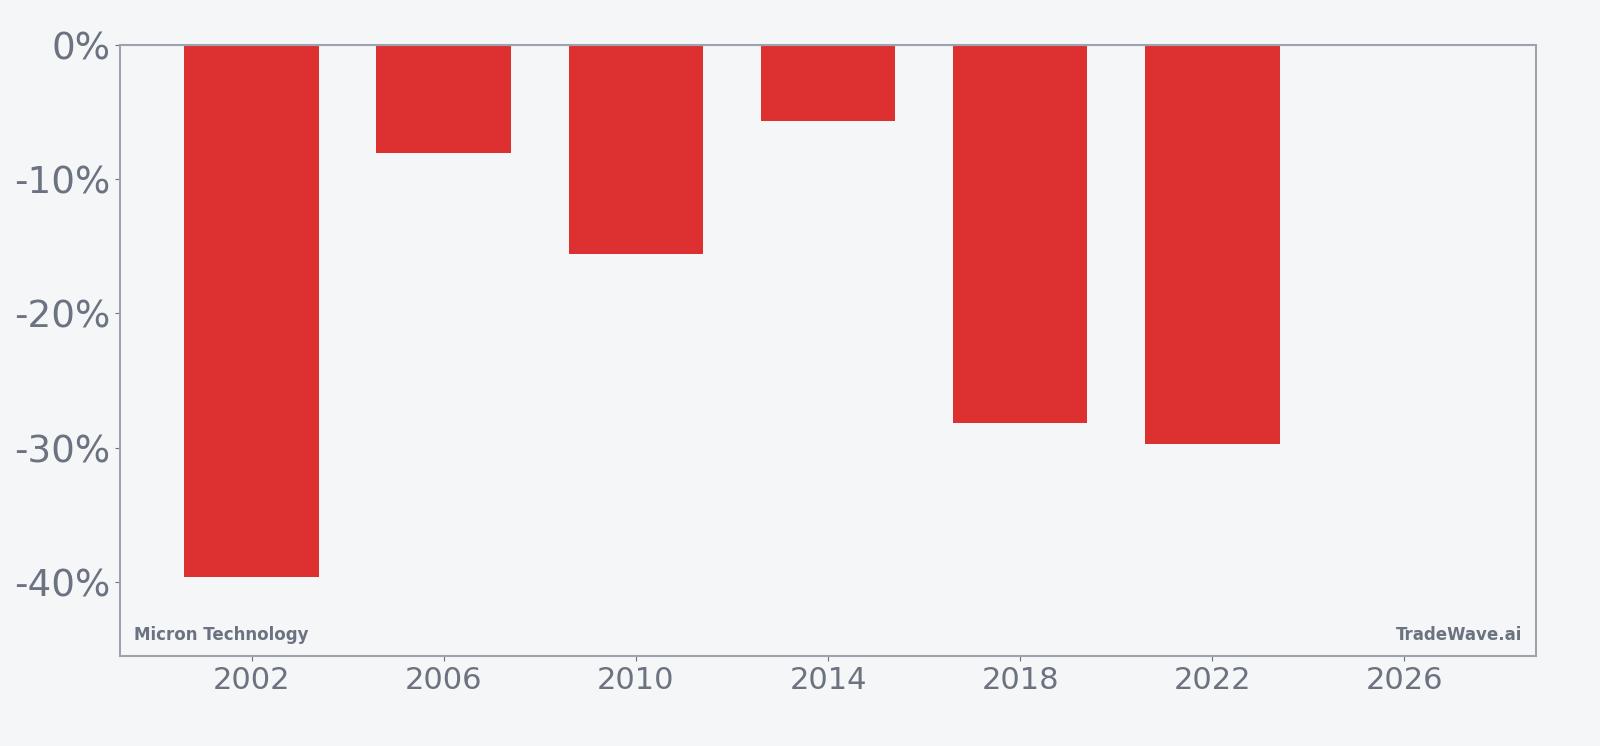
The per-year table shows how uneven those down moves have been. The strongest year for shorts was 2002, when Micron fell 39.6% from entry to exit, with the stock dropping from 21.75 to 13.14 by the end of the window. The softest outcome was 2014, when the stock still declined 5.69% despite a maximum favorable move of 21.6% at one point during the period.
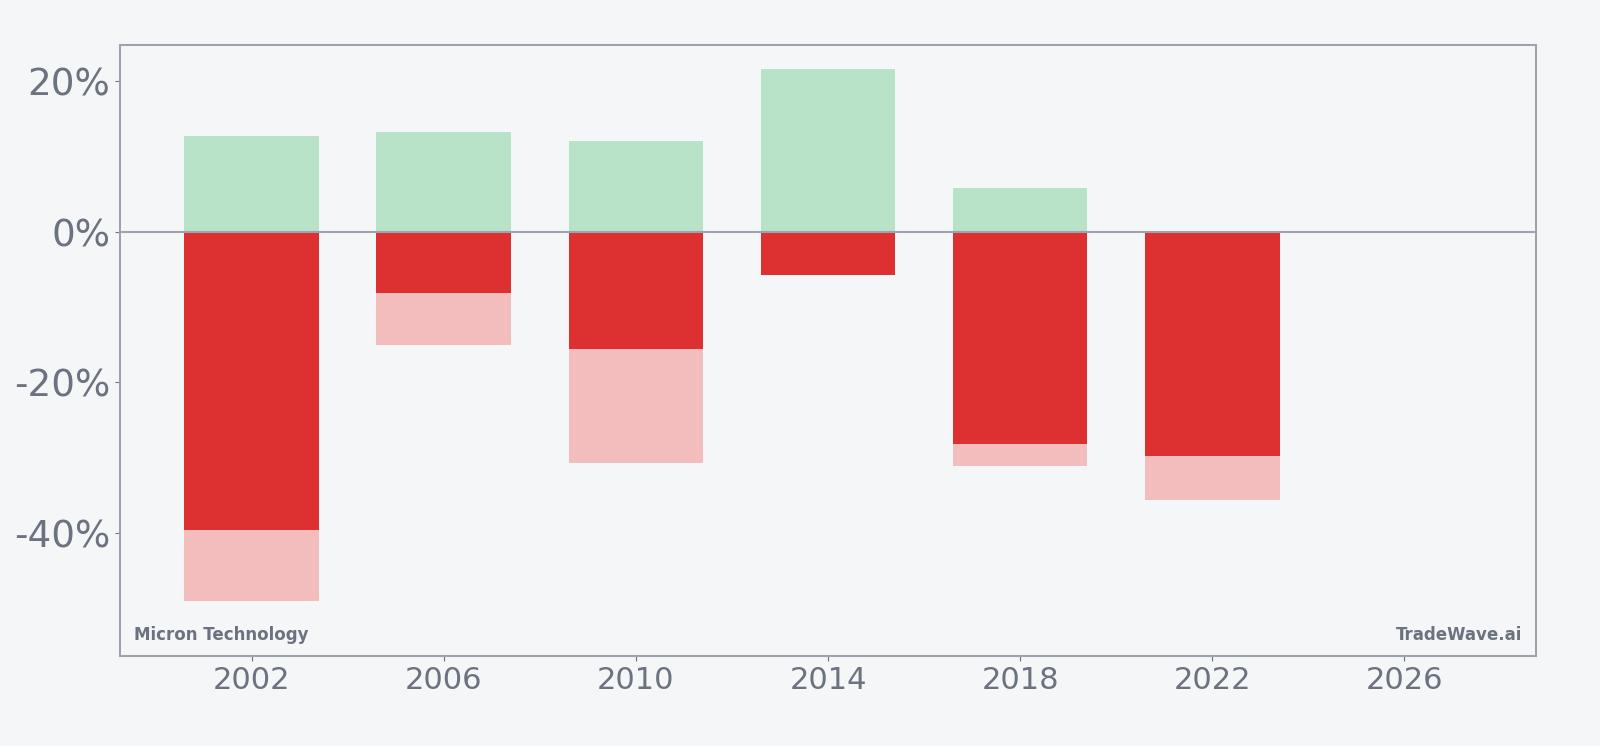
Intraperiod swings have been large in both directions. Maximum favorable excursions, or the best point-to-peak moves in the trade direction, have ranged from 5.84% to 21.6% in most years, while maximum adverse excursions, or the worst drawdowns against the short, have stretched as far as 49.06% in 2002 and 35.59% in 2022. That mix of big MFE and big MAE means the window has historically been volatile, even though shorts ultimately finished ahead in every sample.
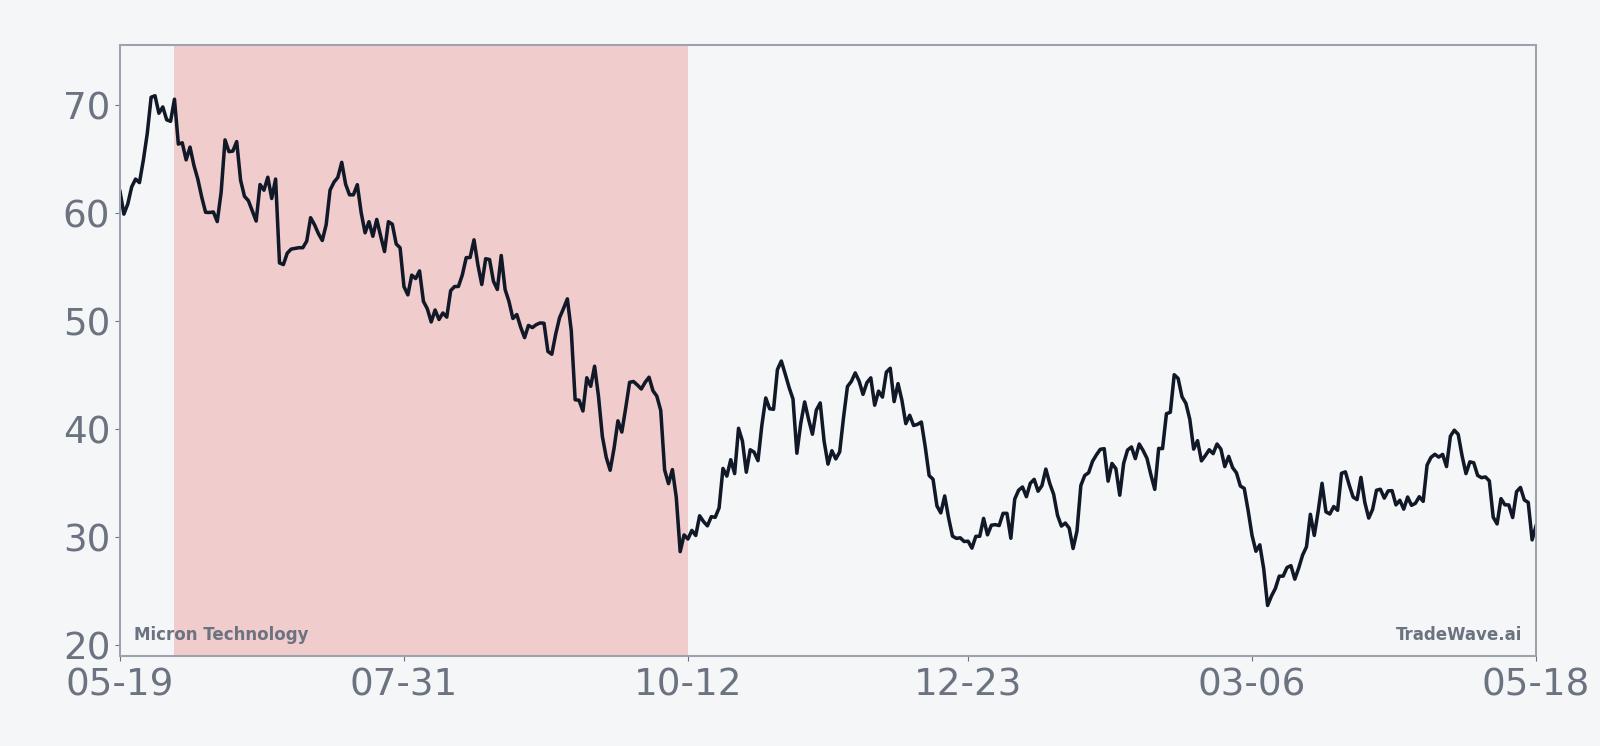
The historical average path and yearly bars together show how often Micron has trended lower in this midterm-year stretch while still delivering sharp countertrend rallies.
History does not guarantee future results, and adverse excursions within the window have at times been very large even in years that ultimately finished as winners for the short-side pattern.
The single most important takeaway is simple: six for six. In every midterm-election-year sample since 2002, Micron has ended this 133-day summer window lower than it started, and the average short-side gain has been more than 20%.
Why does Micron Technology (MU) follow this seasonal pattern?
One likely driver is the way Micron’s earnings calendar and capital spending cycles line up with the midterm year, with big guidance resets and inventory adjustments often landing in the middle of the year. Analysts have also pointed to sector rotation, as investors periodically shift out of high-beta semiconductor names when policy uncertainty and rate volatility pick up in midterm summers.[5] This pattern may also reflect institutional portfolio rebalancing after strong early-year runs, which can leave richly valued AI beneficiaries like Micron more exposed to profit-taking in this specific stretch of the calendar.
What is driving Micron Technology (MU) today?
Micron closed Monday at 668.97, down 7.7% on the day, after a steep intraday slide that took the stock as low as 663.25 and came on volume of nearly 49.7 million shares, above its 20-day average of about 47.7 million.[5] Even after that drop, the stock is still up sharply over the past month, with a 1-month return of 51.99% and a last trade that sits well above its 50-day moving average of roughly 492.36, underscoring how extended the AI-driven rally has become.[5]
In March 2026, Micron posted a massive fiscal Q2 beat, with revenue surging 196% year over year to $23.86 billion and earnings per share of $12.20, both well ahead of Wall Street estimates.[1] Management guided for Q3 revenue of $33.5 billion, EPS of $19.15 and gross margins of 81%, numbers that cemented Micron as one of the clearest winners of the AI data center build-out and the high-bandwidth memory boom.[1] Around the same time, commentary from major firms framed the stock as one of the strongest plays in the current market, reflecting both the earnings momentum and the structural supply constraints in DRAM and NAND.[5]
Those fundamentals sit on top of a powerful macro and sector backdrop. The AI supercycle has driven a surge in demand for advanced memory and storage, with hyperscale cloud providers and large model developers racing to secure capacity for HBM and leading-edge DRAM.[2] On the supply side, years of underinvestment and disciplined capacity additions have left the memory market tight, supporting record pricing and margins for producers like Micron.[1] That combination has helped push the stock to all-time highs over the past year, even as broader markets grapple with interest-rate uncertainty and uneven earnings breadth.
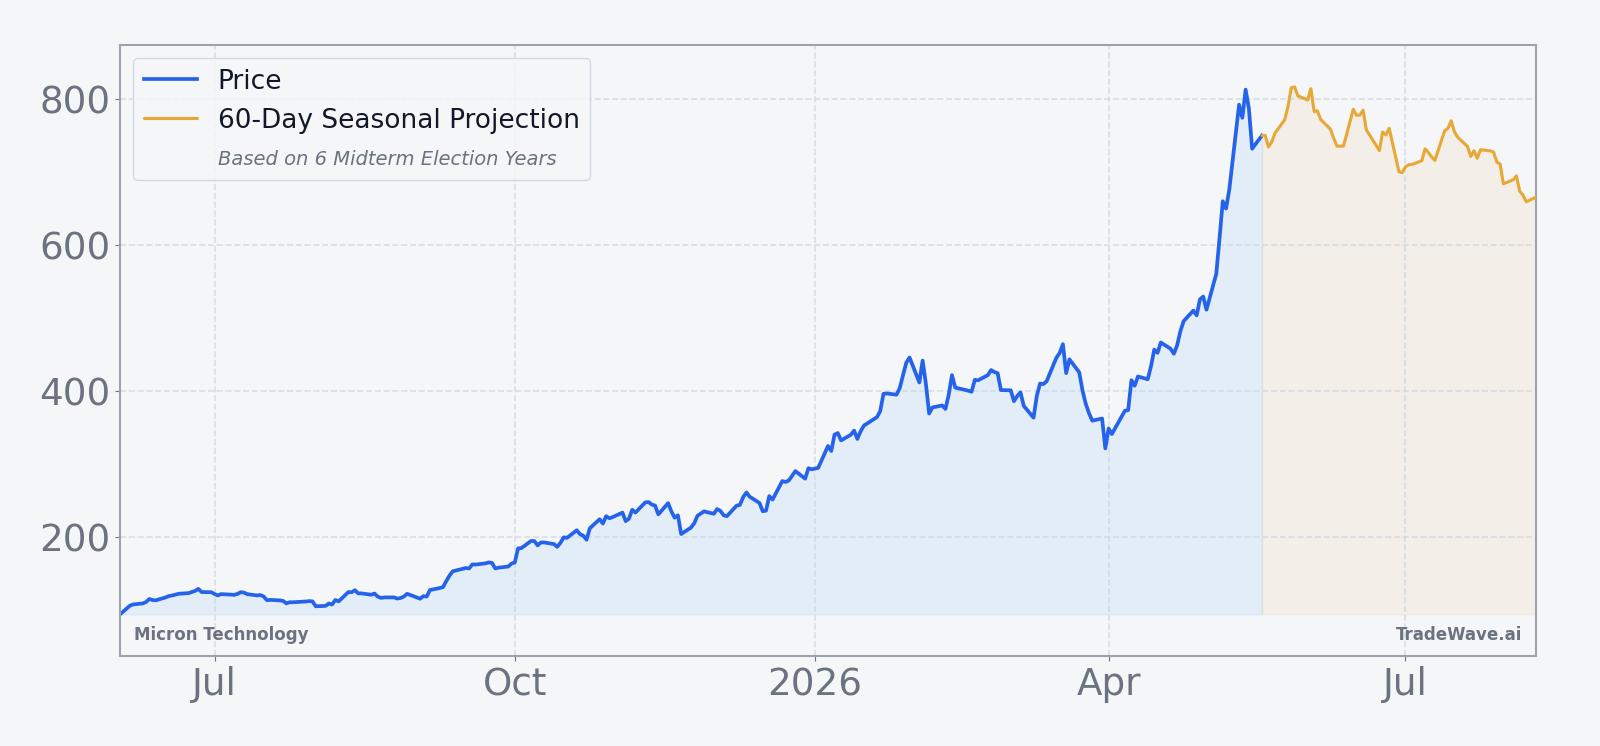
The chart below situates the latest pullback against Micron’s explosive run and a 60-day seasonal projection.
What should traders watch as this Micron Technology (MU) window opens?
The first marker is the calendar itself. The 133-day midterm-year window opens on Jun 2, 2026, so traders will be watching how Micron behaves in the first few weeks relative to the historical pattern of weakness. A firm bid that shrugs off early-summer volatility would contradict the typical MU seasonal trend, while a quick slide that takes the stock further off its highs would line up with prior midterm-year behavior.
Second, earnings and guidance updates during the window will matter more than usual. Any sign that AI data center orders are normalizing, or that memory pricing is flattening, could interact with this historically soft stretch to amplify downside moves.[1] Conversely, another upside surprise on revenue or margins could blunt the seasonal effect, especially if it lands early in the window when positioning is still crowded after the recent run.
Third, watch the broader policy and macro calendar. Midterm years often bring shifting expectations around fiscal spending, regulation and central bank policy, and those shifts can hit high-beta semiconductors harder than the market as a whole.[2] If rate expectations back up or regulatory scrutiny on AI infrastructure tightens during the summer, Micron’s role as a flagship AI hardware name could make it a focal point for de-risking.
Finally, intraperiod volatility will be a key tell. Historically, this window has featured large maximum favorable and adverse excursions, with some years seeing deep drawdowns against shorts before the trend reasserted itself. If Micron whipsaws violently but keeps closing lower into the fall, that would echo the prior pattern. If instead the stock stabilizes above key moving averages and compresses in a tight range, it would signal that the AI supercycle narrative is overpowering the usual midterm-year seasonal drag.
Sources
- Seeking Alpha, "Micron Just Smashed Estimates - Buy The Dip (NASDAQ:MU)" (Mar 18, 2026)
- CNBC, "Micron earnings are out after the bell following a big move higher. What analysts expect" (Mar 18, 2026)
- Yahoo Finance, "Micron Target Raised to $500 After Strong Q1 Earnings Beat" (Dec 23, 2025)
- Seeking Alpha, "Micron Is Still One Of The Best Stocks In This Current Market (NASDAQ:MU)" (Mar 26, 2026)
- Seeking Alpha, "Micron options lean bullish ahead of earnings with ~8% move priced in" (Mar 18, 2026)
About this seasonal analysis
Seasonal pattern data is sourced from TradeWave.ai, which analyzes historical price behavior across annual calendar windows going back up to 30 years. Read the full data methodology or the book The 100-Year Pattern by Afshin Moshrefi (2026 edition). Past performance of seasonal patterns does not guarantee future results. This article is for informational purposes only and does not constitute investment advice.