Dominion Energy (D) Has Rallied in 8 of 8 Midterm Windows Starting May 17
Dominion Energy is trading just below its 52-week high as a potential NextEra takeover collides with a historically bullish midterm-year seasonal window that has never produced a loss in this 99-day stretch.

What is the seasonal pattern for Dominion Energy (D)?
Dominion Energy has risen in 8 of 8 midterm election-year windows starting May 17, with an average gain of 6.5% in winning years.
- 8 for 8 in this 99-day midterm-year window, averaging 6.5% gains in winning years.
- Percent Profitable is 100%, with 8 winners and 0 losers across the last eight midterm election years.
- The window runs from May 17 for 99 trading days, capturing late-spring through mid-summer trading in Dominion Energy.
- Average gains cluster in the mid-single digits, but individual years have ranged from about 0.4% to more than 13%.
- Intraperiod swings have been meaningful, with some years seeing double-digit drawdowns even as the window finished positive.
- Trade Direction is long, with a TradeWave Ratio of 1.34 and a Sharpe ratio of 1.08, pointing to a historically favorable but not risk-free setup.
According to historical data from TradeWave.ai, this specific May-to-summer stretch in midterm election years has behaved very differently from an average calendar quarter for Dominion Energy. The next sections dig into how that pattern has played out and what it means with a potential takeover in play.
How has Dominion Energy (D) traded in this midterm-year window?
The seasonal record is striking: Dominion Energy has finished higher in every single midterm election-year window starting May 17 across the last eight cycles, with average gains of 6.5% over 99 trading days. The current window began on May 17 and finds the stock at about $68.13, roughly 1.2% below its 52-week high of $68.97, after a strong 11.52% one-month run. That combination of a clean 8-for-8 win streak and a price sitting near the top of its yearly range gives this year’s window unusual weight for traders watching the D seasonal trend.
Because this pattern is grouped by the presidential election cycle, it only looks at midterm election years, not every calendar year. That matters for utilities like Dominion Energy, where regulation, rate cases and infrastructure policy often move in multi-year waves that line up with Washington’s timetable rather than the simple January-to-December clock.
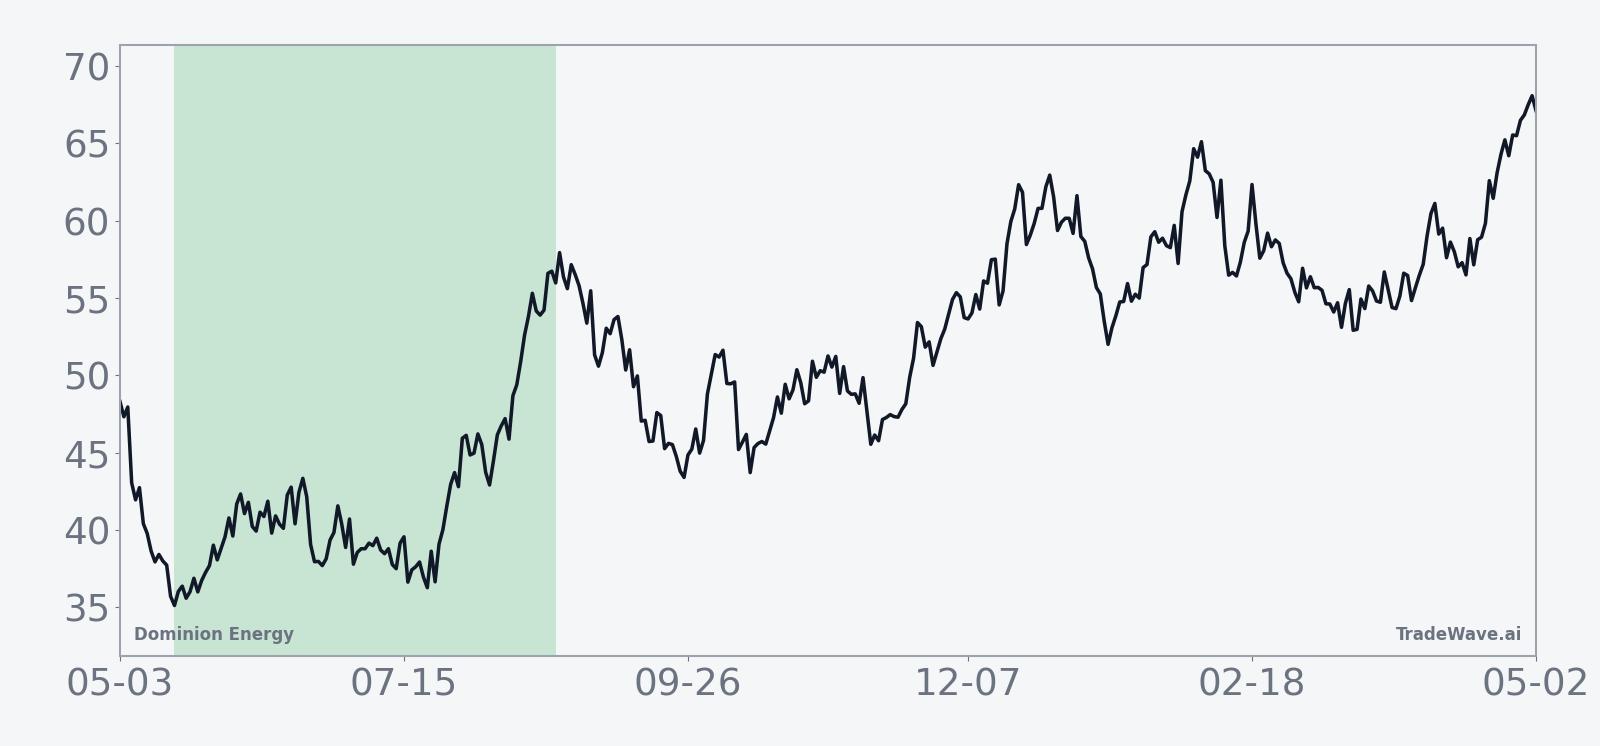
The historical seasonal average shows a steady upward grind rather than a single explosive burst. In many of the past midterm years, gains have tended to build over the full 99-day Dominion Energy trading window, with only modest pauses, which fits a slow-burn utility stock pattern more than a high-beta spike.
Per-year bars with maximum favorable and adverse moves show how much the stock has swung inside this window even when the final result was positive.
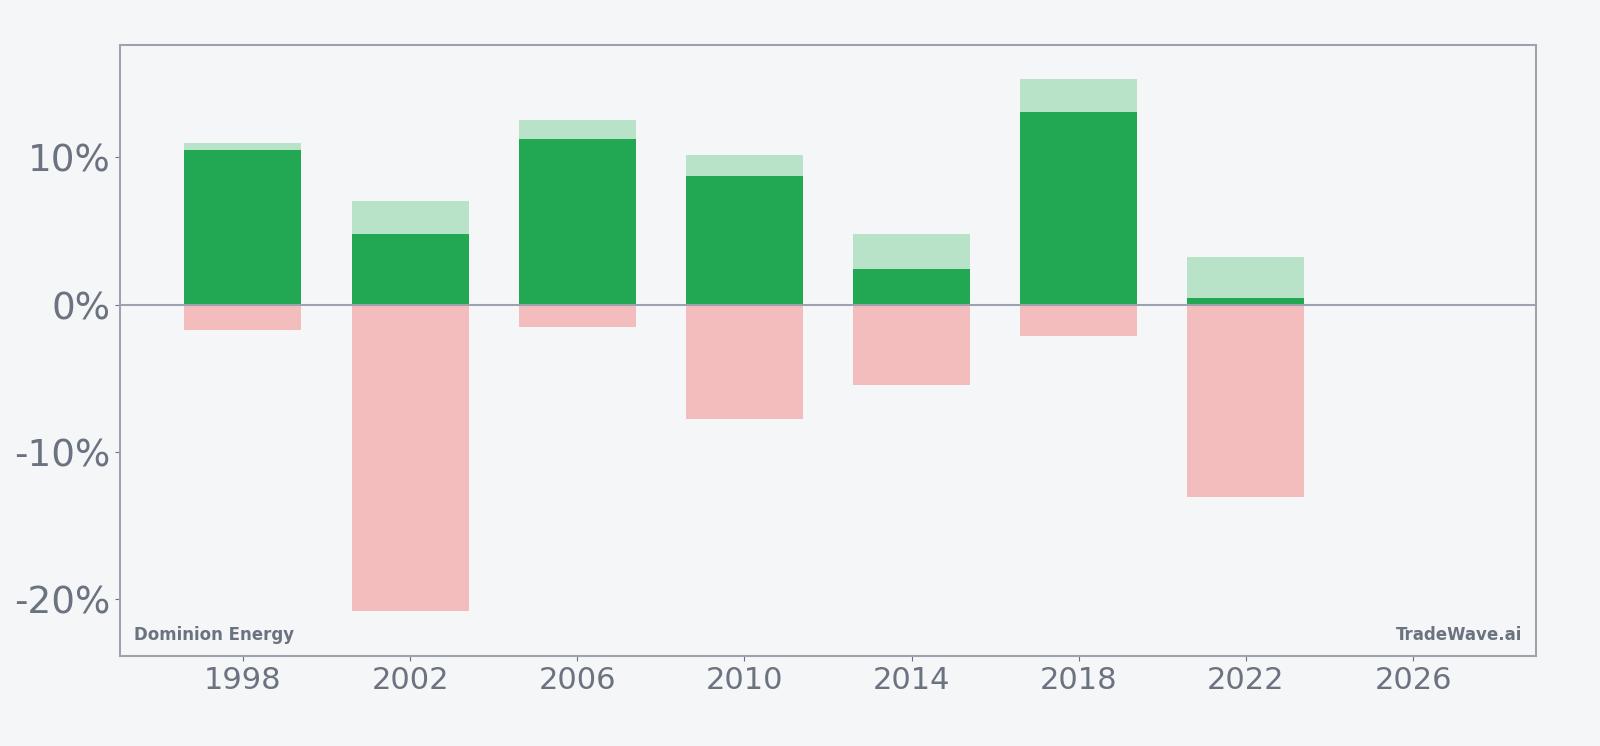
Across the eight midterm election years in this sample, the strongest window came in 2018, when Dominion Energy gained 13.07% with a maximum favorable move of 15.33% and only a shallow 2.11% worst drawdown from entry. At the other end of the spectrum, 2022 barely finished positive at 0.42%, but the stock still swung as much as 3.23% higher at its best point and sank as much as 13.09% below the starting level at its worst, underscoring how a winning window can still feel uncomfortable in real time.
Some years have combined solid net gains with relatively contained downside. In 2006, for example, the window delivered an 11.22% net return with a 12.53% peak run-up and only a 1.55% worst drawdown, a profile that long-only investors would likely welcome. Others, like 2002, show the opposite mix: a respectable 4.8% net gain but a deep 20.77% intraperiod drop, reminding traders that even historically bullish windows can feature sharp air pockets.
Put together, the 64% cumulative return across these eight midterm-year windows and the 100% win rate make this one of the cleaner bullish seasonal patterns in the utility space. The key nuance is that the path has not been smooth, with several years showing double-digit downside excursions before the window closed in the green.
History does not guarantee future results; adverse excursions can be large even in winning windows, and traders should treat this pattern as context rather than a forecast.
Why does Dominion Energy (D) follow this seasonal pattern?
One likely driver is the way utility regulation and capital spending decisions bunch around the midyear policy calendar in midterm election years, when state and federal agencies often push through rate and infrastructure decisions before the next campaign cycle heats up. Analysts have also pointed to sector rotation, with investors frequently shifting toward defensive, dividend-paying names like Dominion Energy in the middle of the presidential cycle as fiscal and regulatory uncertainty peaks. This May-to-summer window may therefore capture a recurring mix of policy clarity and portfolio repositioning that has historically favored long exposure to D.
What is driving Dominion Energy (D) today?
Dominion Energy shares last traded around $68.13, up 0.38% on the day and roughly 11.52% higher over the past month, leaving the stock about 1.2% below its 52-week high of $68.97 on elevated volume versus its 20-day average of 7.28 million shares. The immediate driver is deal speculation: on May 17, Reuters reported that NextEra Energy is discussing a mostly stock acquisition valuing Dominion at about $76 per share, or roughly $66 billion, with a potential announcement as soon as this week.[1] On May 19, Barron’s argued that Dominion has struggled to capitalize on the AI-driven data center boom and suggested that NextEra’s scale and renewables expertise could unlock more value from Dominion’s grid and generation assets.[9]
The chart below situates the latest move against Dominion Energy’s past year of trading and a 60-day seasonal projection.
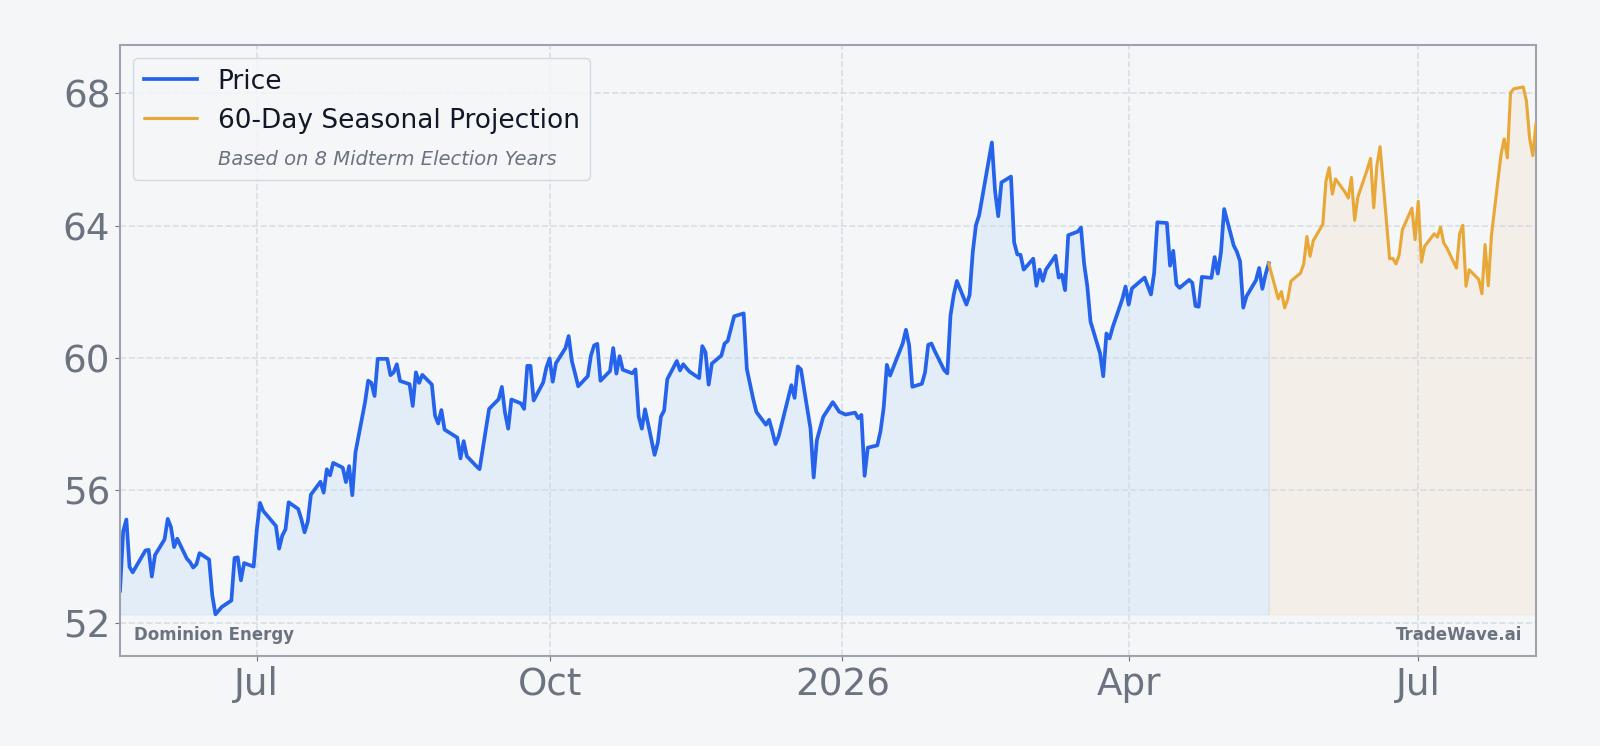
The stock’s push toward a fresh 52-week high reflects how quickly sentiment has flipped from restructuring and asset sales to potential strategic value in a tie-up with a larger peer.[1] For traders, that creates a tension between deal-driven pricing, which can cap upside near an implied offer, and the historical seasonality that has often rewarded staying long through the summer in midterm years. If a formal bid emerges near the reported $76 level, the spread between that price and the current quote will likely become the main focus, but the seasonal backdrop still matters for how the stock trades if talks drag or terms shift.
Sources
About this seasonal analysis
Seasonal pattern data is sourced from TradeWave.ai, which analyzes historical price behavior across annual calendar windows going back up to 30 years. Read the full data methodology or the book The 100-Year Pattern by Afshin Moshrefi (2026 edition). Past performance of seasonal patterns does not guarantee future results. This article is for informational purposes only and does not constitute investment advice.