CBOE Volatility Index (VIX) Faces 17-of-20 Late-June Record of Declines for Vol Sellers
CBOE Volatility Index is hovering in the middle of its 52-week range just as a late-June seasonal window that has usually seen volatility grind lower kicks in.
Price as of Jun 25, 2026: $18.89 (last close).

What is the seasonal pattern for CBOE Volatility Index (VIX)?
CBOE Volatility Index has fallen in 17 of 20 years during this late-June 27-day window, with an average 14.87% gain for short positions in winning years.
- 17 wins and 3 losses for shorts in this window over 20 years, with 85% Percent Profitable.
- The 27-day CBOE Volatility Index trading window that starts on Jun 26 has delivered an average 14.87% profit in winning years for the short side.
- Including all years, Avg Profit - All comes in at 11%, showing the pattern has stayed positive even after the three losing seasons.
- The worst year for shorts was 2016, when VIX dropped 49.6% during the window, while 2024 saw an 18.8% loss for the pattern as volatility rose.
- Intraperiod swings have been large, with some years showing double-digit peak run-ups and drawdowns before the final close, underscoring the need to respect downside risk.
According to historical data from TradeWave.ai, this late-June stretch has behaved very differently from an average month on the volatility calendar, and the current window is already in motion.
How has CBOE Volatility Index (VIX) behaved in this late-June window?
CBOE Volatility Index has moved lower in 17 of the past 20 iterations of this 27-day late-June window, making it one of the more consistently weak stretches for implied equity volatility. The new window begins with VIX at 18.89, about 46.5% below its 52-week high of 35.3 and roughly 41.1% above its 52-week low of 13.38, leaving it parked near the middle of its one-year range. That combination of a mid-range starting point and a historically soft VIX seasonal trend gives equity traders a defined backdrop for how volatility has usually behaved into mid-July.
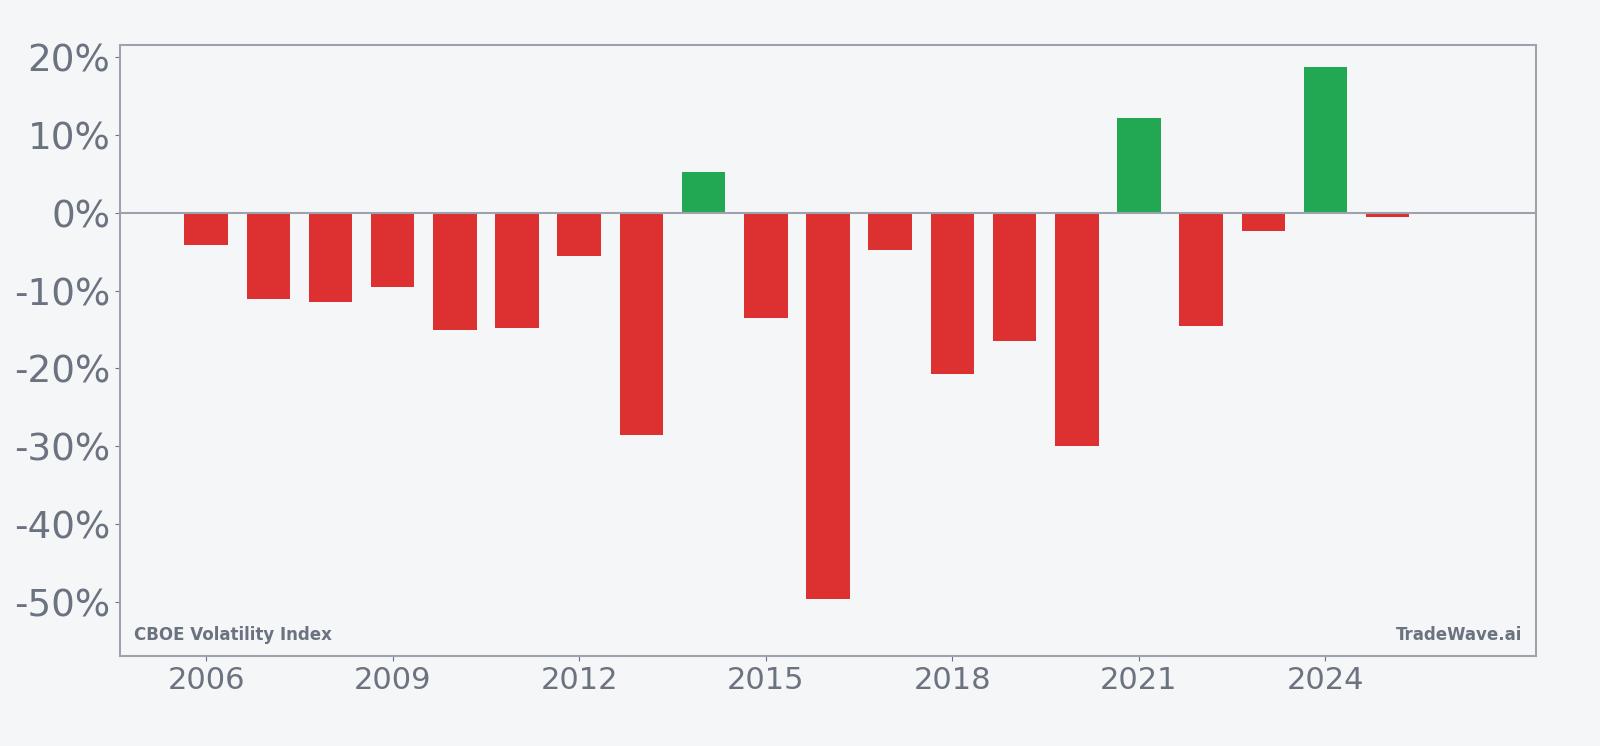
For a short trade direction, a “profitable” year in this pattern means VIX finished the window lower than it started, rewarding traders who were positioned for volatility to compress. Across the 17 winning years, the average profit of 14.87% reflects how often VIX has drifted meaningfully lower into mid-July, while the 11% Avg Profit - All shows that the three losing years have not erased the broader seasonal edge. The Sharpe ratio of 0.7 points to a reasonably strong risk-adjusted profile for this specific slice of the calendar, even though volatility-of-volatility inside the window can be high.
The per-year table shows how wide the range of outcomes has been. In 2016, VIX collapsed 49.6% during the window as post-Brexit panic faded quickly, delivering one of the strongest years for the short pattern. At the other extreme, 2024 saw VIX rise 18.8% from entry to exit, a losing year for shorts that illustrates how macro shocks can overwhelm even a strong seasonal tendency.
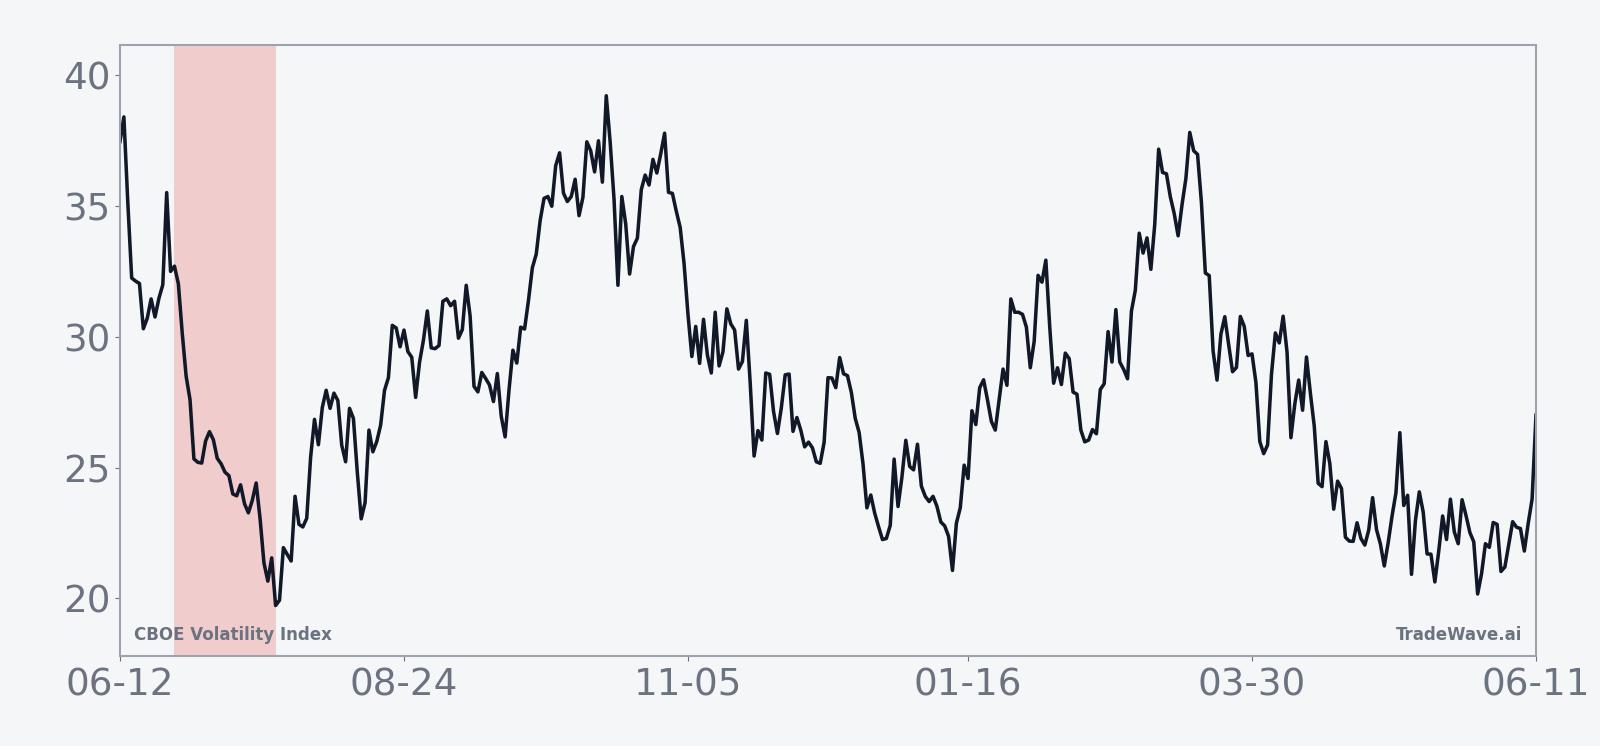
The historical seasonal trend chart shows VIX typically easing fairly steadily through the first half of the window, with the bulk of the move lower often front-loaded in the first two weeks. Later days tend to flatten out, with smaller net changes as the pattern approaches its end, suggesting that the most meaningful compression in implied volatility has usually occurred early rather than late.
Year-by-year bars that combine net results with peak run-ups and drawdowns put that average path into sharper focus.
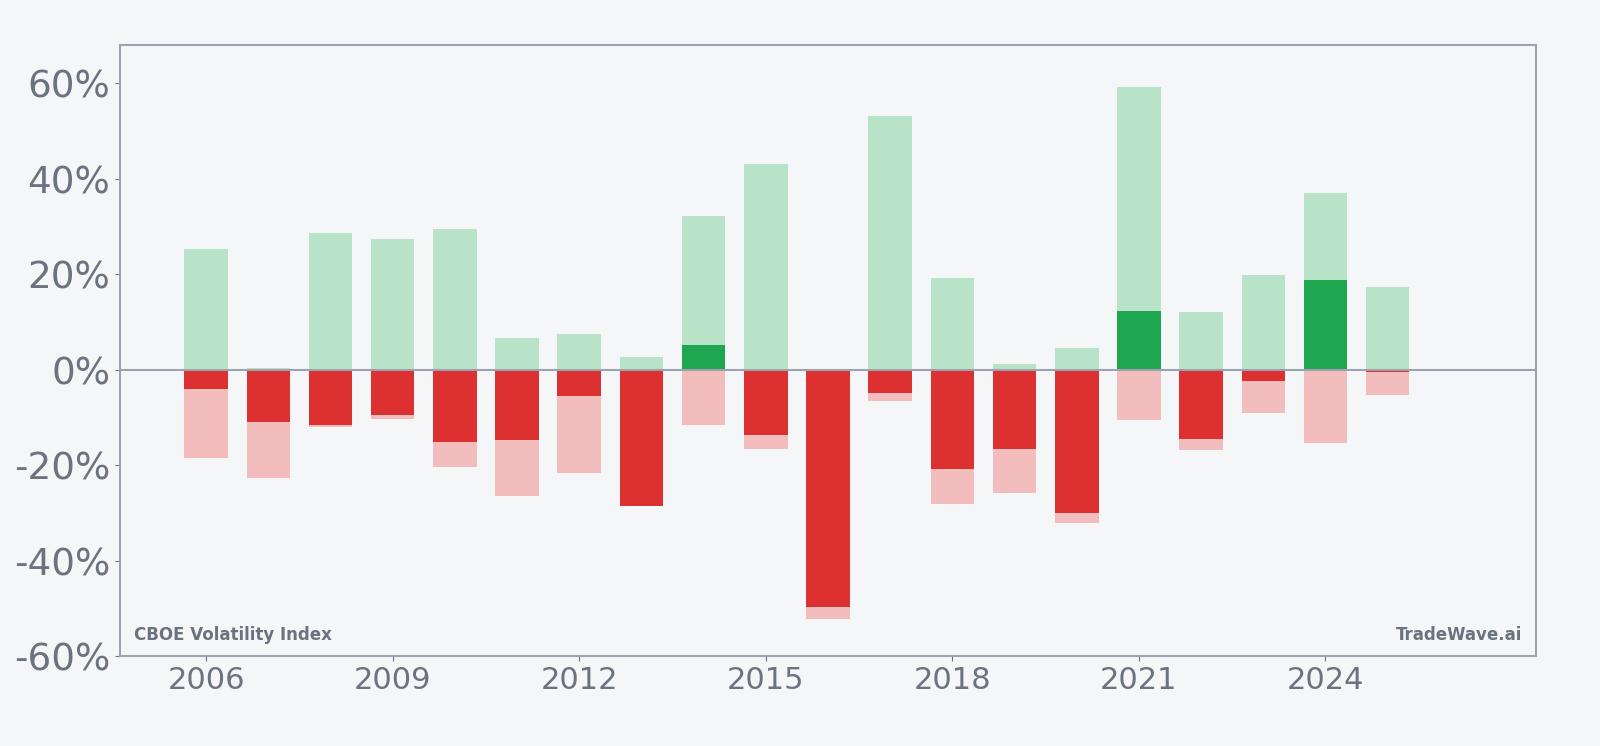
The combined net/MFE/MAE bars highlight how choppy the ride can be even in winning years. Some seasons show sizeable maximum favorable moves for shorts, where VIX dropped sharply at some point in the window, but they also carry double-digit maximum adverse excursions, meaning volatility spiked against the trade before settling lower by the close. Add it up: this has been a window where VIX has usually ended down, but intraperiod swings have been large enough to challenge weak hands.
History does not guarantee future results; adverse excursions can be large even in winning windows, and traders should size risk accordingly.
Why does CBOE Volatility Index (VIX) follow this seasonal pattern?
This late-June to mid-July stretch may reflect a lull between major macro and earnings catalysts, when investors often reduce hedges after pricing in early-summer risks. One likely driver is the gap between the first and second-quarter earnings seasons, when corporate news flow slows and realized equity volatility often drifts lower. Analysts have also pointed to options expiration patterns and midyear portfolio rebalancing as forces that can dampen index-level implied volatility even when single-stock swings remain active.
What is driving CBOE Volatility Index (VIX) today?
CBOE Volatility Index closed the prior session at 18.89, up 1.4% on the day, after trading between 17.72 and 19.95 as traders adjusted hedges around the middle of its 52-week band. That level sits well below the 35.3 high seen over the past year and above the 13.38 low, leaving VIX neither in panic territory nor at the ultra-complacent floor that prompted some strategists in January to flag a “VIX floor” near 15 to 16 as a potential buying zone for protection.[10] The index also remains modestly above its 50-day moving average of 17.7362, suggesting implied volatility has firmed slightly from the very quiet conditions seen earlier in the spring.
Recent macro episodes show how quickly that backdrop can change. On Mar 18, 2026, VIX spiked to 23.42 as Middle East conflict headlines collided with hotter producer inflation data, briefly jolting implied volatility before it cooled again.[2] In May, the index briefly popped to 19.01, its highest intraday level since late April, but faded into the close, underscoring how short-lived many of this year’s volatility bursts have been.[9] Earlier in the year, VIX traded near three-month lows around 17 even as implied volatility in the semiconductor ETF SMH hovered near 46, a disconnect that volatility desks used to structure hedges and relative-value trades between sector-specific risk and the broader market.[12]
The chart below situates the latest move in its recent multi-month context and overlays the next 60 days of seasonal tendencies.
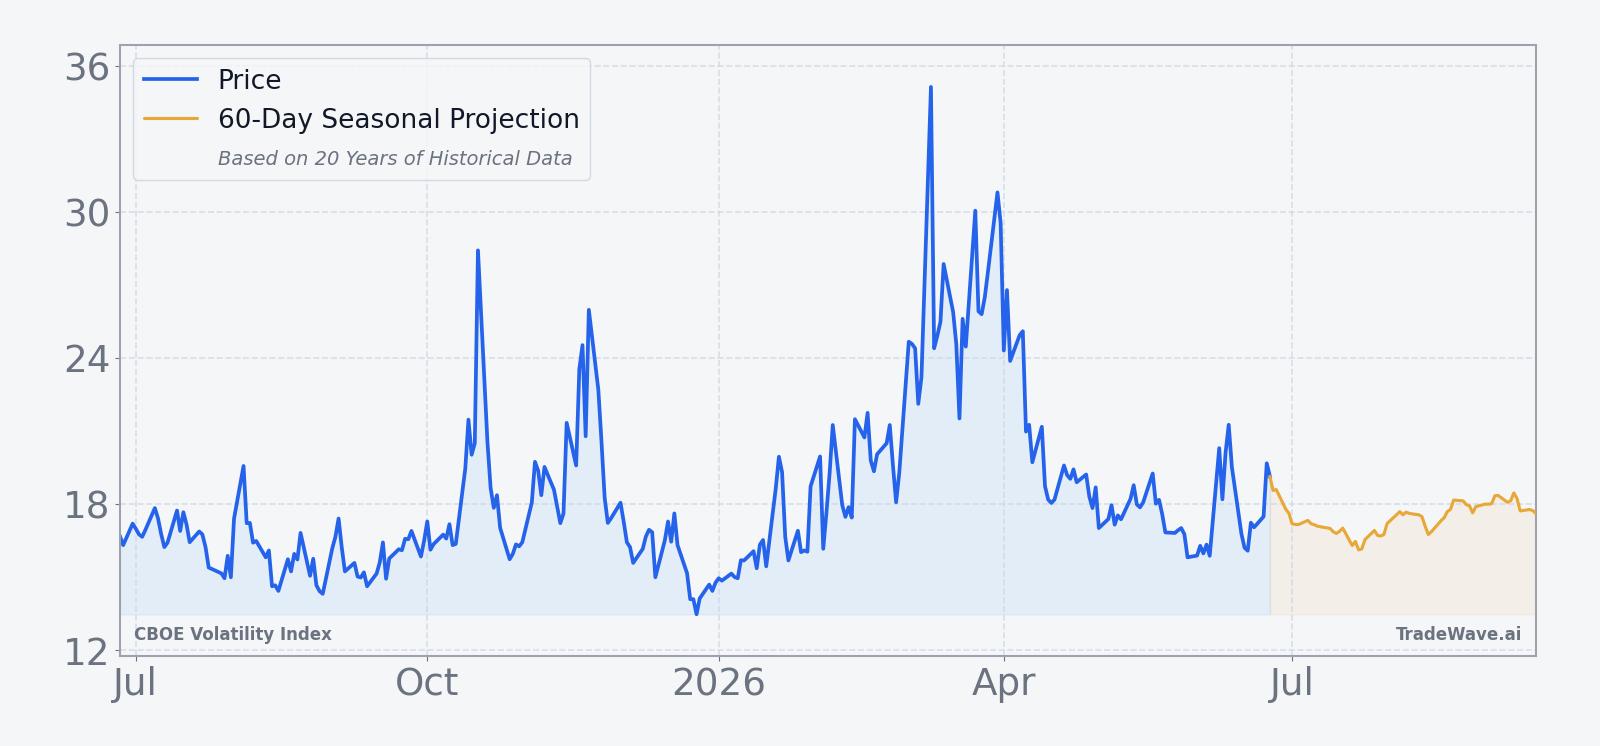
For equity investors, the key point is that implied volatility has been oscillating between brief macro-driven spikes and quick retreats, rather than trending persistently higher or lower. That pattern has supported steady trading volumes and fee revenue at exchanges when volatility flares,[6] but it has also rewarded investors who were willing to sell volatility after shocks faded. The current seasonal window, with its history of VIX compression, arrives against that backdrop of episodic but contained stress, and it will test whether 2026 continues to follow the playbook of short-lived fear or breaks into a more durable volatility regime.
What should traders watch in this VIX seasonal window?
Three things stand out for this year’s iteration of the pattern. First, watch how VIX behaves relative to its 50-day moving average around 17.7; in prior years, sustained breaks below that kind of medium-term trend line during this window have often coincided with the stronger short-side outcomes. Second, monitor macro catalysts that could interrupt the usual late-June calm, including any surprise developments on geopolitical fronts or inflation data that might echo the Mar 18 spike to 23.42.[2] A decisive move above the mid-20s during the window would look more like one of the three historical losing years for the pattern than the typical grind lower.
Third, keep an eye on the gap between index-level volatility and sector-specific implied volatility, particularly in technology and semiconductors. Earlier this year, VIX sat near 17 while SMH implied volatility hovered around 46, creating a wide spread that traders used to hedge concentrated tech risk without paying up for S&P 500 protection.[12] If that kind of disconnect widens again while VIX drifts lower in line with its historical seasonal trend, it would reinforce the idea that this window tends to favor short volatility at the index level even when single-stock stories remain noisy. If instead VIX refuses to compress and tracks higher alongside sector vol, it would be an early sign that 2026 is shaping up more like one of the rare years when this seasonal edge failed to show up.
Sources
- VIX rises as U.S.-China trade tensions and bank stress fuel flight to safety (Oct 20, 2025)
- VIX spikes amid Middle East conflict and producer inflation concerns (Mar 18, 2026)
- VIX surges on revived U.S.-China trade tensions and regional bank credit worries (Oct 17, 2025)
- VIX hits a more than three-week high after Powell firing reports (Jul 16, 2025)
- VIX climbs to near five-month high amid US-China trade fears (Oct 14, 2025)
- Market volatility lifts trading volumes benefiting exchanges (Jul 22, 2025)
- VIX spiked to 23.42 amid geopolitical and inflation concerns (Mar 18, 2026)
- VIX spikes intraday but ends lower; semiconductor volatility disconnect noted (May 13, 2026)
- VIX near three-month lows relative to semiconductor volatility (May 7, 2026)
- Advisory to use VIX call options as hedge amid calm market (Jan 13, 2026)
About this seasonal analysis
Seasonal pattern data is sourced from TradeWave.ai, which analyzes historical price behavior across annual calendar windows going back up to 30 years. Read the full data methodology or the book The 100-Year Pattern by Afshin Moshrefi (2026 edition). Past performance of seasonal patterns does not guarantee future results. This article is for informational purposes only and does not constitute investment advice.