Fed PCE Inflation Read Looms as Nasdaq 100 (NDX) Enters Its Strongest Midterm Rally Stretch
Nasdaq 100 is trading about 8.6% below its 52-week high just as it moves into a midterm-year Jul 26–Apr 17 window that has never produced a loss in the past nine cycles.
Price as of Jul 24, 2026: $28,128.34 (last close).

What is the seasonal pattern for Nasdaq 100 (NDX)?
Nasdaq 100 has risen in 9 of 9 midterm-year Jul 26–Apr 17 windows, with an average gain of 19.28% in winning years.
- 9 for 9 in this window, with Nasdaq 100 posting average gains of 19.28% across all winning years.
- Seasonal window runs from Jul 26 to Apr 17 across the last 9 midterm election years, aligned with a long trade direction.
- Percent Profitable is 100%, with 9 winners and 0 losers in the historical sample.
- Median profit of 21.26% and a TradeWave Ratio of 1.44 point to strong upside travel within the window.
- Sharpe ratio of 1.55 indicates attractive risk-adjusted returns, though individual years have seen sizable drawdowns inside the window.
- Cumulative return from stacking this Nasdaq 100 trading window across the nine cycles reaches 373%.
According to historical data from TradeWave.ai, this midterm-year stretch in Nasdaq 100 behaves very differently from an average calendar period. TradeWave.ai’s historical database shows a recurring Jul 26–Apr 17 pattern that has quietly shaped past cycles in the tech-heavy benchmark.
How has Nasdaq 100 (NDX) traded in the Jul 26–Apr 17 midterm-year window?
Nasdaq 100 has closed higher in every single Jul 26–Apr 17 window across the last nine midterm election years, averaging a 19.28% gain with a long bias. The index just finished the prior session at 28,128.34, down 1.15% on the day and sitting about 8.6% below its 52-week high of 30,762.20. That puts a powerful historical tailwind up against a market that has already run hard but is no longer at peak levels.
Grouping the data by the presidential election cycle matters here because midterm years often mark a reset in policy expectations and risk appetite. Tech and growth stocks that dominate Nasdaq 100 tend to respond sharply to shifts in rate expectations, regulation and fiscal priorities, so a midterm-to-pre-election stretch can look very different from a typical year-on-year pattern.
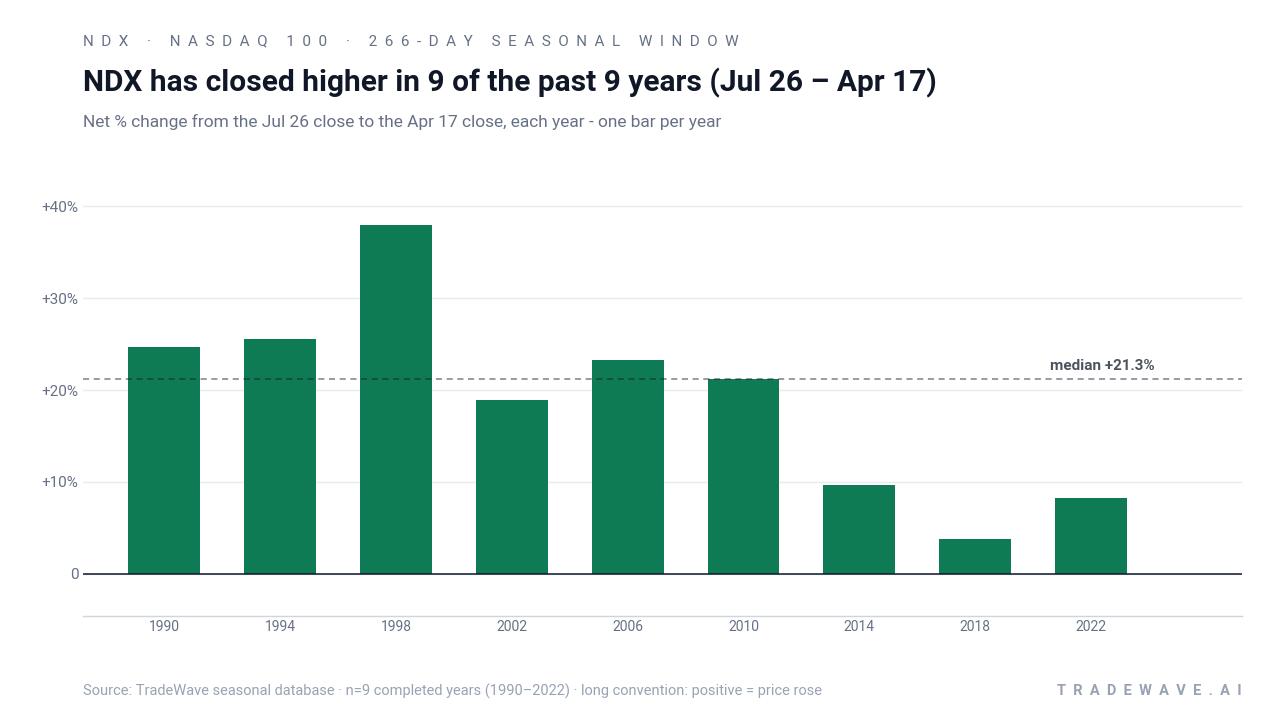
Across the nine midterm-year samples from 1990 through 2022, the trade direction is firmly long. Percent Profitable is 100%, with 9 winners and 0 losers, and the median profit of 21.26% sits slightly above the average, which suggests the gains are not just driven by one or two outlier years. Add it up and stacking this Nasdaq 100 trading window across the nine cycles compounds to a 373% cumulative return.
The per-year table shows how that plays out in individual cycles. The strongest year in the sample was 1998, when the index gained 37.94% between the Jul 26 entry and the Apr 17 exit, with a best intraperiod run-up of 57.83% before giving some of it back. The softest outcome was 2018, which still finished up 3.78% but saw a worst drawdown of 20.34% inside the window, a reminder that even “all green” years can feel rough in real time.
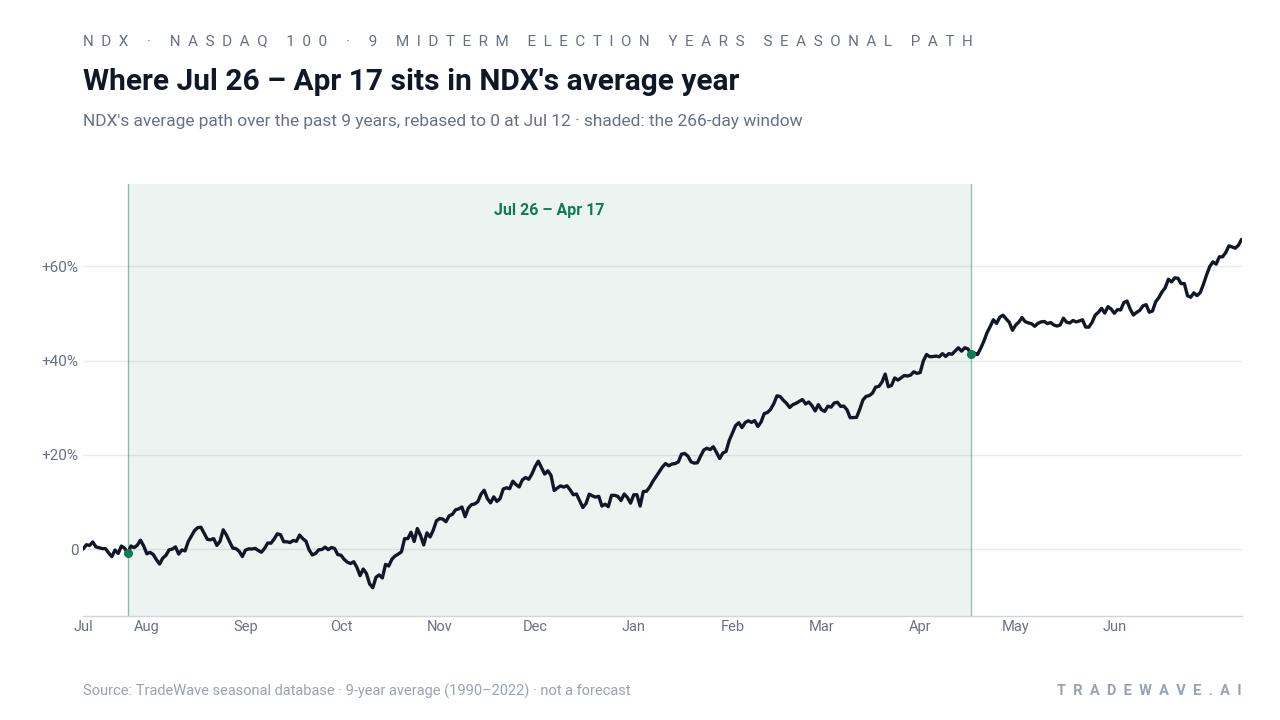
The historical seasonal average suggests the typical NDX seasonal trend in this window is a steady climb rather than a single explosive burst. Returns tend to build through the back half of the calendar year and into the early months of the following year, which lines up with the earnings calendar, holiday spending and the run-up to the pre-election year. The pattern is not perfectly smooth, but the average path tilts higher for most of the 266 days.
A closer look at yearly ranges shows how much upside and downside NDX has explored inside this window.
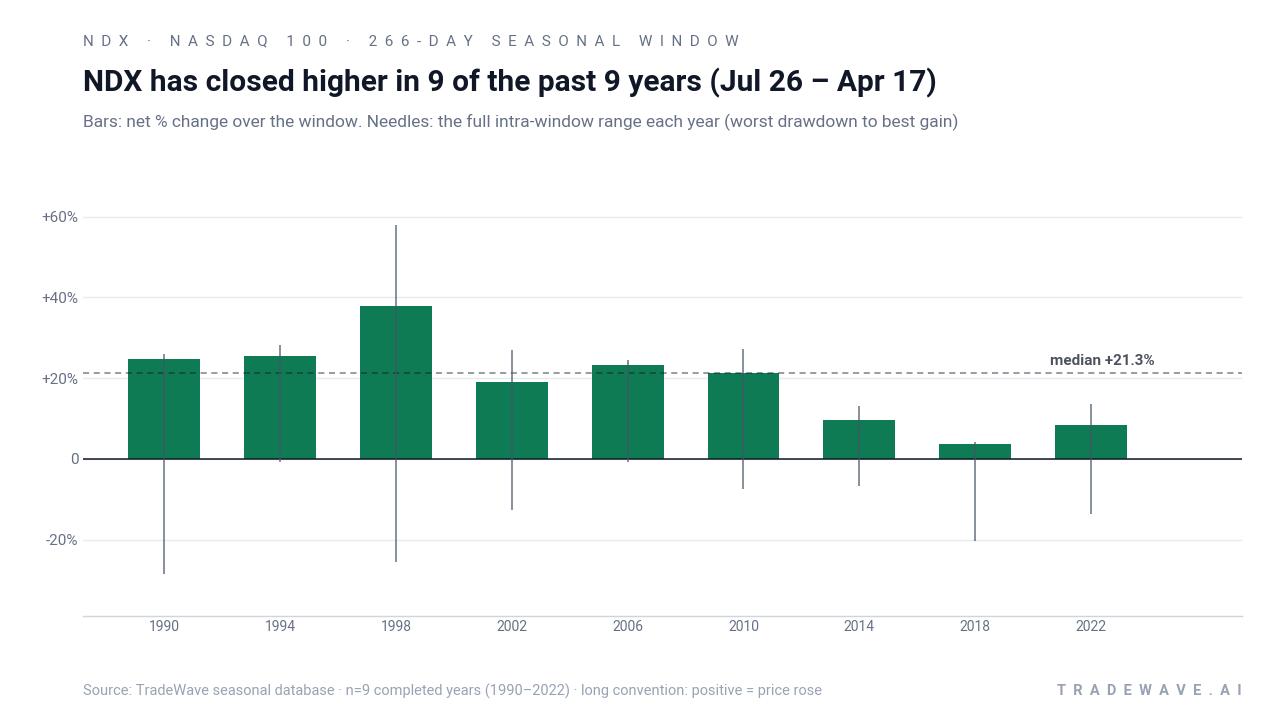
The combined net / MFE / MAE view makes the volatility profile clear. In strong years like 1998 and 1990, maximum favorable moves ran into the mid-20% to high-50% zone, while worst drawdowns still reached double digits in some cases. In quieter years such as 2006 and 1994, the worst adverse move stayed under 1%, which meant the long trade spent almost the entire window in the green. Large MFE alongside sometimes deep MAE tells traders this is a high-energy Nasdaq 100 trading window where both sharp rallies and meaningful pullbacks have been part of the ride.
History does not guarantee future results; adverse excursions (MAE) can be large even in winning windows.
Why does Nasdaq 100 (NDX) follow this seasonal pattern?
One likely driver is the way earnings season and product launches for mega-cap tech cluster in the back half of the year and into early spring, which can fuel sustained rallies when guidance is strong. Analysts have also pointed to institutional portfolio rebalancing and index-related flows around the midterm election year, as investors reposition for policy shifts and the historically stronger pre-election year. For a growth-heavy benchmark like Nasdaq 100, that combination of earnings momentum, liquidity and shifting rate expectations can translate into a repeatable midterm-year seasonal pattern.
What is driving Nasdaq 100 (NDX) today?
Nasdaq 100 finished the prior session at 28,128.34, down 326.47 points or 1.15%, after trading between 28,053.08 and 28,471.48 on the day. That leaves the index about 8.6% below its 52-week high of 30,762.20 and roughly 24.0% above its 52-week low of 22,673.88, with 20-day average volume running near 7.52 billion shares across the constituent names.
The pullback comes after a powerful multi-quarter run that has been closely tied to expectations for Federal Reserve policy and inflation trends. In December 2025, Wall Street Journal coverage highlighted how Nasdaq-100 futures often led moves around key PCE inflation releases and Fed meetings, underscoring how rate expectations can swing the index in both directions.[2] At the same time, Nasdaq 100 remains the market’s main proxy for large-cap technology and growth, a role Reuters emphasized earlier this year when detailing how the exchange is trying to speed up inclusion of big new listings into its flagship benchmarks.[1]
The chart below situates the latest move in its recent multi-month context alongside the median 60-day seasonal path.
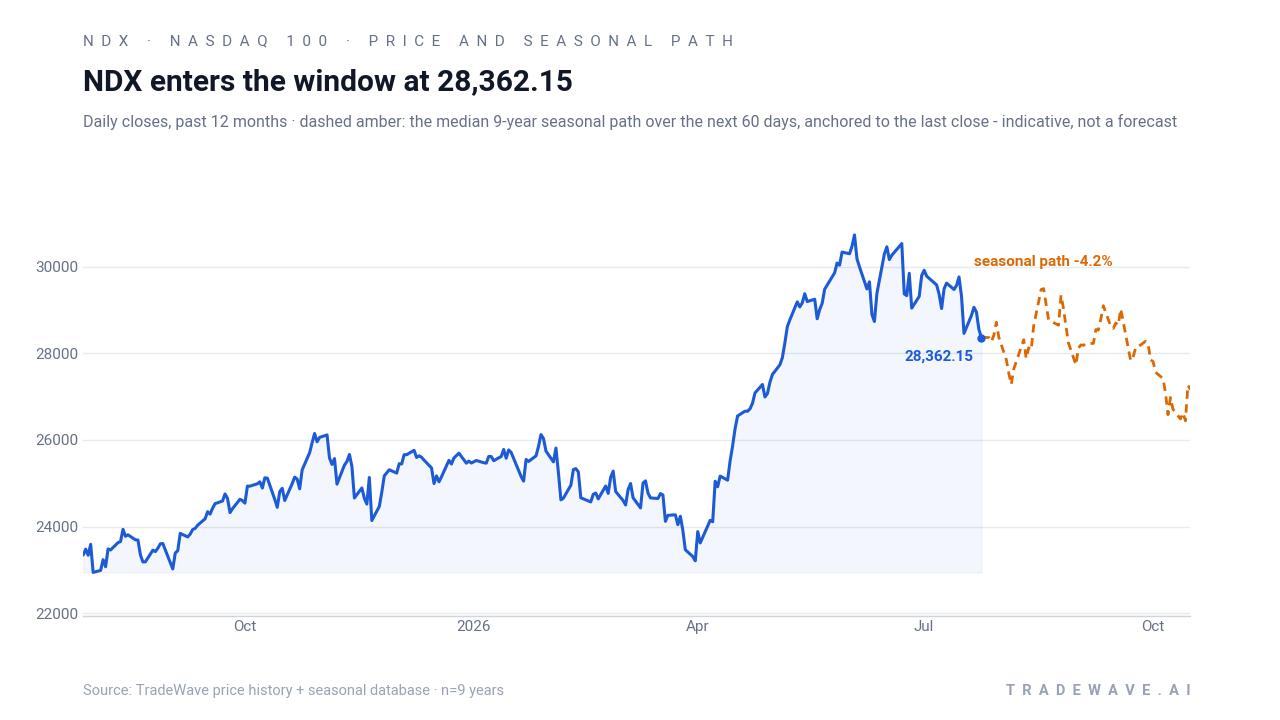
From here, the key near-term drivers remain familiar. Inflation data and Fed communication will continue to steer discount-rate assumptions for long-duration growth stocks, while earnings from the largest Nasdaq 100 constituents will shape how much of the recent rally was justified by fundamentals.[2] With the index already inside a historically strong midterm-year seasonal window, traders will be watching whether dips toward the 50-day moving average near 29,519.87 attract buyers or signal fatigue in one of the market’s most important risk-on barometers.
Sources
About this seasonal analysis
Seasonal pattern data is sourced from TradeWave.ai, which analyzes historical price behavior across annual calendar windows going back up to 30 years. Read the full data methodology or the book The 100-Year Pattern by Afshin Moshrefi (2026 edition). Past performance of seasonal patterns does not guarantee future results. This article is for informational purposes only and does not constitute investment advice.