10-for-10 Midterm Run: S&P 500 (SPX) Enters 275-Day Window Averaging 12.85% Gains
The S&P 500 is days away from a 275-day midterm-to-pre-election seasonal window that has never posted a loss in the last 10 cycles, even as macro risks around rates and geopolitics stay in focus.

What is the seasonal pattern for S&P 500 (SPX)?
S&P 500 has risen in 10 of 10 midterm-year windows starting around Jul 23 and lasting 275 trading days, with an average gain of 12.85% in winning years.
- 10 for 10 in this window, averaging 12.85% gains in winning years across the last 10 midterm election cycles.
- Seasonal window begins Jul 23 and runs 275 trading days, carrying through most of the pre-election year.
- Percent Profitable is 100%, with 10 winners and 0 losers in the historical sample.
- Median outcome is a 14.06% gain, with cumulative returns across all 10 windows adding up to 229%.
- TradeWave Ratio of 1.63 signals that price has typically traveled meaningfully in the long direction within the window, not just at the close.
- Intraperiod swings have been real, with some years seeing double-digit drawdowns even as the window finished positive.
According to historical data from TradeWave.ai, this upcoming stretch has behaved very differently from an average year on the calendar. TradeWave.ai’s multi-decade seasonal database flags the late-July midterm start as the front door to one of the S&P 500’s most consistent long windows.
How has S&P 500 (SPX) traded in this midterm-to-pre-election window?
The seasonal window that opens on Jul 23 has delivered gains for the S&P 500 in every one of the last 10 midterm election years, with an average profit of 12.85% and a cumulative 229% across those cycles. The index is currently trading between its 52-week low of 6201.5898 and high of 7620.9, leaving room on both sides as traders weigh how much of the pre-election optimism is already priced in.
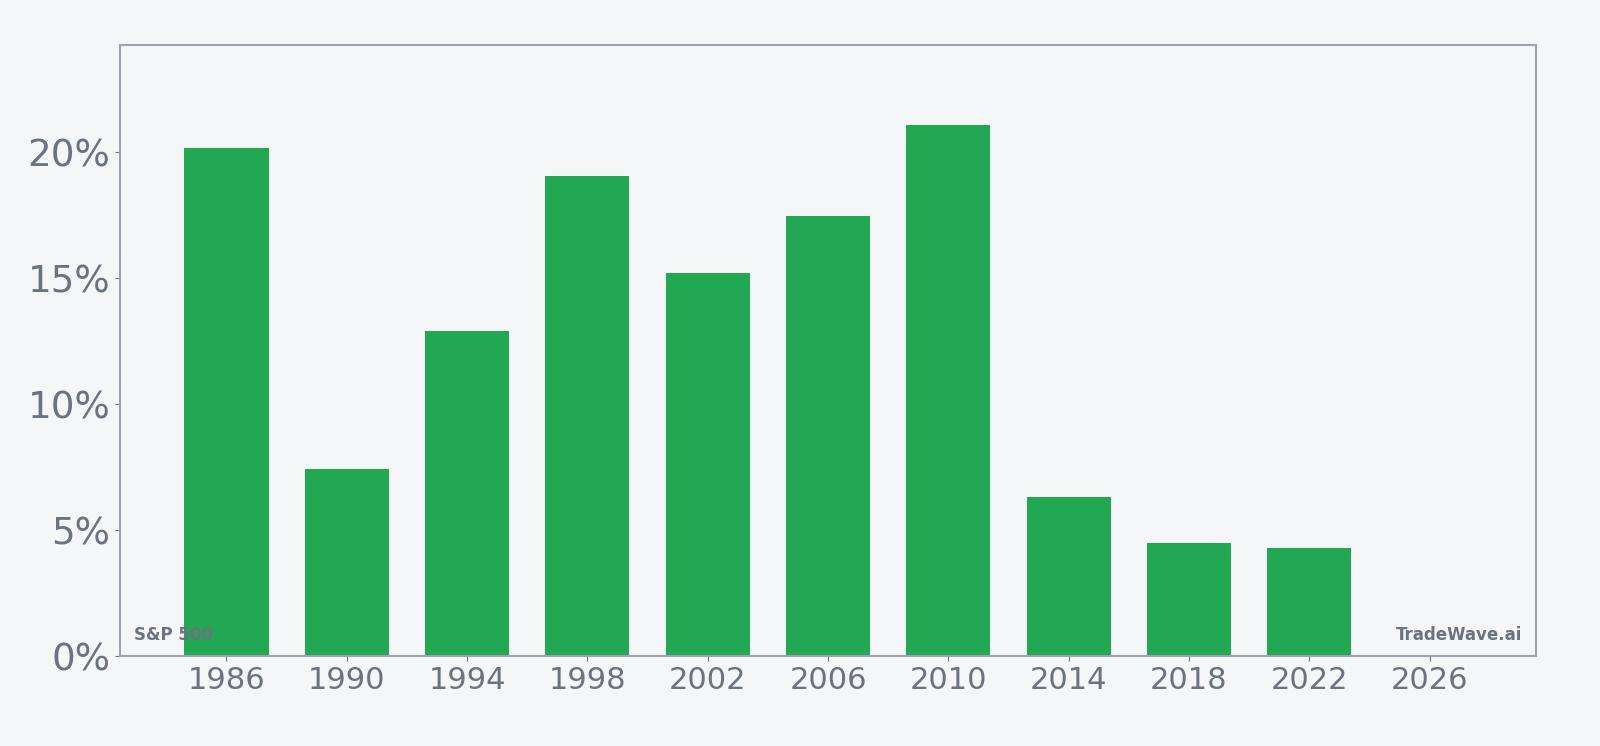
Grouping the data by the presidential election cycle matters here because this window straddles the back half of the midterm year and the heart of the year before the presidential election, a phase that has often coincided with friendlier policy tone and improving risk appetite. In this pattern, the trade direction is explicitly long, and every one of the 10 historical windows finished higher, from a 4.29% gain in 2022 to a 21.09% gain in 2010.
The average winner’s gain of 12.85% sits close to the median 14.06%, which tells you the distribution has been relatively tight for a long regime. Even the softer years, such as 2018’s 4.51% and 2022’s 4.29%, still ended green despite sizable volatility along the way. Add it up and the 229% cumulative return across the 10 midterm cycles makes this one of the cleanest long-biased S&P 500 trading windows on the calendar.
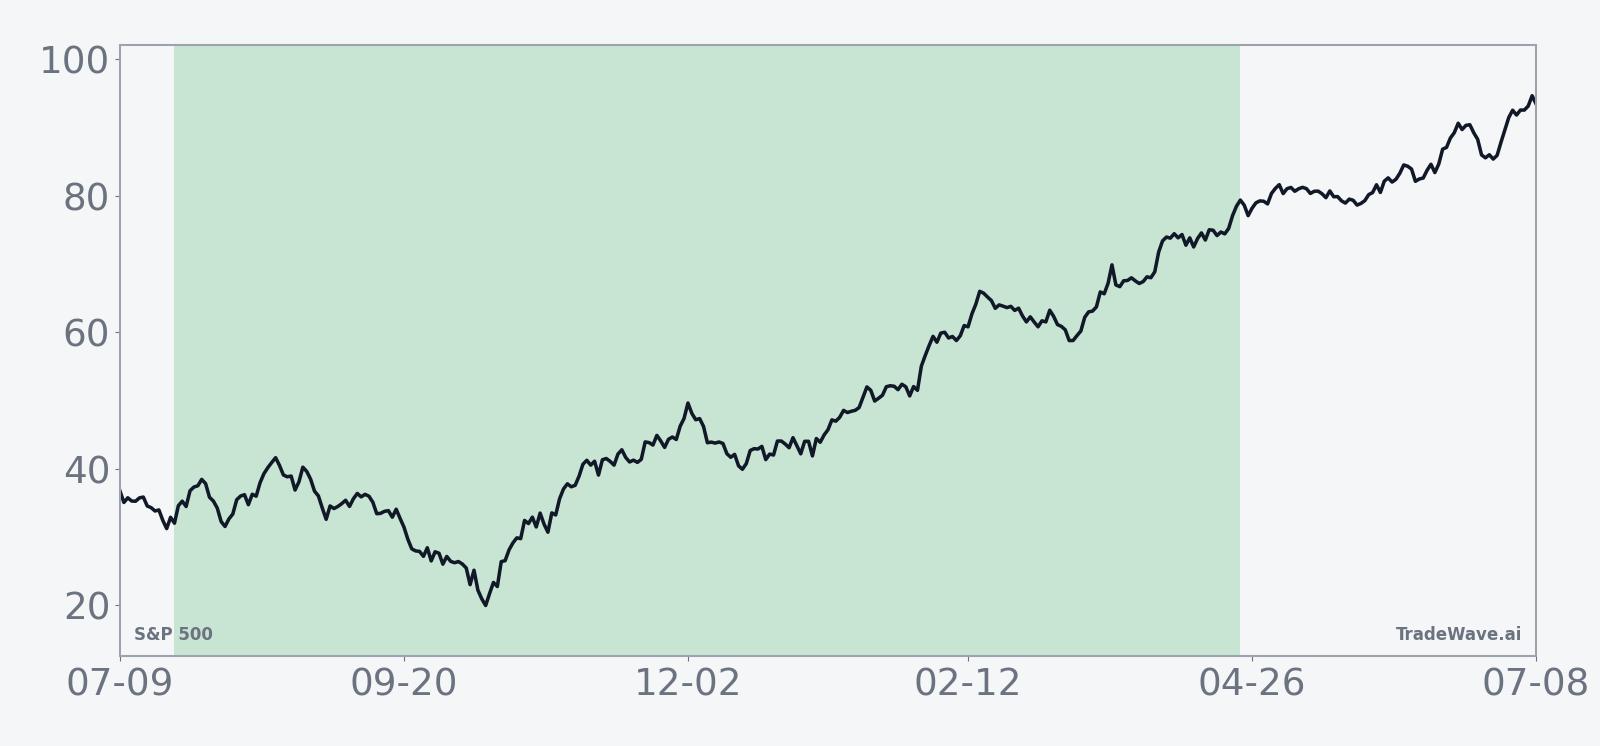
The historical seasonal trend line slopes higher for most of the 275 trading days, with only brief pauses rather than long flat stretches. The pattern tends to pick up momentum as the calendar moves deeper into the pre-election year, echoing the broader “year before the election” strength many investors know anecdotally but rarely quantify at this level of detail.
A closer look at yearly net returns and intraperiod swings shows how much room the index has typically had to run and how deep the drawdowns have gone.
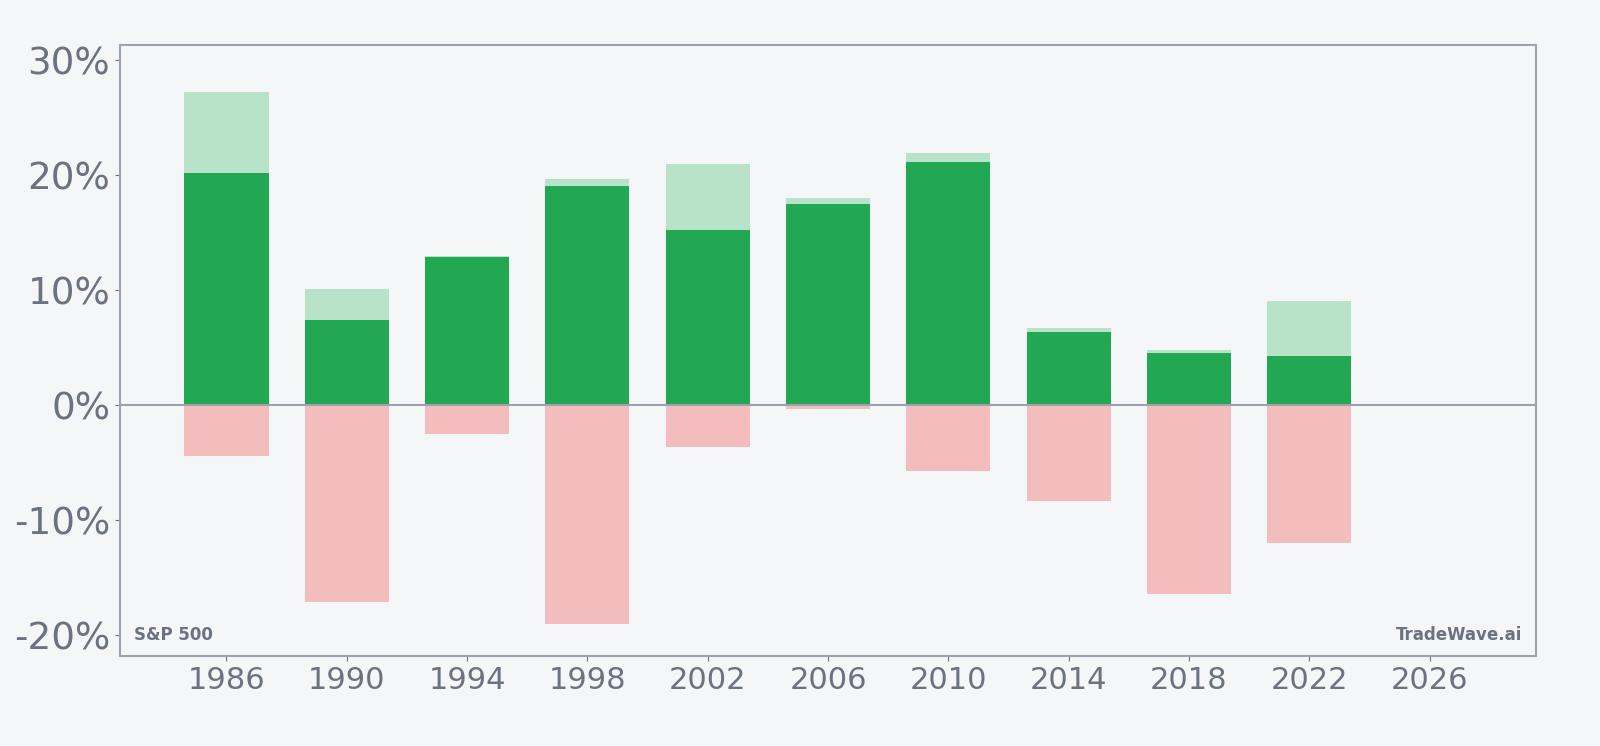
The bar chart shows that in strong years like 1986, 2006 and 2010, the S&P 500 not only finished up double digits but also saw maximum favorable moves north of 17%, while the worst drawdowns stayed relatively contained. In more volatile cycles such as 1990, 1998 and 2018, the index still ended higher, yet maximum adverse excursions reached between about 11% and 19%, underscoring that even a “never lost” window can feel rough in real time. The combination of a 1.63 TradeWave Ratio and a 1.47 Sharpe ratio captures that mix of meaningful trend and real volatility.
History does not guarantee future results, and maximum adverse excursions have reached double digits in several years even though every window in this sample ultimately finished positive.
Why does S&P 500 (SPX) follow this seasonal pattern?
One likely driver is the way the policy and earnings calendar lines up between the back half of the midterm year and the year before the presidential election, when Washington often shifts from tightening or reform toward stability and support. Analysts have also pointed to institutional portfolio rebalancing and sector rotation into risk assets as clarity on the next election field improves, which can amplify the typical pre-election risk-on bias. This window may also capture a sweet spot where rate expectations, fiscal stance and corporate profit visibility tend to align more favorably than in the choppier early-midterm months.
What is driving S&P 500 (SPX) today?
Day to day, the S&P 500 remains hostage to the same macro mix that has defined 2026 so far: shifting expectations for Federal Reserve rate cuts, inflation data and geopolitical headlines. Strategists at BMO have argued that anticipated Fed easing could keep the U.S. bull market alive, even if forward returns look more muted than in past cycles.[1] At the same time, investors are watching inflation prints and jobs data closely, since stronger numbers could trim the odds of cuts and pressure valuations that already sit near the top of their historical range.[1]
Geopolitics is the other wild card. War-related news and tensions around China and Taiwan have been cited as key downside risks for the index, particularly for globally exposed technology and industrial names that dominate the S&P 500’s weightings.[1] Sector rotation has been choppy, with some flows moving from high-beta growth into energy and value pockets, a reminder that even inside a strong seasonal regime, leadership can change quickly.[1]
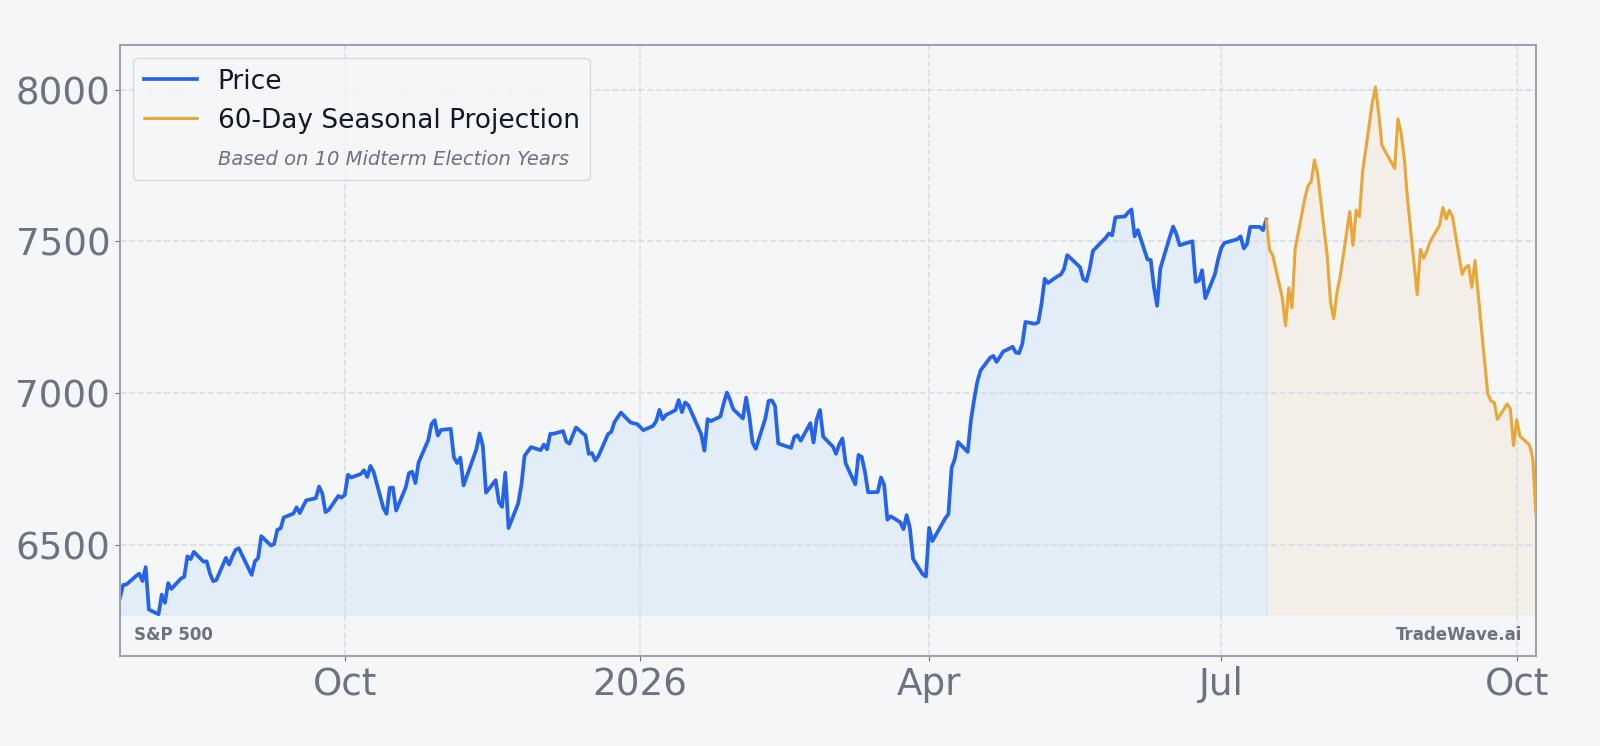
The chart below situates the latest moves against the past year’s trend and a short-term seasonal projection.
What should traders watch as this seasonal window opens?
First, the calendar. The 275-day window kicks off on Jul 23 and runs deep into the 2027 pre-election year, so any early weakness will be judged against a backdrop that has historically favored patient longs. Traders will be watching whether the index can hold above key support zones carved out in recent months while macro data on inflation and jobs either reinforces or challenges the case for Fed cuts.[1]
Second, the policy calendar. Each Federal Reserve meeting, major CPI release and payrolls report inside this window will be measured against the historical pattern of improving risk appetite in late midterm and pre-election years. If rate-cut expectations fade sharply or geopolitical shocks escalate, a repeat of the deeper intraperiod drawdowns seen in 1990, 1998 or 2018 would not be out of character, even if the window ultimately finishes higher.[1]
Finally, watch sector leadership and volatility. In prior cycles, technology, cyclicals and other growth-sensitive groups have often led the charge once the pre-election tailwind really kicked in, but rotations into energy and value have also appeared when inflation or commodity shocks hit.[1] How the S&P 500 behaves into and through this window will tell traders whether the 10-for-10 record is intact or whether this cycle is starting to break from a century of midterm-to-pre-election seasonality.
Sources
About this seasonal analysis
Seasonal pattern data is sourced from TradeWave.ai, which analyzes historical price behavior across annual calendar windows going back up to 30 years. Read the full data methodology or the book The 100-Year Pattern by Afshin Moshrefi (2026 edition). Past performance of seasonal patterns does not guarantee future results. This article is for informational purposes only and does not constitute investment advice.