Natural Gas (CME) (NG) Has Dropped in Every Midterm June Window, Shorts Averaged 8.1%
Natural Gas (CME) is climbing back above $3 even as a mid-June seasonal window that has favored short positions in every midterm election year since 1994 comes into view.
What is the seasonal pattern for Natural Gas (CME) (NG)?
Natural Gas (CME) has fallen in 8 of 8 midterm-year summer windows starting around Jun 20, with an average 8.1% gain for short positions in winning years.
- 8 for 8 in this window, with short trades averaging 8.1% gains in winning years across the last eight midterm election cycles.
- Percent Profitable is 100%, with 8 winners and 0 losers for the short-side pattern over the full lookback.
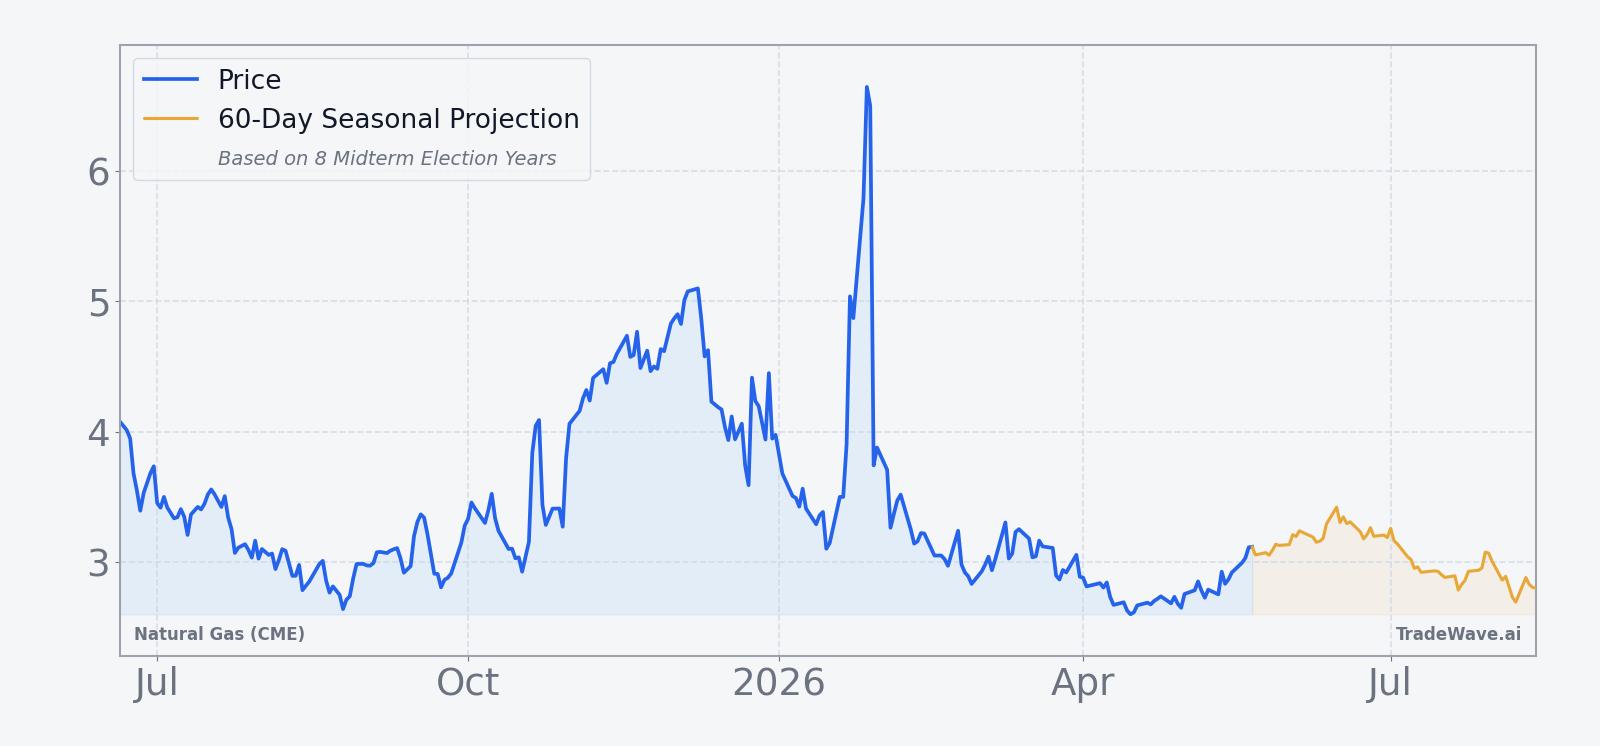
- The upcoming window begins Jun 20, 2026 and runs for 22 trading days, targeting early-to-mid summer trading in NG futures.
- The TradeWave Ratio (TWR) of 2.2 signals that price has typically traveled meaningfully in the trade direction within the window, independent of the final close.
- A Sharpe ratio of 2.33 on end-of-window outcomes points to unusually strong risk-adjusted returns for this specific short pattern.
- Individual years have still seen sizable intraperiod swings, with adverse moves against shorts reaching double digits before prices rolled over.
According to historical data from TradeWave.ai, this mid-June to July stretch in midterm election years has behaved very differently from an average summer for natural gas, and the next iteration is less than a month away.
How has Natural Gas (CME) (NG) traded in this mid-June window?
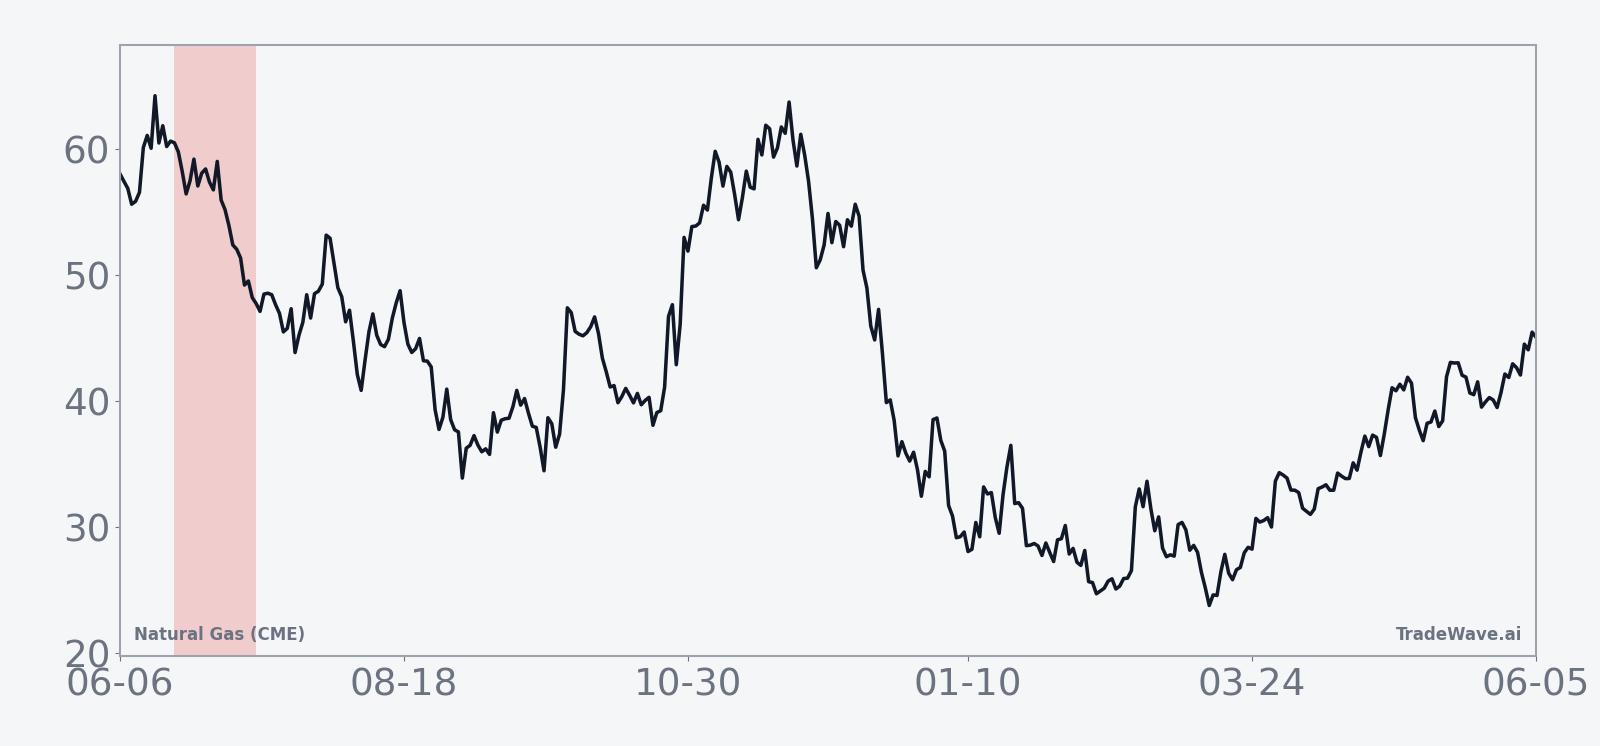
Natural Gas (CME) has delivered profitable short trades in all eight midterm election years since 1994 during the 22-day window that starts around Jun 20, with average gains of 8.1% for bears. Today the front-month contract trades at $3.142 per mmBtu, up 4.1% on the session and well off its 52-week high of $7.827, leaving it about 59.9% below last year’s peak.[6]
Grouping the data by the presidential election cycle matters here because midterm years often bring a different policy and macro mix for energy than election or pre-election years. Regulatory noise, budget debates and shifting expectations for industrial demand can all cluster in this phase, and the NG seasonal trend in this specific midterm slice has been consistently one-sided.
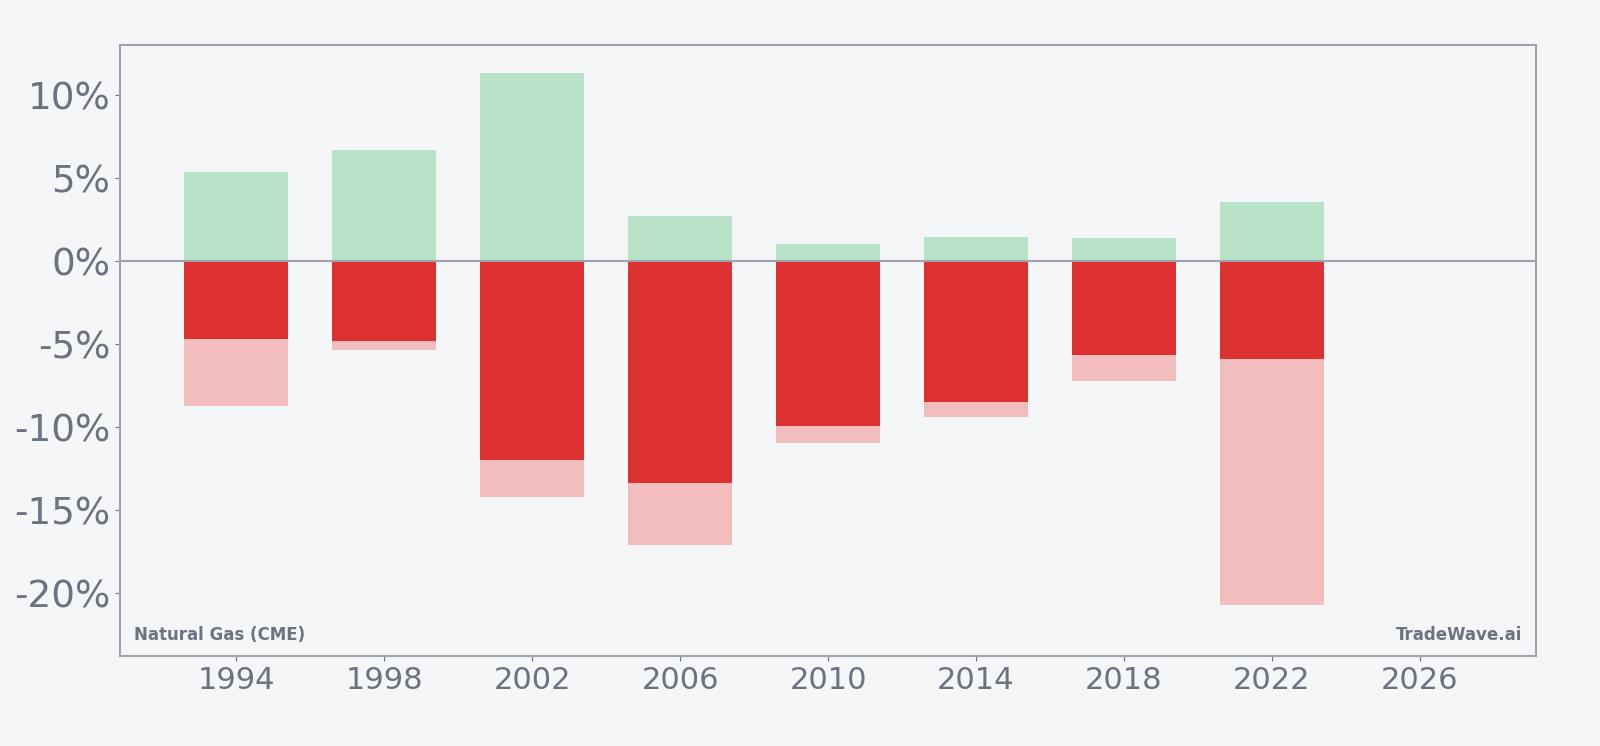
Across the eight midterm election years in the sample, every single iteration of this NG seasonal trend has ended with prices lower over the 22-day span, which is favorable for the short trade direction. The weakest year for natural gas bulls was 2006, when the contract fell 13.37% from entry to exit, while 2002 was close behind with a 12.0% slide. Even the “milder” years like 1994 and 2018 still saw declines of 4.7% and 5.67% respectively, keeping the pattern’s win rate at 100% for shorts.
The average winner gain of 8.1% lines up with a median profit of 7.18%, which suggests the distribution is not being driven by a single outlier collapse. Cumulative return across all eight windows totals 85%, and the annualized return of 8.06% reflects how concentrated these moves have been in a short calendar slice rather than across the full year. A Sharpe ratio of 2.33 on end-of-window outcomes is high for a commodity pattern, underscoring how consistently this particular NG seasonal window has leaned lower in midterm years.
Intraperiod swings have still been large. In 2022, for example, the best point-to-peak move in favor of shorts, or maximum favorable excursion, reached 3.53%, but the worst drawdown from entry, or maximum adverse excursion, stretched to 20.69% before the contract ultimately finished 5.87% lower. Earlier cycles like 2006 saw a similar profile, with a relatively small favorable run-up of 2.74% but a deep 17.1% adverse move at one point before the final 13.37% decline. That mix of strong final results and sometimes punishing countertrend spikes is a reminder that this has been a profitable but volatile window for bears.
Looking across the per-year table, the typical pattern shows NG often chopping or even squeezing higher early in the window before rolling over more decisively in the back half. Years like 2010 and 2014 saw only modest maximum favorable moves for shorts of around 1% while adverse excursions ran close to 10%, yet both still ended with 8% to 10% declines from entry to exit. The historical seasonal average curve for this Natural Gas (CME) trading window slopes steadily lower, but the path has rarely been smooth.
A stacked view of net returns with peak favorable and worst adverse moves shows how often shorts have been tested before finishing ahead.
History does not guarantee future results, and even in a window with a perfect win record for shorts, adverse excursions have at times been large before the final move unfolded.
Why does Natural Gas (CME) (NG) follow this seasonal pattern?
This NG seasonal trend likely reflects a mix of commodity supply and demand seasonality and the midterm-year policy backdrop. Late June often sits between peak spring storage injections and the heart of summer cooling demand, a shoulder period when inventories can build and weigh on prices if weather is not extreme. Analysts have also pointed to midyear budget and regulatory debates in Washington that can cloud industrial demand expectations in midterm election years, encouraging producers and traders to lean more defensively into this stretch.
What is driving Natural Gas (CME) (NG) today?
Front-month Natural Gas (CME) futures last traded at $3.142 per mmBtu, up 4.1% on the day and roughly 14.33% higher over the past month as prices rebound from a 52-week low of $2.561.[6] The move comes after contracts held near $3.012 on May 21 ahead of the latest U.S. storage report, with analysts expecting a 95 billion cubic feet injection compared with a five-year average of 92 billion cubic feet, and inventories sitting about 6.4% above average.[6] That combination of rising prices and a modest storage surplus keeps the focus squarely on weather forecasts and how quickly early-summer heat might chew through the cushion.
Natural gas remains highly sensitive to short-term temperature models and weekly storage data, which can swing expectations for both cooling demand and the pace of injections.[6] In late 2025, for example, futures pushed higher ahead of a delayed storage report even as milder weather limited heating demand, a reminder that positioning and timing around data releases can matter as much as the headline numbers themselves.[5] With the contract still far below last year’s highs, traders are weighing whether the current bounce is a simple mean reversion off depressed levels or the start of a more durable shift in the energy sector’s seasonal outlook.
The chart below situates the latest rally against the past year of trading and a 60-day seasonal projection.
What should traders watch as the mid-June NG window approaches?
With less than a month until the Jun 20 start of this 22-day Natural Gas (CME) trading window, the key question is whether the current rebound will collide with the historically bearish midterm-year pattern or simply fade into it. The historical seasonality shows that even in years with strong short-side outcomes, NG has often squeezed higher early in the window before rolling over, so how price behaves into late June will matter as much as the level itself. A push toward or above the 50-day moving average near $2.85 has already occurred, and any test of higher resistance zones into the window would echo prior years where shorts were forced to sit through sharp but temporary rallies.
On the macro side, weekly U.S. storage reports and updated summer weather forecasts will be the main catalysts to watch.[6] If injections continue to run near or above the five-year average while inventories stay roughly 6.4% above normal, that would align with prior midterm cycles where comfortable storage and non-extreme weather coincided with softer prices into early summer. A surprise heat wave or a string of below-consensus injections, by contrast, could blunt or even overwhelm the historical pattern, especially given how far NG has already fallen from last year’s highs.
For traders who track seasonality, the tell will be whether NG starts to stall or reverse lower as the calendar flips into the Jun 20 to mid-July band that has produced eight straight profitable short windows. A continuation of the current rally deep into that period would mark a clear departure from the historical NG seasonal trend, while a choppy, squeeze-prone but ultimately lower path would fit the script from 1994 through 2022. Add it up: the calendar is about to move into a part of the year that has quietly punished natural gas bulls in every midterm election cycle in the dataset.
Sources
- [5] The Wall Street Journal, “U.S. Natural Gas Futures Gain Ahead of Delayed Storage Data,” Dec 29, 2025.
- [6] The Wall Street Journal, “U.S. Natural Gas Futures Steady Ahead of Storage Data,” May 21, 2026.
About this seasonal analysis
Seasonal pattern data is sourced from TradeWave.ai, which analyzes historical price behavior across annual calendar windows going back up to 30 years. Read the full data methodology or the book The 100-Year Pattern by Afshin Moshrefi (2026 edition). Past performance of seasonal patterns does not guarantee future results. This article is for informational purposes only and does not constitute investment advice.