Natural Gas (CME) (NG) Has Fallen in 8 of 8 Midterm Summers, Shorts Averaged 7.92% Profit
Natural Gas (CME) is heading toward a midterm-year seasonal window that has consistently favored lower prices, just as the front-month contract trades only slightly above its recent lows.
What is the seasonal pattern for Natural Gas (CME) (NG)?
Natural Gas (CME) has fallen in 8 of 8 midterm-election-year windows starting around May 22, with an average 7.92% gain for short positions in winning years.
- 8 for 8 in this window, with short trades averaging 7.92% profit across the last eight midterm election years.
- The upcoming Natural Gas (CME) trading window starts on May 22 and runs for 111 trading days into late summer.
- Percent Profitable is 100%, with 8 winners and 0 losers for the short-side seasonal pattern.
- Average winner profit of 7.92% reflects a cumulative 83% gain for the strategy across the eight historical cycles.
- Intraperiod swings have been large, with some years showing adverse moves of more than 20% before the trend reasserted lower.
- The pattern clusters in midterm election years, when policy uncertainty and shifting demand often make natural gas especially volatile.
According to historical data from TradeWave.ai, this midterm-year stretch has behaved very differently from an average summer for natural gas, and the next iteration is less than a month away.
How has Natural Gas (CME) (NG) traded in past midterm-year summer windows?
Natural Gas (CME) has declined in every one of the last eight midterm-election-year windows starting around May 22, with short positions averaging 7.92% profit over the 111-day stretch. Today the front-month NG contract settled at 2.715, up 6.47% on the session, and sits about 65.3% below its 52-week high of 7.827 while hovering just 6.0% above the 52-week low of 2.561. That combination of a statistically strong bearish seasonal pattern and a contract trading near the bottom of its one-year range gives this upcoming window unusual weight for energy traders.
Because this pattern is grouped by the presidential election cycle, it only looks at midterm election years, when Washington is in mid-cycle and policy debates over spending, regulation and energy infrastructure often intensify. That focus strips out noise from election-year headline risk and post-election digestion, isolating how natural gas has behaved in the middle of the four-year political rhythm.
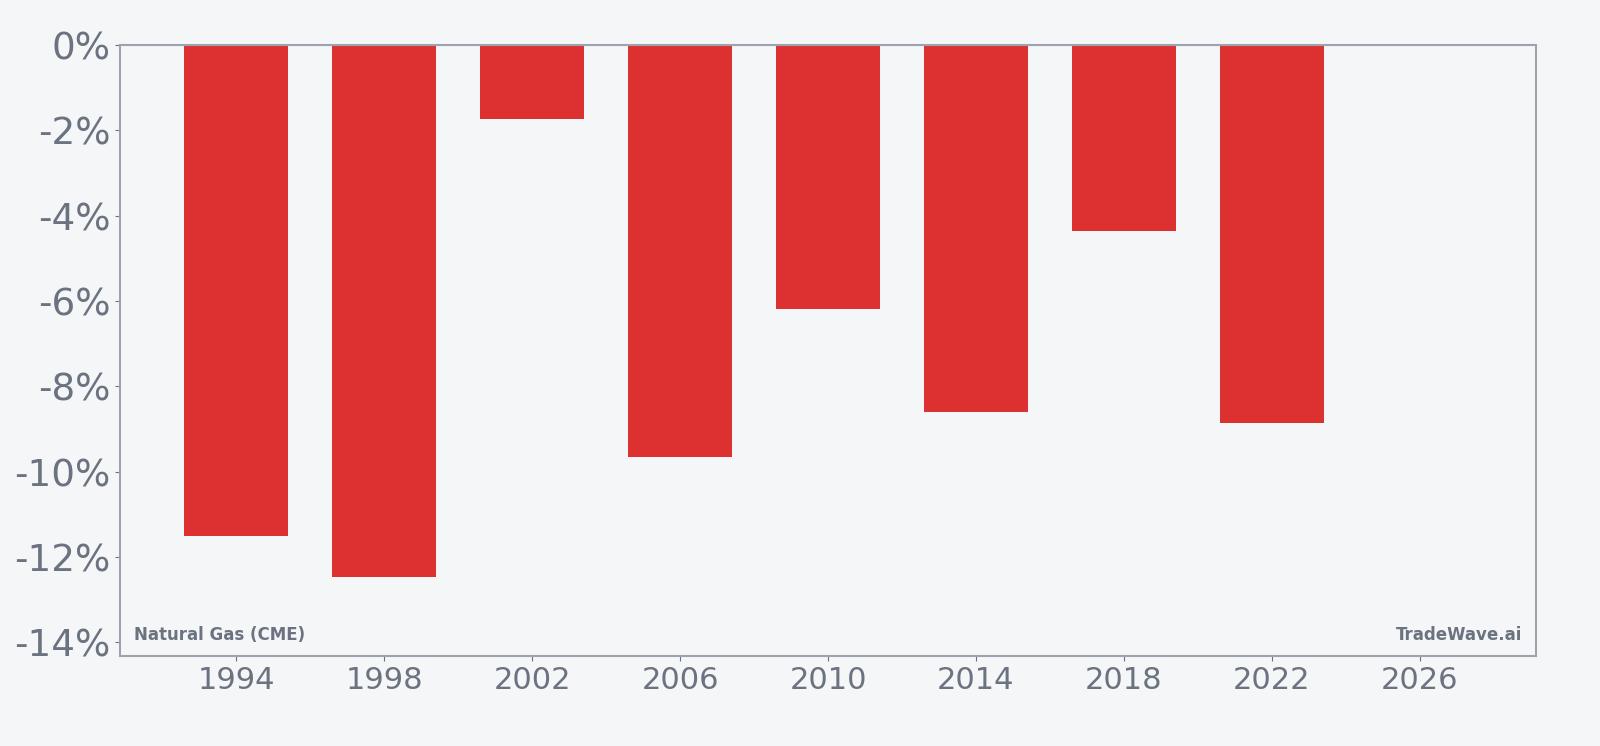
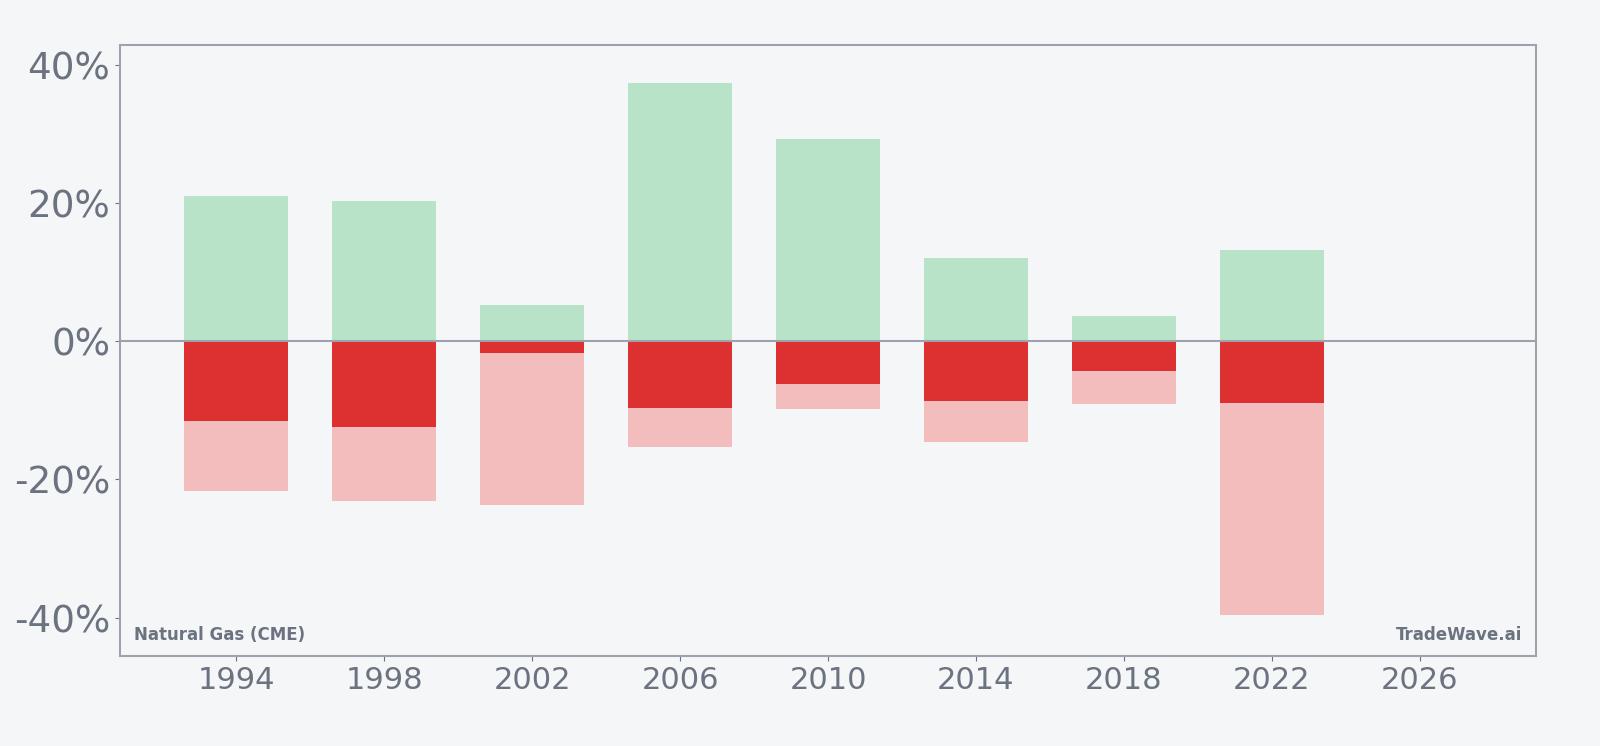
A second view shows how far prices have tended to travel in both favorable and adverse directions inside each of those years.
Across the eight midterm years in the sample, every window ended with NG lower than it started, which is favorable for the short-side seasonal strategy. Average profit for those shorts was 7.92%, with a cumulative gain of 83% across the full history. The strongest year for the pattern was 1998, when NG fell 12.46% over the window, while the softest outcome was 2002, when prices slipped just 1.73%.
The MFE/MAE profile shows how bumpy that ride has been. In 2006, for example, the best point-to-trough move in favor of shorts reached 37.33%, but the worst intraperiod drawdown against the position still hit 15.25%. In 2022, the window ultimately delivered an 8.87% profit for shorts, yet the worst adverse excursion was a sharp 39.69% spike higher before prices rolled over. That mix of large favorable and large adverse swings is exactly what the TradeWave Ratio of 1.86 is flagging: natural gas tends to travel a long way in the trade direction inside this window, but not in a straight line.
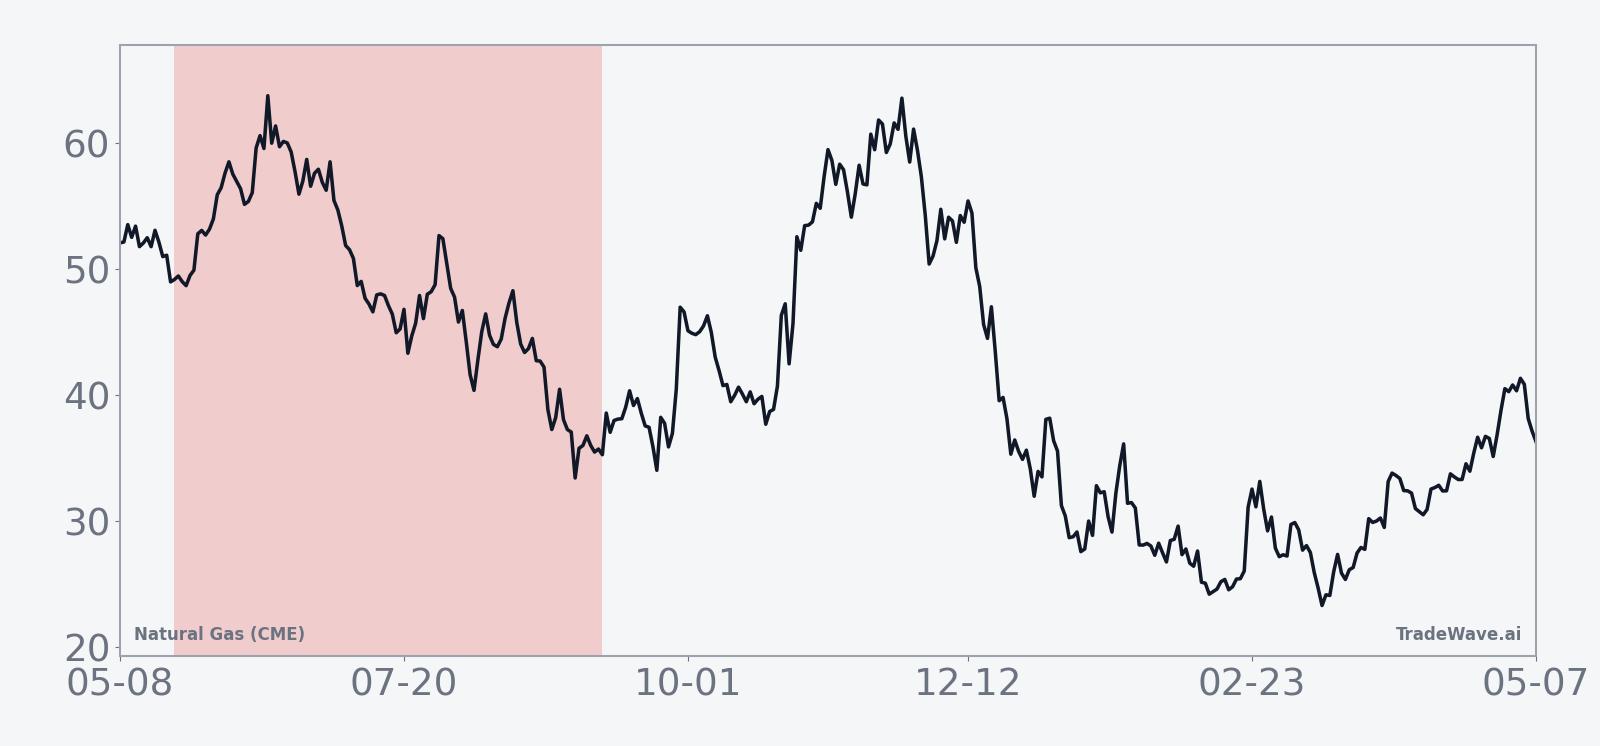
Looking at the per-year table, the pattern has been consistent across very different price regimes. In 1994, NG started the window at 1.851 and finished at 1.638, while in 2022 it began at 8.827 and ended at 8.044. Despite that fourfold difference in absolute price, the direction in this specific seasonal slice was the same. The trend chart suggests that weakness often builds gradually rather than collapsing all at once, with several years showing early choppiness before a more decisive drift lower into late summer.
The cumulative return chart for the window reinforces that message. When you stack the eight midterm years together, the line slopes steadily in favor of shorts, with only modest pauses. There are no losing years in the sample, and the standard deviation of 3.62% is relatively contained compared with the size of some individual excursions, which hints that the end-of-window outcomes have clustered more tightly than the intraday and intraweek swings might suggest.
History does not guarantee future results; adverse excursions can be large even in winning windows, and natural gas is notorious for sharp squeezes that can challenge any seasonal bias.
Why does Natural Gas (CME) (NG) follow this seasonal pattern?
One likely driver is commodity supply and demand seasonality, as this window runs from late May through the heart of the U.S. injection season when storage builds and weather demand can be uneven. Analysts have also pointed to midterm-year policy debates over energy, emissions and infrastructure that can weigh on sentiment for gas-linked assets even when spot demand looks firm. The pattern may reflect a blend of those fundamentals with positioning resets by utilities, producers and macro funds as they navigate both summer weather and the political calendar.
What is driving Natural Gas (CME) (NG) today?
Front-month Natural Gas (CME) futures closed at 2.715 on Apr 28, up 0.165 or 6.47% on the day, after trading between 2.712 and 2.733 on relatively light volume of 3,859 contracts. That bounce comes with NG still well below its 50-day moving average of 2.913 and after a 7.88% decline over the past month, leaving the contract closer to its 52-week low than its high as traders weigh shifting weather forecasts and storage expectations. Recent macro commentary has stressed how quickly sentiment can flip when forecasts swing from mild to bitter cold or extreme heat, with weather-driven demand and storage withdrawals repeatedly whipsawing prices in late 2025 and early 2026.[3]
The chart below situates the latest move in its recent multi-month context alongside a short-term seasonal projection.
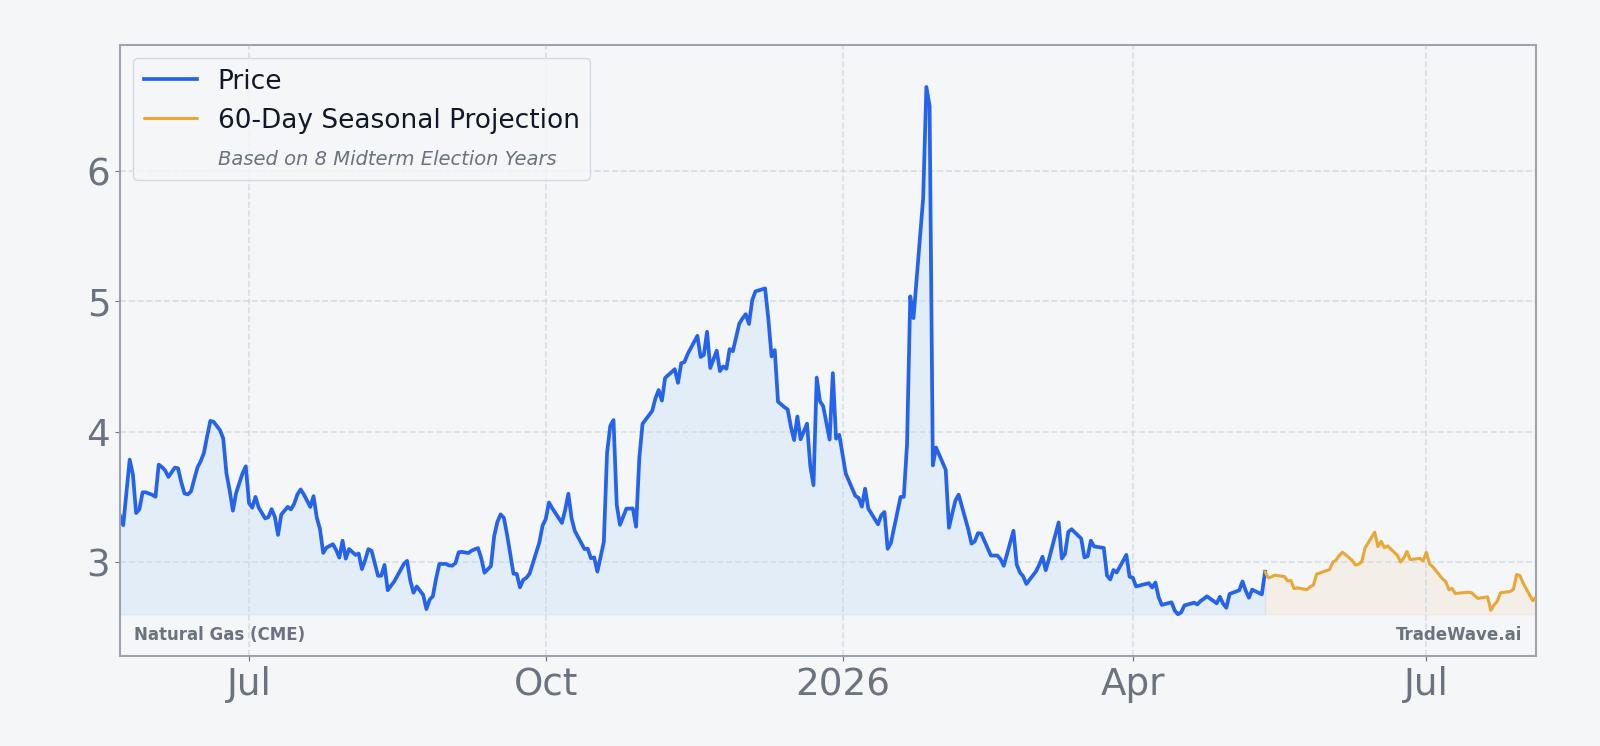
In July 2025, U.S. natural gas prices climbed on forecasts for mid-July heat that were expected to boost cooling demand and power-sector gas burn, a reminder of how quickly weather can tighten the market.[1] Later that year, several Wall Street reports highlighted how storage data and shifting temperature outlooks repeatedly flipped the tape between gains and losses as traders tried to gauge whether surpluses would erode into deficits.[2][4][5][8] By Feb 19, 2026, coverage described U.S. natural gas futures as slipping in choppy trade, with a cold spell briefly lifting demand but not yet breaking the broader rangebound feel.[7]
Those background episodes underline why the upcoming seasonal window matters. Natural gas is a systemically important commodity for power generation, heating and industrial demand, and its price swings ripple into inflation expectations, utility margins and even parts of the equity market. A window that has historically delivered consistent downside for NG in midterm years, starting just as the injection season ramps up, is a notable backdrop for anyone exposed to energy costs or trading the broader energy complex.
What should traders watch as this Natural Gas (CME) seasonal window approaches?
First, the calendar. The 111-day NG seasonal window tied to midterm election years begins on May 22, so positioning and volatility in the weeks just before that date can offer clues about whether this cycle will rhyme with history. If prices remain pinned near the lower end of the 2.50 to 3.00 band into the start of the window, the historical pattern suggests that rallies have often been sold rather than chased higher.
Second, watch the weather and storage tape. Prior midterm-year windows have played out against shifting forecasts for summer heat and evolving expectations for storage injections, with some of the largest adverse excursions for shorts occurring when surprise cold snaps or heat waves briefly overwhelmed the broader supply picture.[3] Weekly storage reports and updated temperature outlooks will be key tells for whether this year’s injection season follows the familiar script of early tightness followed by loosening, or something different.
Third, monitor how NG trades around its 50-day moving average and the 2.56 to 2.90 zone that has defined the recent floor and ceiling. A sustained break back above the 50-day average with strong volume would argue that this cycle may diverge from the historical midterm-year pattern, while repeated failures near that level would fit more cleanly with the past tendency for the contract to grind lower over the window.
Finally, keep an eye on cross-asset signals in energy equities and LNG-linked names. In prior episodes, sharp moves in natural gas have spilled into related stocks and credit, especially when storage surprises or weather shocks hit an already stretched positioning backdrop.[1][7] If volatility in NG starts to build as the May 22 window opens, the way those related markets respond will help confirm whether this is another year where the midterm-election seasonal pattern exerts its usual pull, or one where fundamentals and flows overpower the calendar.
Sources
- [1] Reuters, "US natgas prices gain over 2% on mid-July heat forecasts, more cooling demand," Jul 2, 2025.
- [2] The Wall Street Journal, "U.S. Natural Gas Picks Up Ahead of Storage Data," Dec 10, 2025.
- [3] MarketWatch, "Natural-gas prices soar as temperatures drop. It could be the toughest test for the markets in a decade.", Jan 20, 2026.
- [4] The Wall Street Journal, "U.S. Natural Gas Futures Gain Ahead of Delayed Storage Data," Dec 29, 2025.
- [5] The Wall Street Journal, "U.S. Natural Gas Futures Extend Decline," Dec 12, 2025.
- [7] The Wall Street Journal, "U.S. Natural Gas Futures Slip in Choppy Trade," Feb 19, 2026.
- [8] The Wall Street Journal, "U.S. Natural Gas Futures Post Daily Gain, Weekly Loss," Dec 19, 2025.
About this seasonal analysis
Seasonal pattern data is sourced from TradeWave.ai, which analyzes historical price behavior across annual calendar windows going back up to 30 years. Read the full data methodology or the book The 100-Year Pattern by Afshin Moshrefi (2026 edition). Past performance of seasonal patterns does not guarantee future results. This article is for informational purposes only and does not constitute investment advice.