This 5-Day Late-May Window Has Delivered 8.53% Average Short Profits in CBOE Volatility Index (VIX)
CBOE Volatility Index is approaching a five-day late-May seasonal window that has usually seen volatility fade, even as the gauge trades far below its 52-week high after a spring of geopolitical and inflation shocks.

What is the seasonal pattern for CBOE Volatility Index (VIX)?
CBOE Volatility Index has fallen in 8 of 10 years during this late-May five-day window, with an average 8.53% gain in winning years for the short-volatility trade.
- 8 wins and 2 losses in this window over the past decade, with the short-volatility side averaging 8.53% gains in winning years.
- Percent Profitable stands at 80%, meaning 8 winners and 2 losers for traders positioned short VIX during this five-day stretch from May 30.
- Including all years, the average outcome for the pattern is a 6% move in favor of the short-volatility direction.
- Average loss in the two losing years is -4.9%, showing that when the pattern fails, the squeeze has been manageable but noticeable.
- The TradeWave Ratio of 1.48 signals that VIX has typically traveled meaningfully in the trade direction inside the window, even when the final close was less dramatic.
- Intraperiod swings have featured sizable best-case and worst-case excursions, so traders have historically faced real drawdowns even in years that ultimately worked.
According to historical data from TradeWave.ai, this late-May stretch has behaved differently from an average week for volatility, and the next iteration is about to open again.
Seasonal window
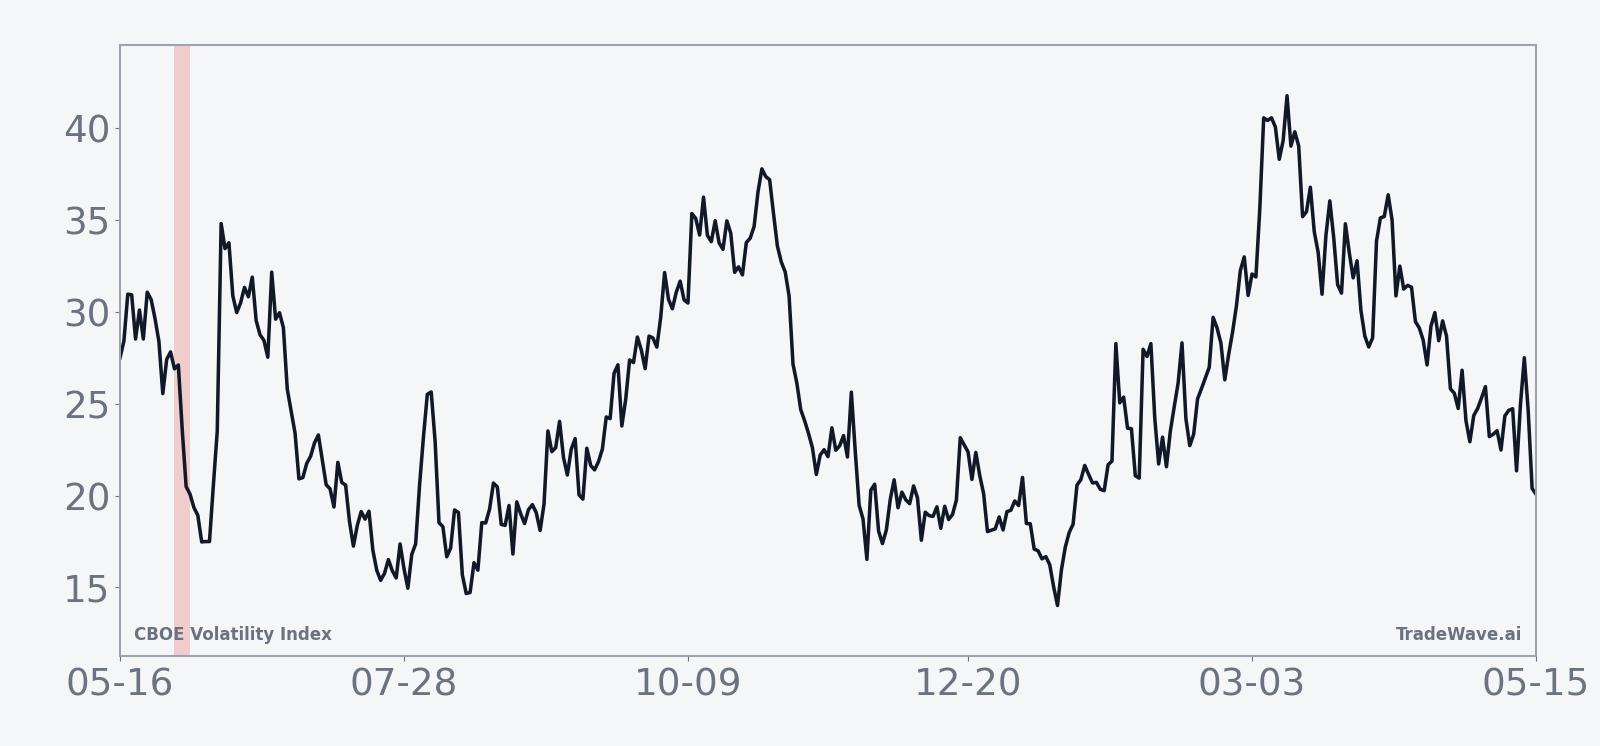
CBOE Volatility Index has moved lower in 8 of the past 10 late-May five-day windows, with the short-volatility side averaging 8.53% gains when the pattern works. Today VIX closed at 16.29, down 4.23% on the session and sitting about 53.9% below its 52-week high of 35.3 while still roughly 21.8% above its 52-week low of 13.38. That combination of a historically soft window for implied volatility and a spot level parked in the mid-teens gives equity traders a clear calendar marker for when hedging costs have often eased.
Trade direction for this setup is explicitly short, which means the historical “wins” are years when VIX finished the window lower than it started. Across the decade, the all-years average move in favor of that short-volatility stance is 6%, while the average loss in the two losing years is -4.9%, reflecting squeezes that were uncomfortable but not catastrophic. The 0.8 Sharpe ratio, based on end-of-window outcomes, points to a reasonably consistent pattern rather than a single outlier year doing all the work.
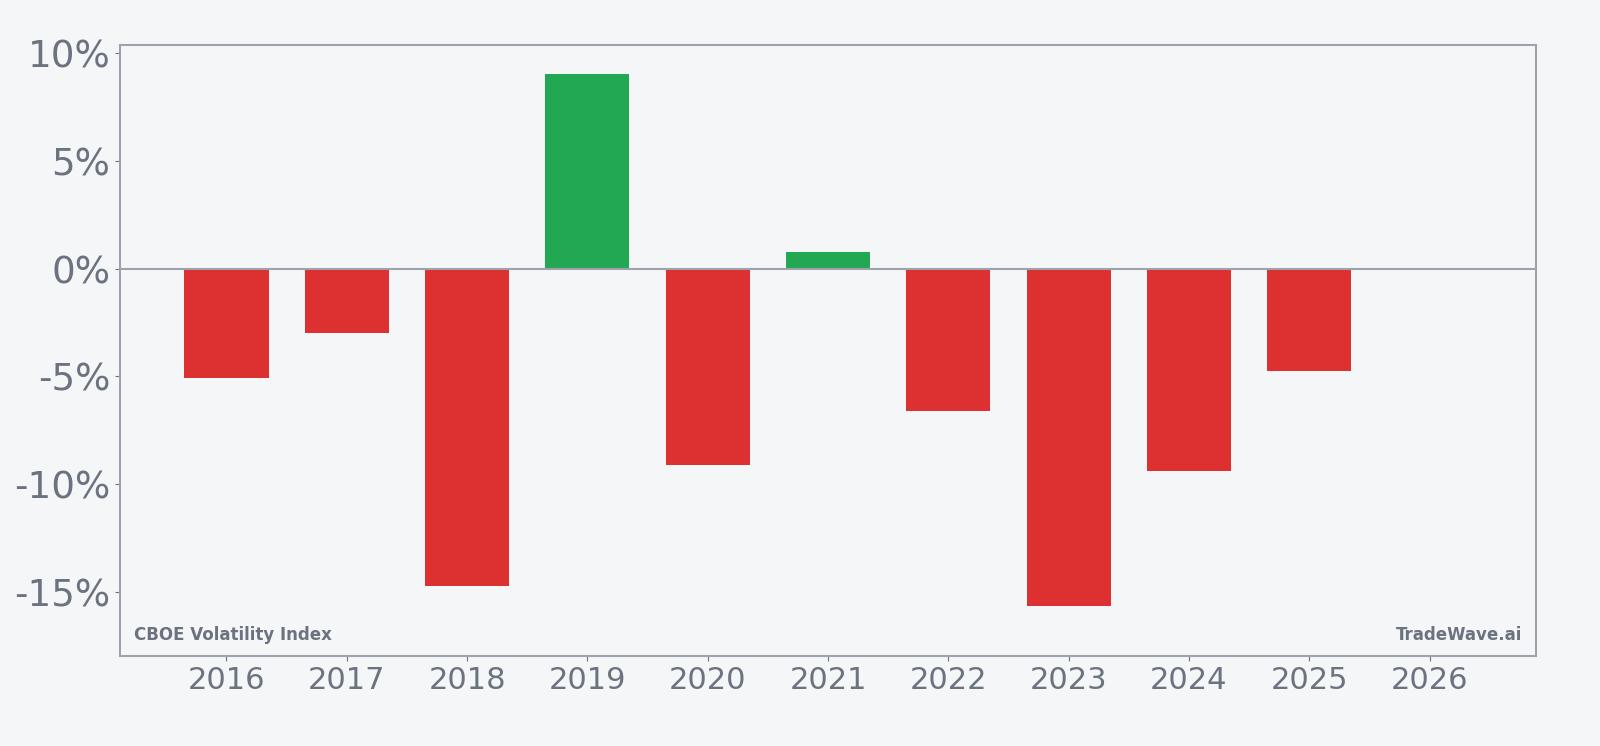
Looking at individual years, 2018 and 2023 stand out as some of the strongest stretches for the short side, with net moves of -14.73% and -15.64% in VIX respectively over the five days. On the other side of the ledger, 2019 delivered a 9.02% rise in VIX and 2021 was marginally higher by 0.78%, reminding traders that even a strong historical seasonality can flip when macro shocks hit. In most years, though, the pattern has leaned toward implied volatility bleeding lower into early June.
The historical seasonal average shows VIX typically drifting lower fairly steadily across the five sessions, rather than spiking early and reversing. That profile fits with a market where earlier stress has already been priced and equity indices grind higher while hedges decay. The cumulative return curve for the pattern climbs over the decade, reflecting a 72% cumulative gain for the short-volatility side across all ten iterations.
Year-by-year bars with intraperiod swings show how often VIX has offered both tradable spikes and meaningful fades inside this window.
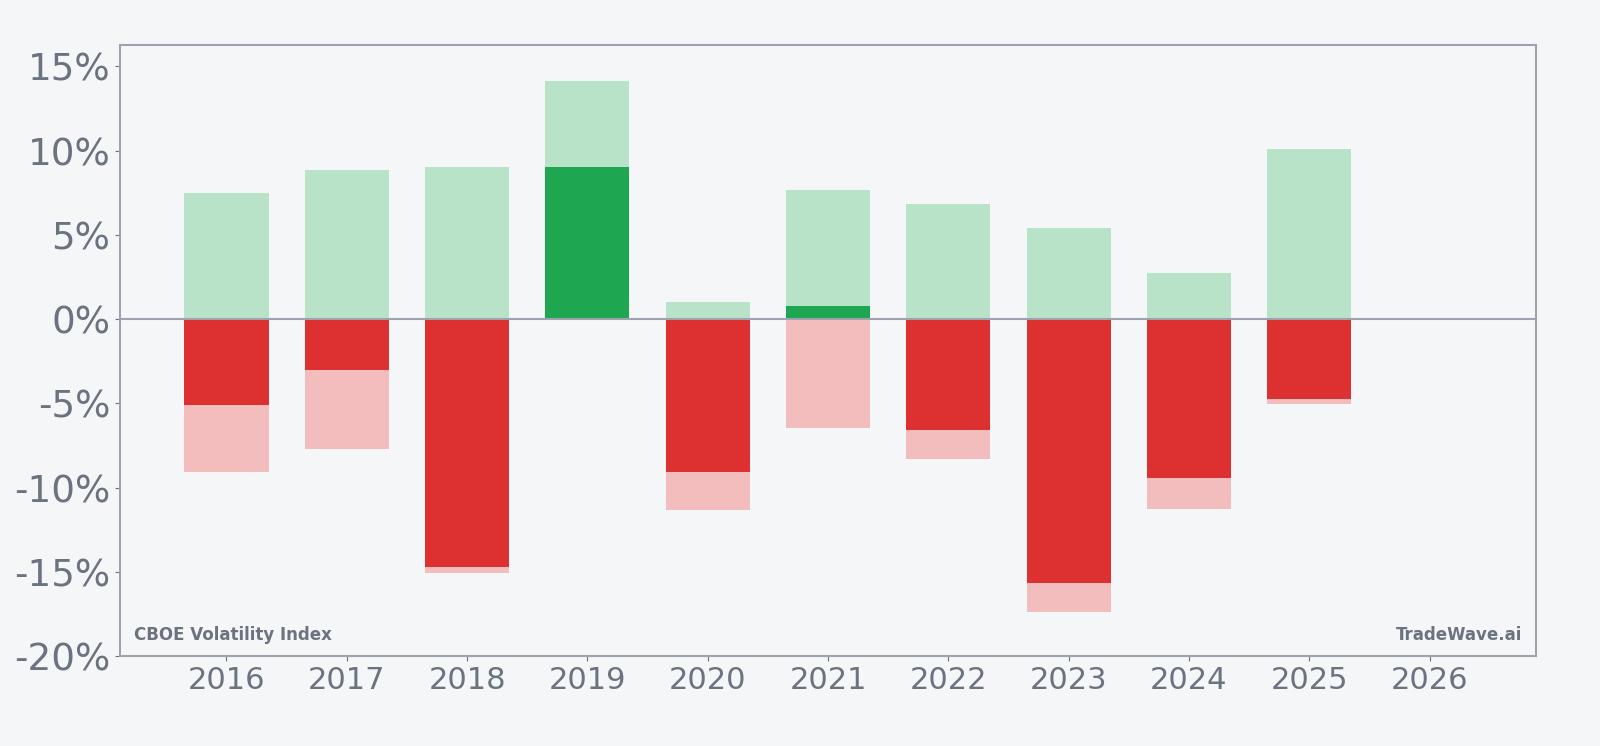
The combination of net returns with peak favorable and worst adverse moves shows that even in winning years, VIX has often staged sharp intraperiod spikes before fading. In 2018, for example, the best point-to-peak move was a 9.04% rise before the index ultimately finished 14.73% lower, while the worst drawdown from entry reached -15.06%. That mix of sizable best-case and worst-case excursions is typical across the sample, underscoring that this has been a high-variance but directionally consistent window for traders leaning short volatility.
History does not guarantee future results; adverse excursions can be large even in winning windows, and traders using this pattern have historically faced meaningful drawdowns inside the five-day stretch.
Why does CBOE Volatility Index (VIX) follow this seasonal pattern?
This late-May VIX seasonal trend may reflect a lull between major macro catalysts, as earnings season winds down and key policy meetings or data releases cluster later in the quarter. Analysts have also pointed to options expiration patterns and institutional portfolio rebalancing that can reduce demand for near-dated index hedges around this time. When equity markets are calm and well-supported, implied volatility has tended to compress, and this window often captures that bleed.
What is driving CBOE Volatility Index (VIX) today?
CBOE Volatility Index slipped 4.23% to 16.29 on Thursday, extending a roughly 13.4% decline over the past month and leaving the gauge well below its 52-week high of 35.3 but still above the 13.38 low. The move comes after a spring marked by episodic spikes, including a jump to 23.42 on Mar 18 amid Middle East conflict and hotter producer inflation data that briefly jolted hedging demand.[1] More recently, VIX briefly popped to 19.01 on May 13 during whipsaw index action, even as traders highlighted a disconnect between relatively muted index volatility and far higher implied volatility in single-stock and sector pockets such as semiconductors.[2]
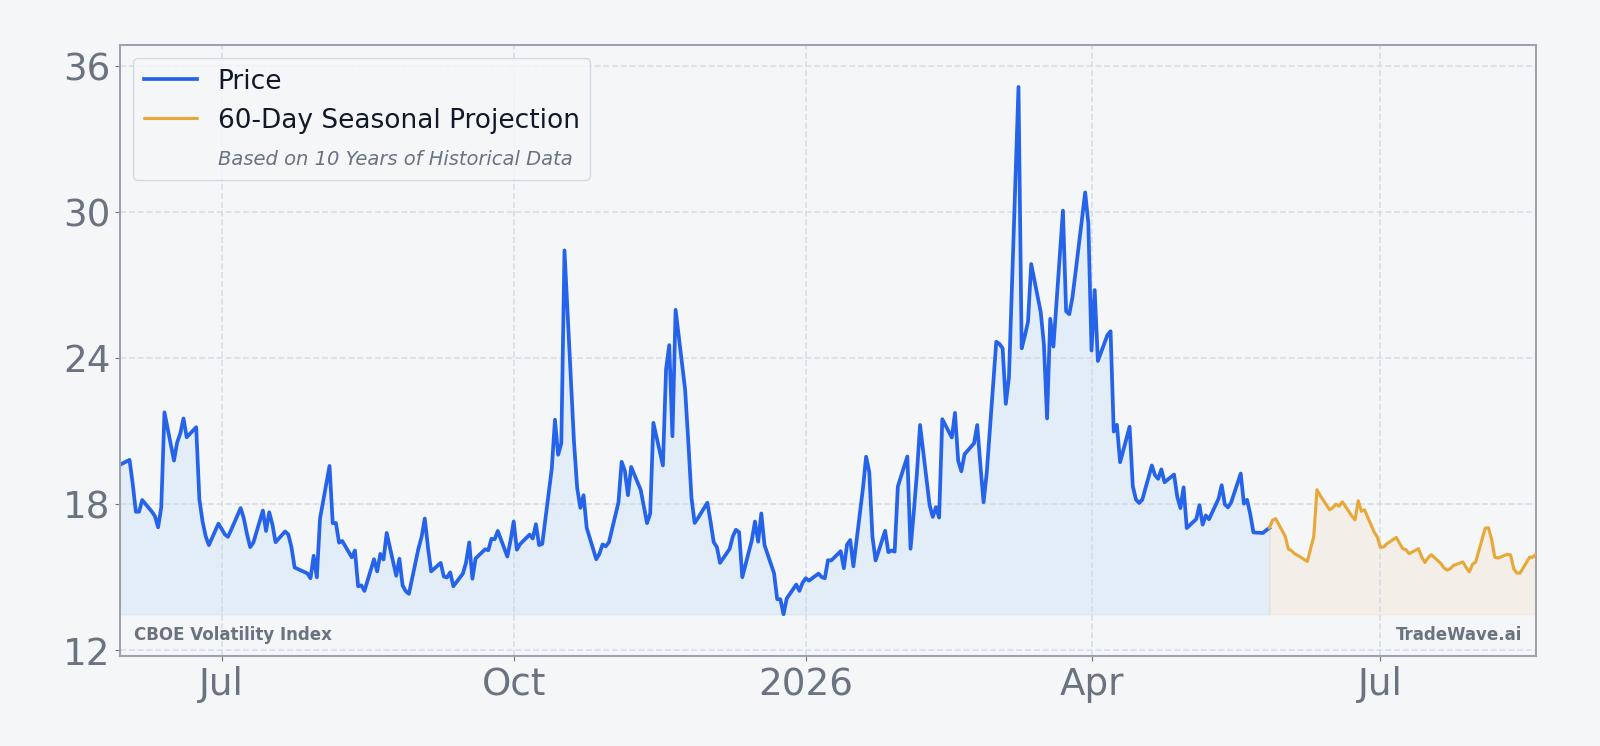
The chart below situates the latest pullback in VIX within its past year of trading and a 60-day seasonal projection.
Macro drivers behind these swings have ranged from geopolitical risk to policy uncertainty. In Jan 2026, strategists framed VIX in the 15–16 zone as a reasonable hedge floor as investors grappled with policy unpredictability and the risk of sudden shocks.[3] Earlier episodes, such as the 2025 flare-up in U.S.-China trade tensions and confusion around potential changes at the Federal Reserve, also pushed VIX to multi-week or multi-month highs as investors scrambled for protection.[4][5] At the same time, market-structure commentary has stressed that low index-level volatility can mask intense dispersion under the surface, with sector ETFs like semiconductors trading with implied volatility near 46 while VIX sits in the mid-teens.[2]
That backdrop matters for this late-May seasonal pattern because it shows how quickly the volatility regime can change. When macro risk is front and center, VIX can ignore its usual calendar tendencies and spike regardless of season. When those shocks fade and equity indices grind higher, implied volatility has often reverted lower, and this specific five-day window has historically been one of the more reliable spots for that bleed to show up.
What should traders watch in this late-May VIX window?
For the upcoming five-day stretch starting May 30, the key watchpoints are simple. First, monitor whether VIX can stay anchored in the mid-teens or drift toward the 50-day moving average near 20.29, a level that has often marked the boundary between routine chop and more durable stress. Second, keep an eye on macro headlines around geopolitical risk and inflation data, which have been the main triggers for volatility spikes over the past year.[1][2]
Third, watch the gap between index volatility and single-stock or sector implied volatility. If VIX remains subdued while pockets like semiconductors continue to price in much higher risk, that would be consistent with the historical pattern of index volatility compressing into this window even as traders hedge idiosyncratic stories.[2] Finally, behavior inside the window itself will be telling: a steady grind lower in VIX would line up with the 8-for-10 historical record for the short side, while a fast break above recent highs would signal that macro forces are overpowering the usual seasonal script.
Sources
- Middle East conflict and producer inflation data drive VIX spike to 23.42 on Mar 18, 2026
- VIX briefly pops to 19.01 on May 13, 2026 amid whipsaw market action and sector volatility divergence
- Analysts discuss VIX near 15–16 as hedge floor amid policy unpredictability on Jan 13, 2026
- VIX hits more than three-week high after confusion over potential Fed Chair Powell removal on Jul 16, 2025
- VIX rises to highest level in nearly six months on renewed U.S.-China trade tensions on Oct 20, 2025
- VIX spikes to near five-month high on U.S.-China trade fears on Oct 14, 2025
- VIX surges as revived U.S.-China tensions and bank credit concerns raise anxiety on Oct 17, 2025
About this seasonal analysis
Seasonal pattern data is sourced from TradeWave.ai, which analyzes historical price behavior across annual calendar windows going back up to 30 years. Read the full data methodology or the book The 100-Year Pattern by Afshin Moshrefi (2026 edition). Past performance of seasonal patterns does not guarantee future results. This article is for informational purposes only and does not constitute investment advice.