Lean Hogs (HE) Has Rallied in All 10 Spring Windows Since 2016 as New Run Begins
Lean Hogs is stepping into a 57-day spring stretch that has delivered gains every year for a decade, just as prices trade in the upper half of their 52-week range.
Key takeaways
- Lean Hogs has finished higher in this 57-day spring window in all 10 years since 2016, with 10 winners and 0 losers.
- The pattern, which begins on Mar 18 and runs into mid-May, has produced an average gain of 9.68% across those winning years.
- The trade direction is long, with a TradeWave Ratio of 1.89 and a Sharpe ratio of 1.4, pointing to historically strong risk-adjusted upside.
- Intraperiod swings have been large in some years, with adverse moves exceeding 20% even when the contract ultimately finished the window higher.
- Recent prices sit between the 52-week low of 77.35 and high of 113.7, leaving room on both sides if volatility picks up into the seasonal window.
According to historical data from TradeWave.ai, this spring stretch in Lean Hogs has behaved very differently from an average month on the calendar, and the next iteration starts today.
Seasonal window
Lean Hogs has risen in 10 of 10 years during this 57-day spring window since 2016, averaging 9.68% gains for long positions. The new window begins on Mar 18 with front-month futures trading between a 52-week low of 77.35 and a high of 113.7, leaving the contract in the upper half of its one-year range. Add it up: a decade of uninterrupted spring gains and a still-open band between recent prices and last year’s peak give this window unusual weight for hog traders.
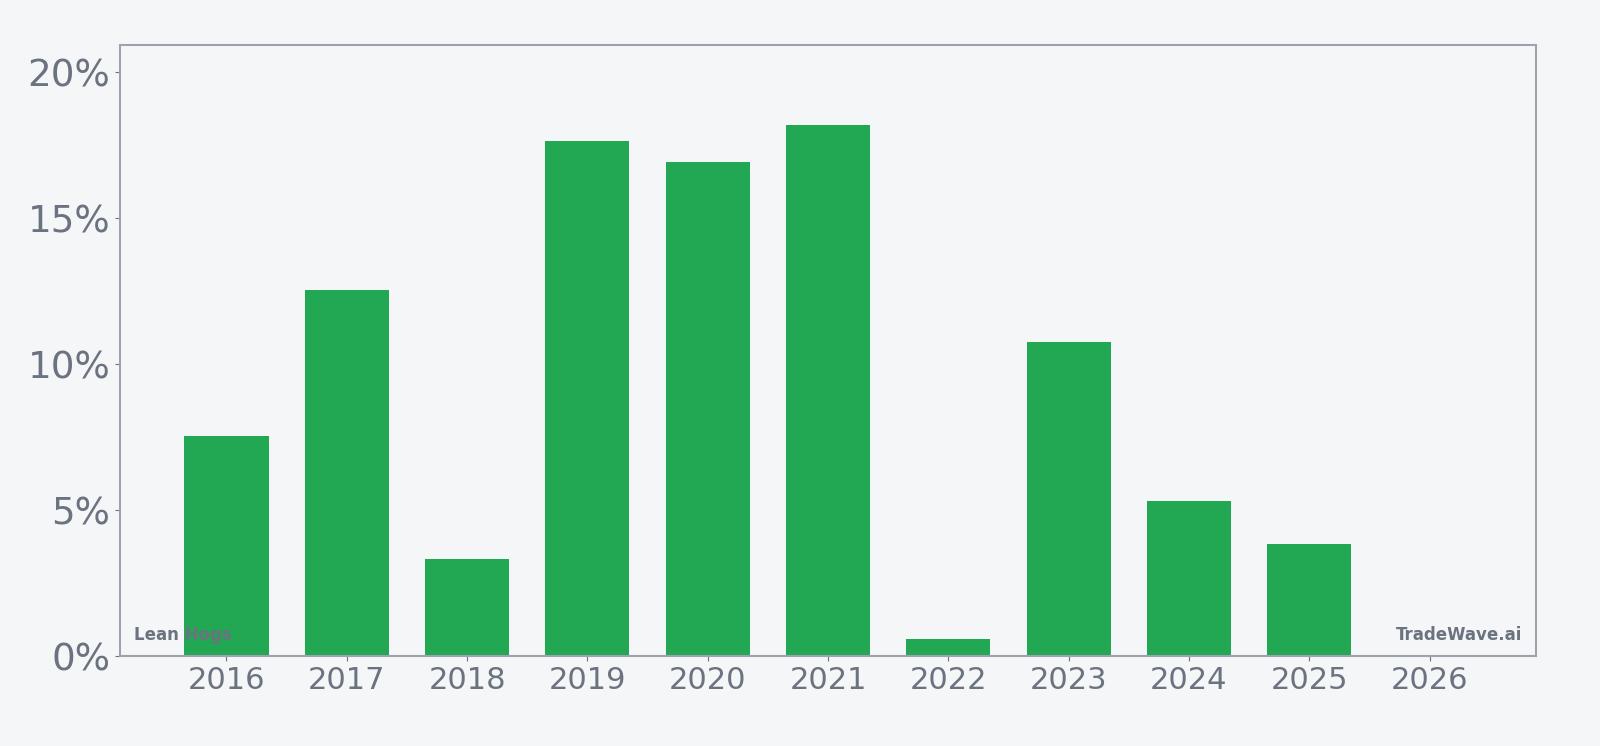
Across the 10-year sample, the long bias is clear. Percent Profitable sits at 100%, with 10 winners and 0 losers, and the average gain of 9.68% per window lines up with a 147% cumulative return and a 9.5% annualized pace. Median profit of 9.16% shows that the typical year has not been an outlier-driven fluke, and a Sharpe ratio of 1.4 indicates that these returns have come with comparatively favorable risk-adjusted characteristics for a commodity contract.
The per-year breakdown shows how that consistency has played out. The strongest year in the sample was 2021, when the window delivered an 18.21% net gain from an entry near 94.30 to an exit above 111, while 2019 and 2020 also posted double-digit returns of 17.63% and 16.94% respectively. Even the softest years, such as 2018 at 3.33% and 2022 at 0.6%, still finished in positive territory, which is unusual for a livestock contract that often trades on weather, feed costs and disease headlines.
The 10-year seasonal trend chart points to a pattern where gains tend to build through the middle of the window rather than in a single burst. The average path shows Lean Hogs often starting the period with a modest consolidation, then accelerating higher into the second half of the 57 days before flattening out toward the end. That shape fits a story of demand and slaughter dynamics tightening as grilling season approaches and producers adjust marketing weights.
Yearly net and peak moves highlight upside persistence amid typical drawdowns.
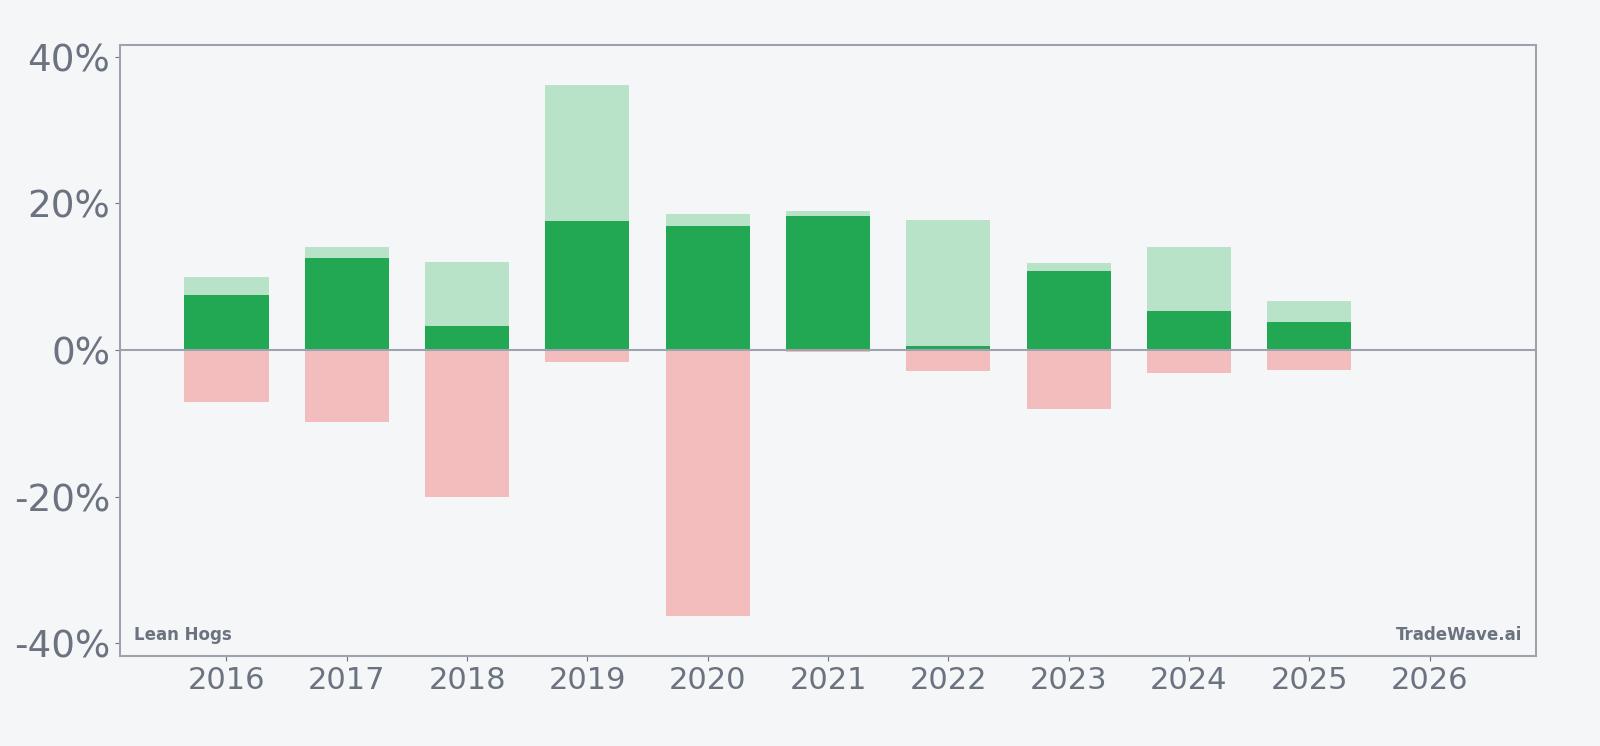
The net-with-excursions bar chart underlines how bumpy the ride can be inside this otherwise friendly window. Maximum favorable moves have been large, with years like 2019 showing a 36.21% peak run-up and 2020 reaching 18.57%, but maximum adverse moves have also bitten hard at times, including a 36.37% drawdown in 2020 and a 20.06% dip in 2018 before prices recovered. In plain English, the pattern has rewarded longs over the full 57 days, yet the path has often included double-digit swings in both directions.
History does not guarantee future results; adverse excursions can be large even in winning windows, and traders need to respect the potential for sharp drawdowns inside this seasonal stretch.
Price and near-term drivers
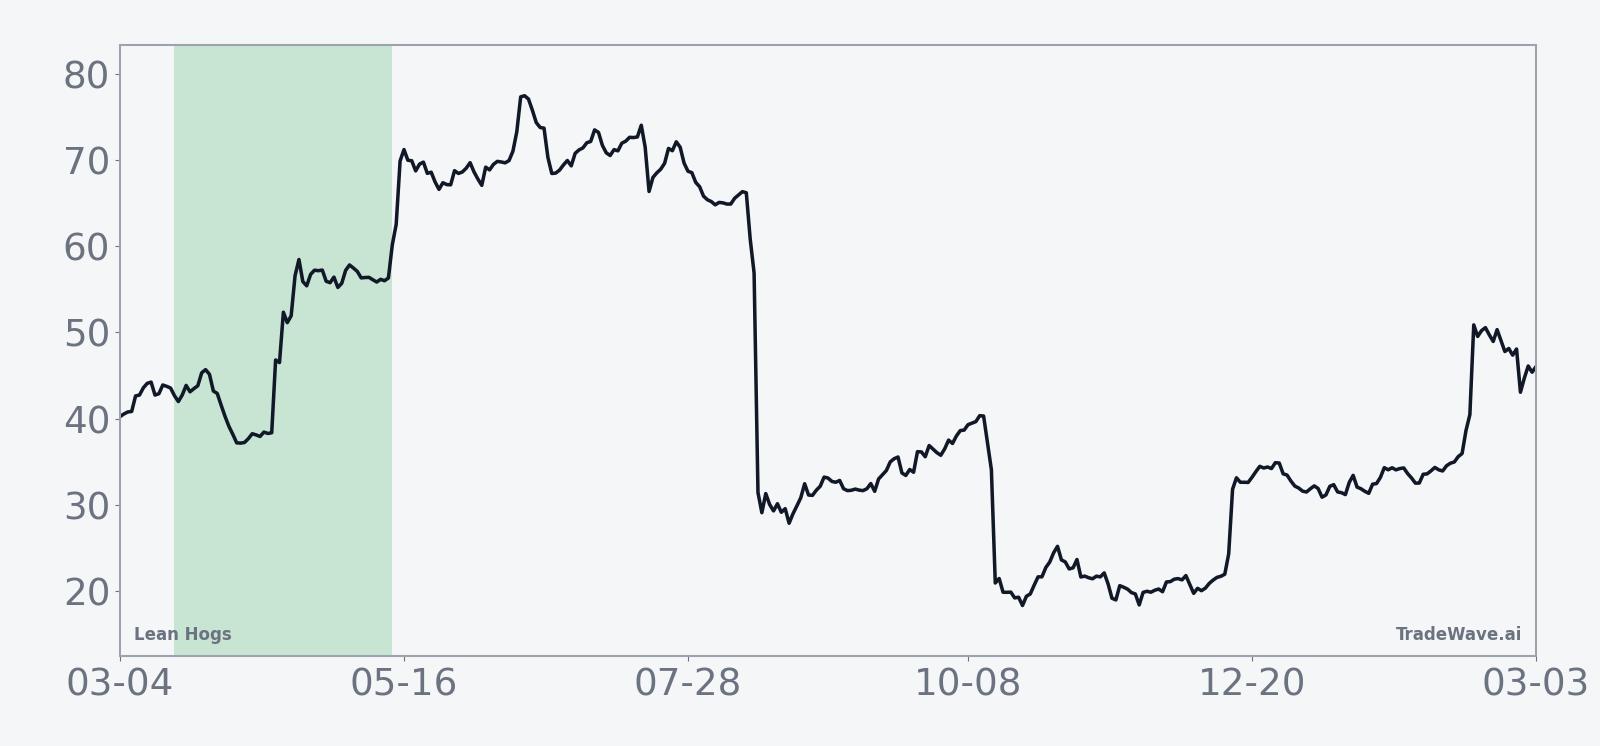
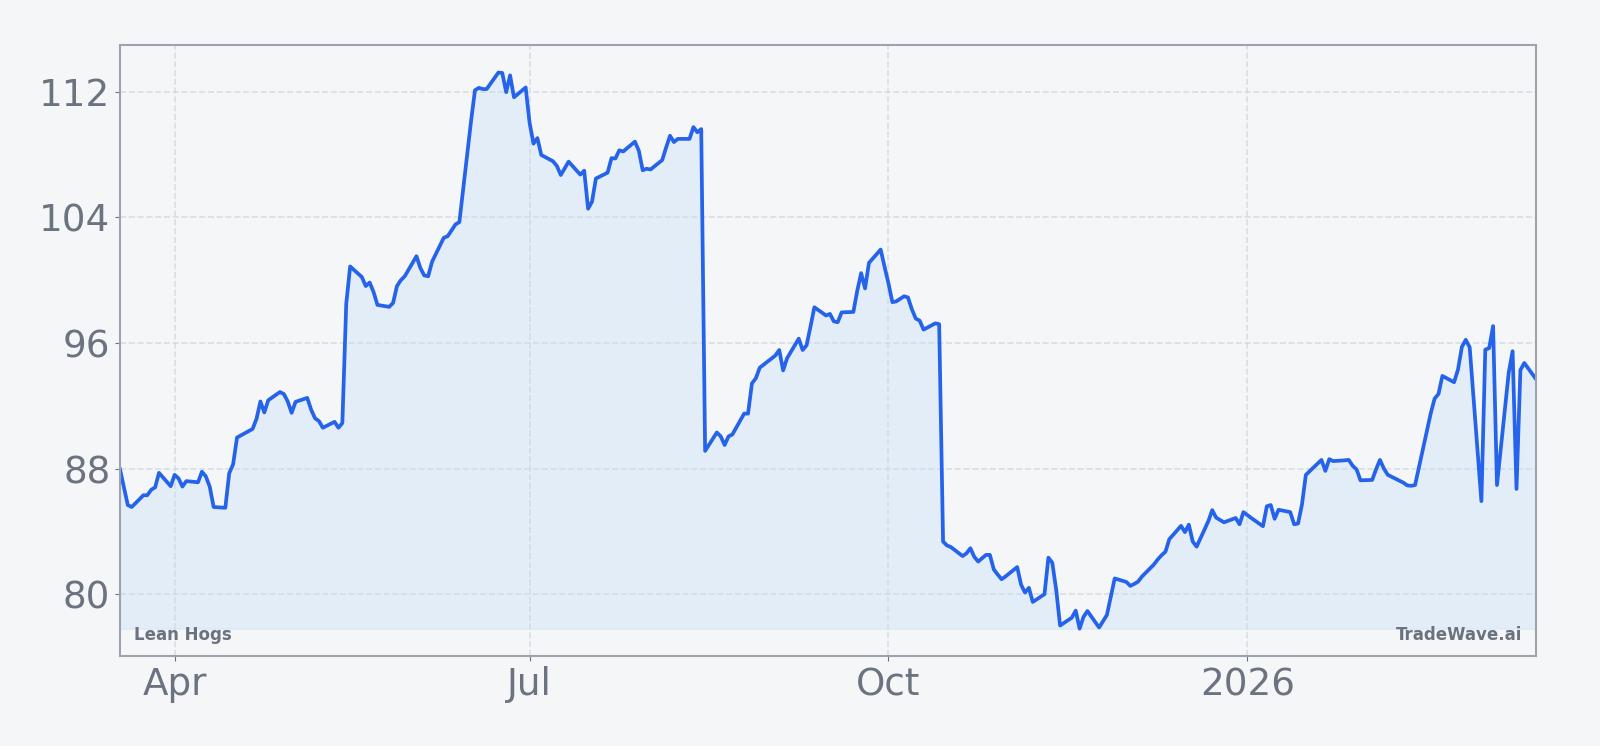
Front-month Lean Hogs futures are trading above the 50-day moving average of 89.921, with the contract up 7.53% over the past month and oscillating between a 52-week low of 77.35 and a high of 113.7. That puts prices in a recovery phase after last year’s pullback, but still well below the prior peak, leaving room for both seasonal follow-through and macro-driven reversals.
On the macro side, hogs sit at the intersection of protein demand, feed costs and the broader inflation story. When grain prices rise, producers often pull back on herd expansion, which can tighten supplies later in the year, while strong consumer demand for pork into grilling season can amplify that effect. At the same time, a firm dollar or softer global growth can weigh on export flows, which remain a key outlet for U.S. pork. With no single dominant macro headline in play, the contract is entering this window with a relatively clean slate and a price level that does not look stretched in either direction.
The chart below situates the latest move in its recent multi-month context.
Supply, demand and logistics backdrop
Behind the seasonal pattern sits a familiar supply and demand rhythm. Spring often marks a transition period in hog markets, as producers move past winter weather risks and look ahead to summer grilling demand. Slaughter numbers and carcass weights can shift quickly in this shoulder season, tightening or loosening supplies just as retailers and packers position for higher warm-weather consumption.
On the demand side, domestic consumption typically firms into late spring, while export flows can add another layer of volatility. Trade policy, currency moves and health headlines in key importing regions can all swing weekly shipment data, which in turn feeds back into packer margins and cash hog bids. When exports are strong, futures have historically been more willing to reward the seasonal long bias; when exports wobble, the same seasonal window can still finish higher but with deeper intraperiod drawdowns.
Logistics and cold storage trends also matter. If freezer stocks are already elevated heading into this window, packers may be slower to chase cash hogs higher even as demand improves, muting the futures response. Conversely, tighter inventories can force a faster adjustment in wholesale prices and futures when demand surprises to the upside. Weather can play a role too, both through its impact on feedlot conditions and through consumer behavior if an early or late start to grilling season shifts demand timing.
Positioning and risk appetite
While detailed positioning data for this specific analysis is limited, Lean Hogs typically sees a mix of commercial hedging and speculative trend-following around seasonal inflection points. Producers and packers often use spring rallies to layer in hedges, while managed money accounts tend to respond to breakouts or reversals in price momentum.
In a window with a 10-for-10 track record of positive closes, the key question for positioning is not whether longs have historically made money by the end, but how much pain they have had to sit through along the way. Years like 2018 and 2020, which combined strong net gains with maximum adverse moves of 20.06% and 36.37% respectively, suggest that leverage and stop placement have been critical. Traders who chased the seasonal pattern without room for volatility risked being shaken out before the historical upside played out.
For commercial players, the pattern offers a different lens. A window that has repeatedly delivered higher prices by mid-May can be a useful backdrop for timing forward sales or hedges, especially when cash markets and basis levels line up with the futures curve. The challenge is balancing that historical tendency against real-time signals from slaughter data, export bookings and feed costs, which can all override the seasonal script in any given year.
What to watch in this window
First, watch how Lean Hogs behaves relative to the 50-day moving average of 89.921 and the broader 77.35 to 113.7 one-year range. A sustained push above recent highs early in the window would be consistent with the historical pattern of mid-window strength, while a break back toward the lower half of the range would signal that macro or fundamental forces are overpowering the seasonal tailwind.
Second, track weekly slaughter, carcass weights and cold storage data for signs that supplies are tightening into summer demand. A combination of firm domestic consumption, steady exports and manageable freezer stocks has historically aligned with the stronger years in this pattern, while any surprise build in inventories could set up a choppier path with larger adverse excursions even if the window ultimately finishes higher.
Third, keep an eye on volatility inside the window, not just the end result. The history of maximum favorable and adverse moves shows that double-digit swings have been common, including drawdowns of more than 20% in some years before prices recovered. If this year’s window starts to mirror those deeper intraperiod dips, traders may need to decide whether that volatility represents an opportunity within a still-positive seasonal backdrop or a sign that the pattern is breaking down.
Finally, monitor how speculative and commercial flows respond to any breakout or breakdown. A rally that coincides with rising open interest and evidence of fresh long participation would look more like the stronger historical years, while a hesitant move on light volume could leave the contract vulnerable to a sharp reversal. The 10-for-10 record gives this window a rare level of historical consistency, but the next 57 days will show whether Lean Hogs can extend that streak or whether fundamentals will write a different script.