Corn (CME) (ZC) Springs Toward Range Highs as 47-Day Midterm Rally Window Opens
Corn (CME) futures are pushing toward the top of their 12‑month range just as a historically bullish 47‑day midterm-year window opens this week.
Key takeaways
- A 47‑day seasonal window for Corn (CME) tied to midterm election years starts on Mar 25 and has historically favored long positions.
- Across the last 6 midterm election years, the pattern shows 83% Percent Profitable with 5 winners and 1 loser.
- Winning years have averaged 3.62% gains, while including all years brings Avg Profit - All to 3%, pointing to a steady upside bias.
- Intraperiod swings have been meaningful, with some years showing sharp maximum adverse moves even when the final result was positive.
- Front-month corn is up 1.2% today at 471.25, sitting about 4.0% below its 52‑week high of 490.75 as planting and acreage headlines shape expectations.[1]
- Traders will be watching whether this historically strong midterm-year stretch aligns with current talk of a potential agriculture commodity rally.
According to historical data from TradeWave.ai, this late‑March window in midterm election years has behaved very differently from an average month on the corn calendar, and the next iteration is about to begin.
Seasonal window
Corn (CME) has risen in 5 of the last 6 midterm election years during this 47‑day window, averaging 3.62% gains in the winning seasons. The next window begins on Mar 25, with futures trading at 471.25 today, about 4.0% below the 52‑week high of 490.75 and well above the 52‑week low of 368.75.[1]
This pattern groups only the last six midterm election years, not consecutive calendar years, which matters because policy and subsidy cycles tend to rhyme across those phases. Midterm years often bring budget fights, farm bill debates and shifting expectations for crop insurance and biofuel mandates, all of which can skew planting decisions and price behavior in ways that differ from presidential or pre‑election years.
Historically, the trade direction for this setup has been long. Across those six midterm-year samples, 83% Percent Profitable with 5 winners and 1 loser means most iterations have rewarded bullish exposure during this slice of the calendar. Avg Profit of 3.62% reflects winners only, while Avg Profit - All of 3% folds in the single losing year, so the downside outlier has not erased the broader tendency.
The strongest year in the sample came in 2018, when the contract gained 5.55% over the window after an entry around 374.0 and an exit near 394.75. The weakest was 2002, which finished down 1.71% despite a brief intraperiod pop, reminding traders that even in a favorable phase, policy or weather surprises can flip the script.
Intraday and intraperiod swings have been far from trivial. In 2006, the best point‑to‑peak move, known as the maximum favorable excursion, reached 10.03% before the contract settled with a 3.72% gain. On the other side, the worst drawdown from entry, or maximum adverse excursion, hit -5.98% in 2002 and -5.37% in 2022, showing that even years that ultimately worked for longs could subject traders to sizable downside before recovering.
The historical seasonal trend line for this window tilts higher rather than grinding sideways. In many of the winning years, corn has tended to firm early in the period as planting intentions and early weather maps hit the tape, then consolidate or extend into May as acreage and emergence data confirm or challenge those expectations.
The cumulative return profile across the six midterm-year samples builds steadily rather than in a single burst. Gains have often accrued in stages, with a first leg tied to planting headlines and a second leg when the market reassesses yield risk as the crop gets in the ground.
Year‑by‑year bars that combine net results with best and worst excursions show how upside potential and drawdown risk have coexisted in this window.
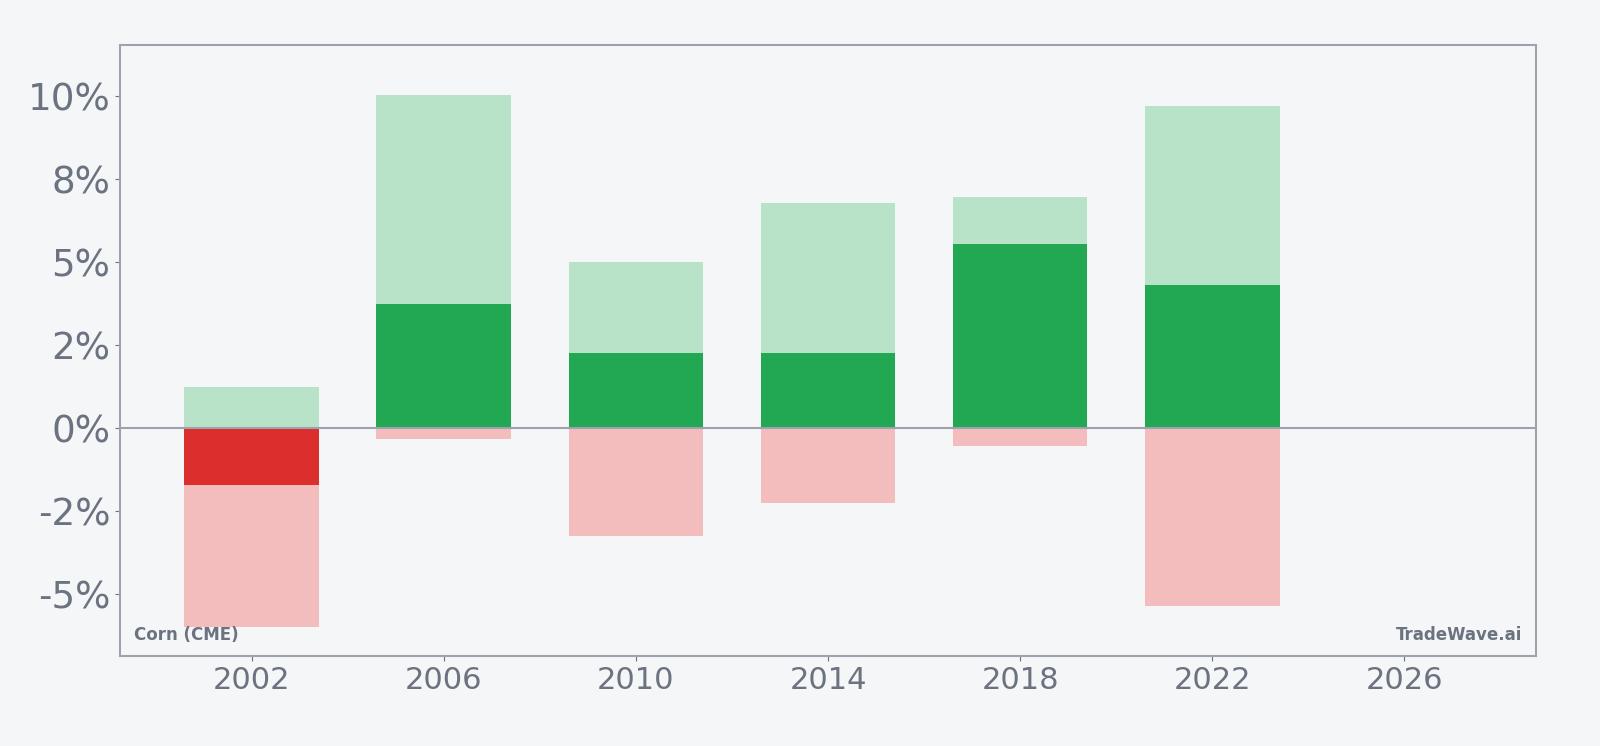
History does not guarantee future results, and maximum adverse excursions have at times been large even in years that finished higher.
Put together, the record is clear: in the last six midterm election years, this late‑March to early‑May stretch has usually rewarded corn bulls, but it has not been a smooth ride.
Price and near-term drivers
Front‑month Corn (CME) futures settled at 471.25 on Monday, up 1.2% on the day and roughly 8.07% over the past month, as prices continue to rebound from winter lows and trade near the upper end of the past year’s range.[1] The contract is about 4.0% below its 52‑week high of 490.75 and well above the 52‑week low of 368.75, with today’s session seeing a relatively tight intraday band between 464.0 and 471.5 on lighter‑than‑average volume of 23,782 contracts versus a 20‑day average of 201,124.[1]
That price recovery follows a rough start to the year for grains after the U.S. Department of Agriculture raised its corn ending‑stocks estimate to 2.23 billion bushels in January, a higher‑supply signal that pressured futures across the curve.[1] In February, farmers were already signaling plans to plant about 94.9 million acres of corn for 2026, slightly below last year as narrow profit margins and shifting USDA assumptions forced tough choices on rotation and input spending.[1]
By early March, some analysts were talking about a potential mean‑reversion rally in agriculture, with corn flagged as a candidate to claw back part of its earlier losses as traders reassessed demand and cross‑commodity flows.[1] The recent bounce toward the top of the 12‑month range fits that narrative, even as the market waits for the next round of acreage and quarterly stocks data to refine the balance‑sheet picture.
From a macro standpoint, corn’s role in feed, ethanol and export markets keeps it tightly linked to broader themes around fuel demand, livestock margins and global trade. Any surprise in U.S. planting progress, South American harvest results or policy shifts on biofuel blending could quickly change the tone of this rally, especially with the seasonal window about to open.
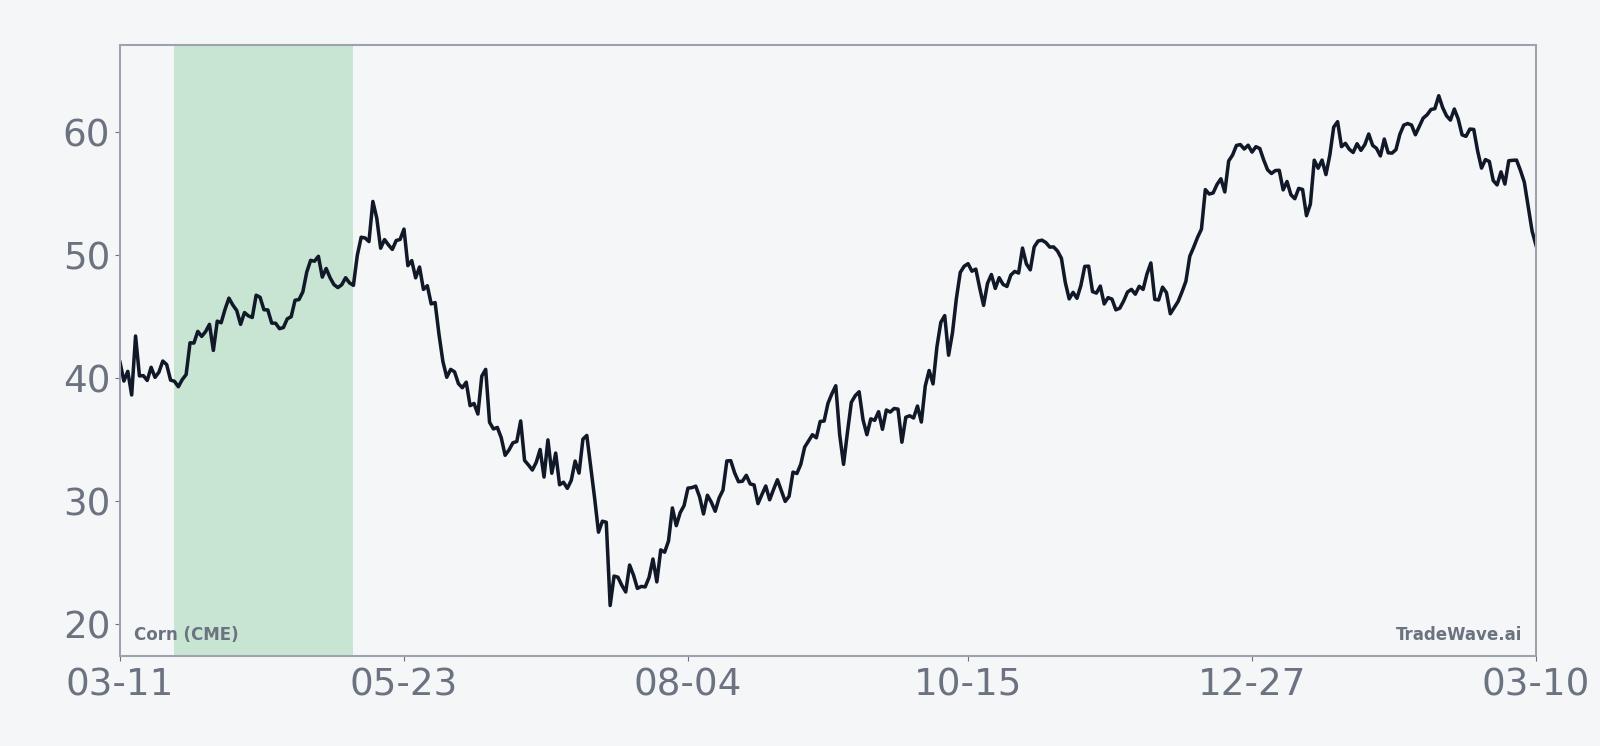
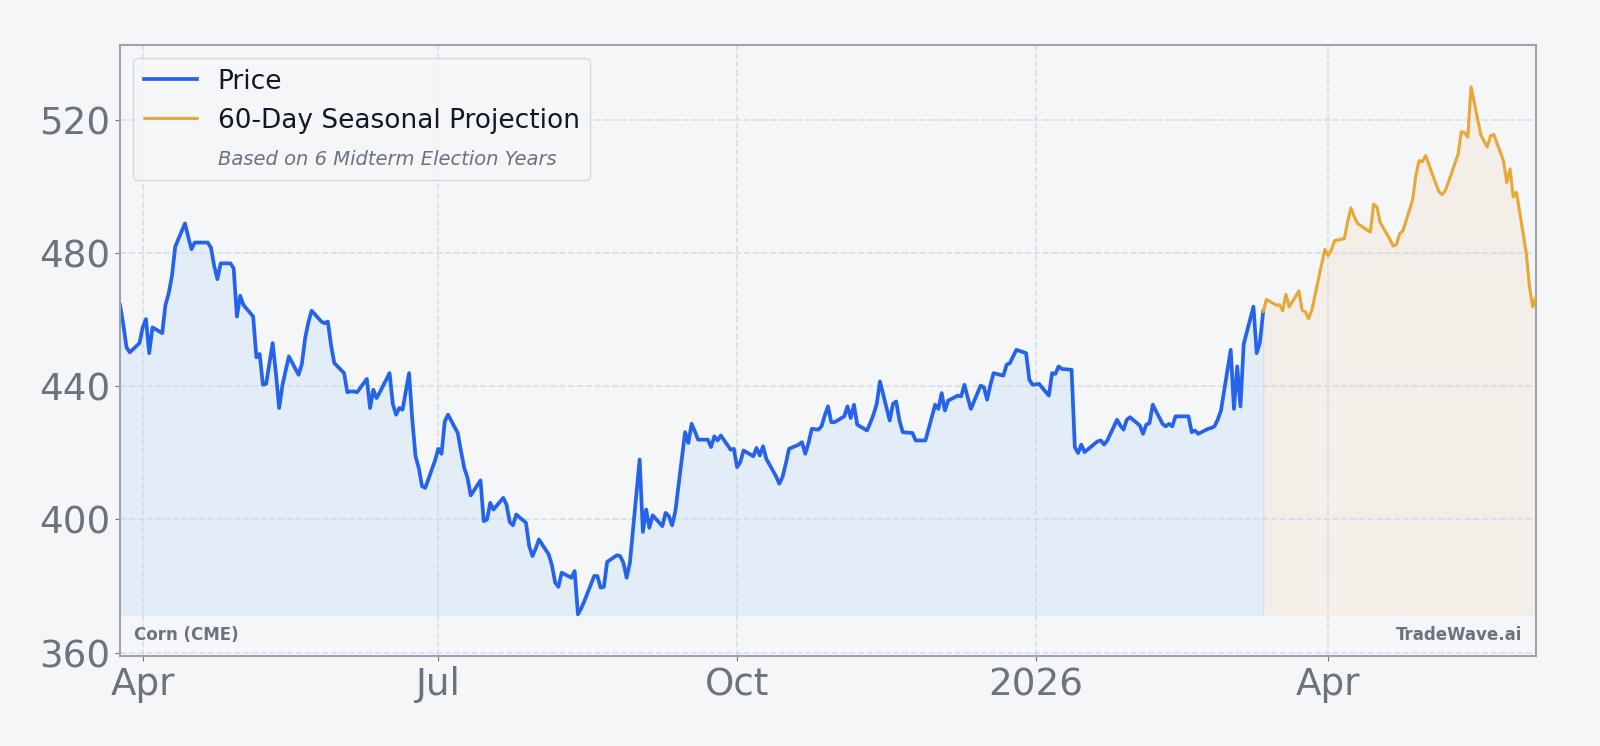
The chart below situates the latest move in its recent multi‑month context, alongside a 60‑day seasonal projection based on prior midterm election years.
What to watch as the window opens
As the 47‑day midterm-year window kicks off on Mar 25, traders will be watching how price behaves around the recent 471.25 level and whether corn can challenge or break above the 490.75 52‑week high without first revisiting deeper support.[1] A firm tone with shallow pullbacks would rhyme with the stronger historical years, while a quick slide back toward the low‑430s, near the 50‑day moving average of 434.27, would look more like the outlier seasons that struggled.[1]
On the fundamental side, upcoming USDA acreage and stocks reports, along with early planting progress updates, will be key tests of the seasonal script. Historically, some of the best years in this window have coincided with either acreage surprises or early weather scares that tightened perceived supply, while the lone losing year came when comfortable stocks and benign conditions kept a lid on rallies.
Finally, watch how the broader agriculture complex trades around corn. If talk of a broader commodity rally gains traction and volume in corn climbs back toward or above its 20‑day average, that would signal that macro and seasonal forces are pulling in the same direction. If, instead, rallies keep stalling on light participation, it would suggest that this midterm-year window may end up closer to the weaker side of its historical range despite the bullish bias in the data.