Occidental Petroleum (OXY) Faces 6% Revenue Hit as 9-of-10 Midterm Spring Streak Nears
Occidental Petroleum is heading toward a historically strong 22-day midterm-year window just as shares trade near a 52-week high and energy fundamentals stay in focus.

Key takeaways
- Occidental Petroleum has posted gains in 9 of the last 10 midterm-year spring windows for this 22-day pattern, with a long trade direction.
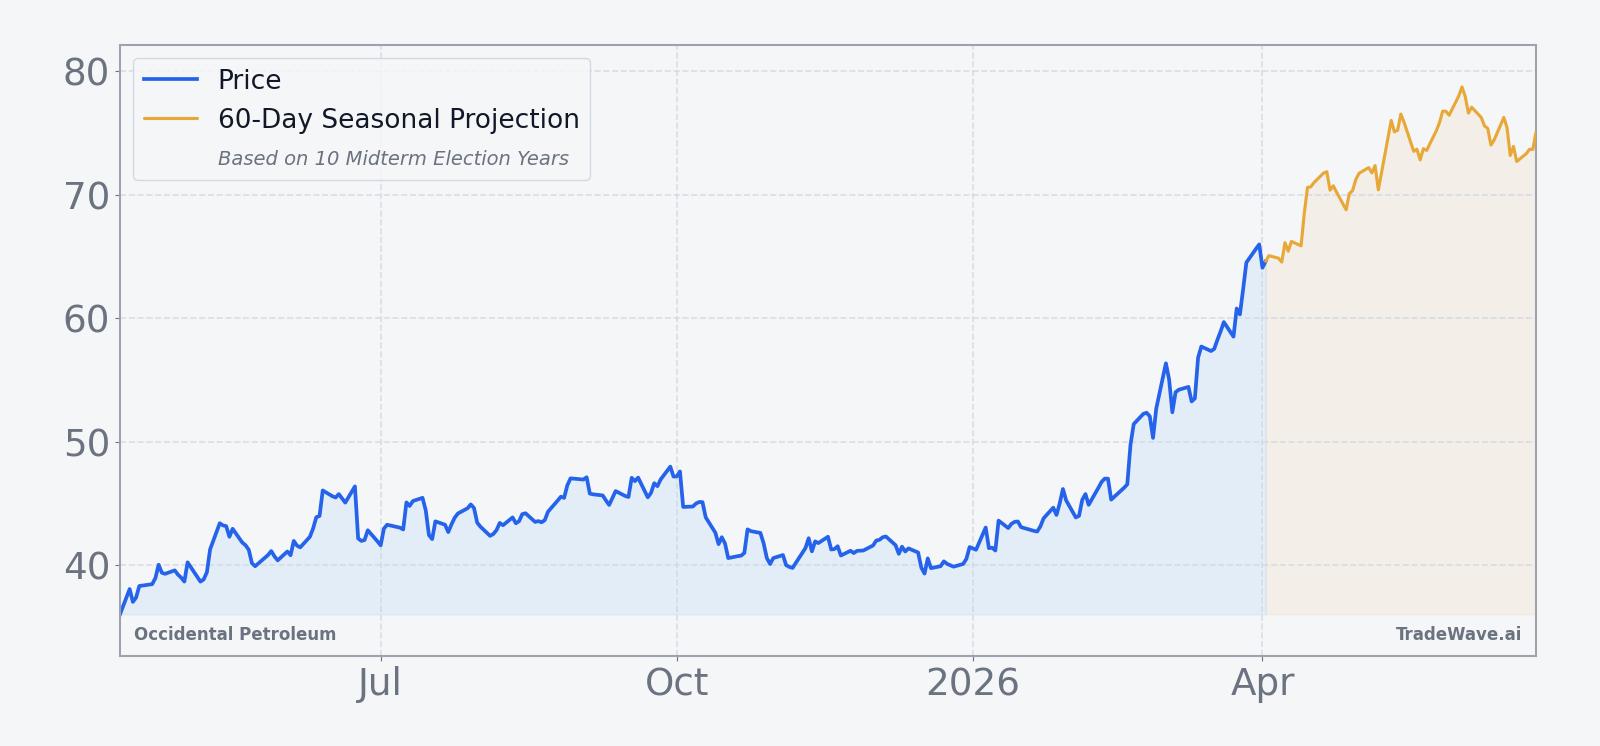
- The upcoming window begins Apr 11, 2026 and runs for 22 trading days, targeting the last 10 midterm election years rather than consecutive calendar years.
- Percent Profitable stands at 90%, with 9 winners and 1 loser, and winning years have averaged a 4.05% gain versus a 4% average when all years are included.
- The TradeWave Ratio is 1.44, suggesting price has typically traveled meaningfully in the long direction within the window, while the Sharpe ratio of 0.82 points to a solid risk-adjusted profile.
- Intraperiod swings have been real: the weakest year saw a worst drawdown of about 11% even though the window still finished slightly positive, underscoring meaningful downside risk inside a generally bullish pattern.
- With OXY trading about 2.1% below its 52-week high after a 27.24% one-month surge, the seasonal tailwind will intersect an already strong tape.
According to historical data from TradeWave.ai, this specific midterm-year spring stretch has behaved very differently from an average month on the calendar for Occidental Petroleum. The next section walks through what that pattern has looked like in prior cycles and how it frames the upcoming window.
Seasonal window
Occidental Petroleum has rallied in 9 of the last 10 midterm election years during this 22-day spring window, averaging 4.05% gains in winning years. The next iteration begins on Apr 11, 2026, with the stock last changing hands at 57.88, about 2.1% below its 52-week high of 59.15 after a 27.24% jump over the past month. That combination of a strong tape and a historically bullish midterm-year window gives traders a clear calendar marker to watch as the presidential cycle moves deeper into the midterm phase.
The presidential election cycle matters here because the pattern isolates the last 10 midterm election years, a phase that has often featured shifting policy expectations, spending debates and energy regulation noise. Grouping by midterm years rather than simple calendar history helps separate how OXY has behaved when Washington is in the middle of the cycle and markets are already looking ahead to the next presidential race.
This seasonal window begins on Apr 11, 2026 and spans 22 trading days. Historically, during this period, Occidental Petroleum has shown a strong upside tendency for long positions, with 9 winners and just 1 small losing year across the midterm-year sample. The average gain across all years is 4%, only slightly below the 4.05% average for winners, which tells you the lone down year has not been a major drag on the overall profile.
Looking at individual years, the weakest outcome came in 1986, when the window finished down 0.48% despite a maximum favorable move of 2.89% and a worst drawdown of 5.29% from the entry. On the other side of the spectrum, 2006 delivered a 10.82% net gain with a peak run-up of 12.57% and only a 0.31% worst drawdown, a textbook example of the pattern working cleanly in the long direction. More recently, 2022 finished up 0.66% but saw a maximum favorable move of 9.74% and a worst drawdown of 11.03%, underscoring how choppy the window can be even when it ends in the green.
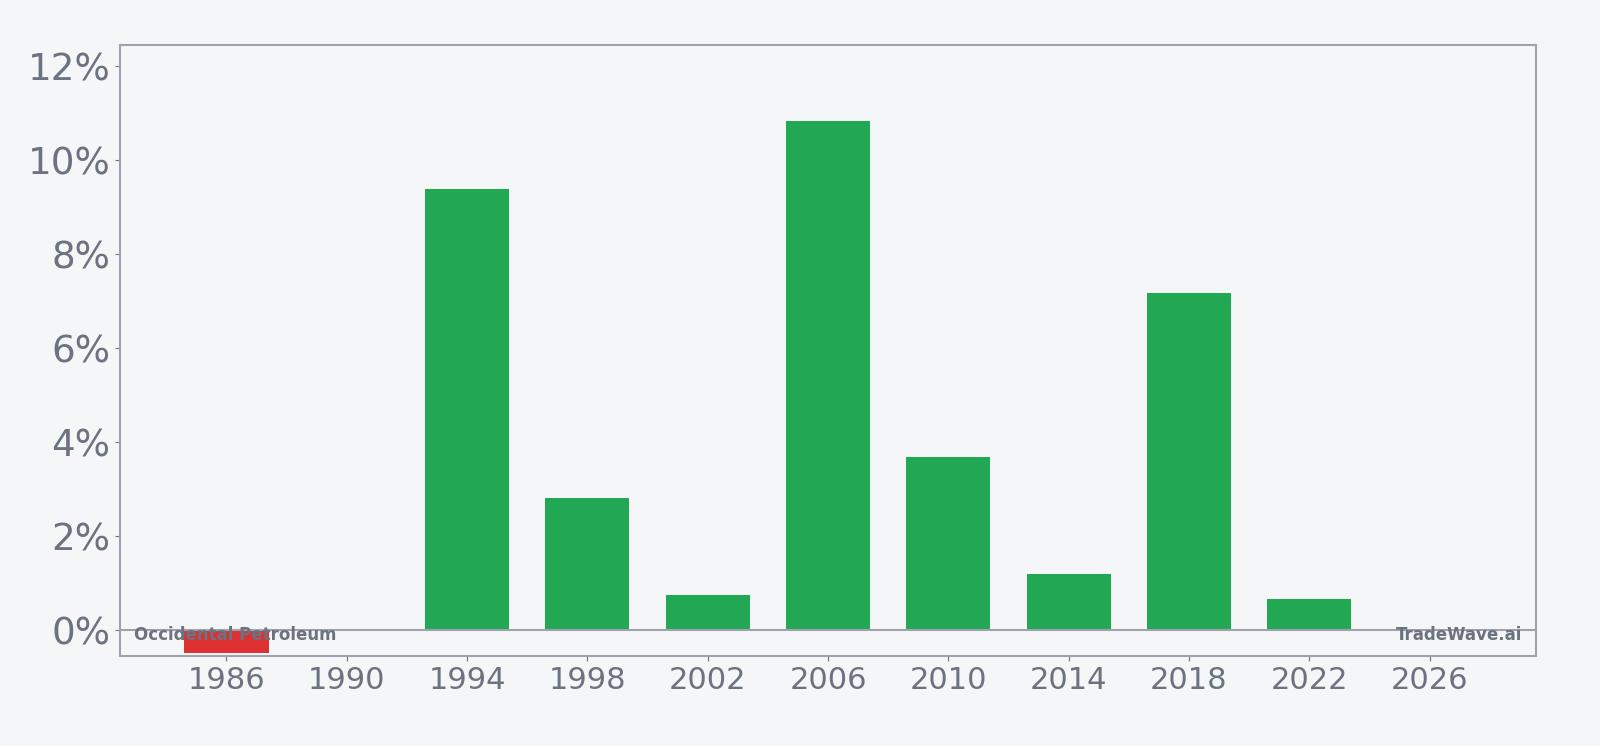
The historical seasonal trend chart for this window shows a generally upward-sloping average path, with gains tending to build steadily rather than arriving in a single spike. That fits with the long trade direction and the 90% win rate, suggesting that in most midterm years OXY has spent more time grinding higher than backing off during this slice of the calendar.
A stacked view of net results alongside peak run-ups and worst drawdowns shows how far OXY has typically swung inside the window.
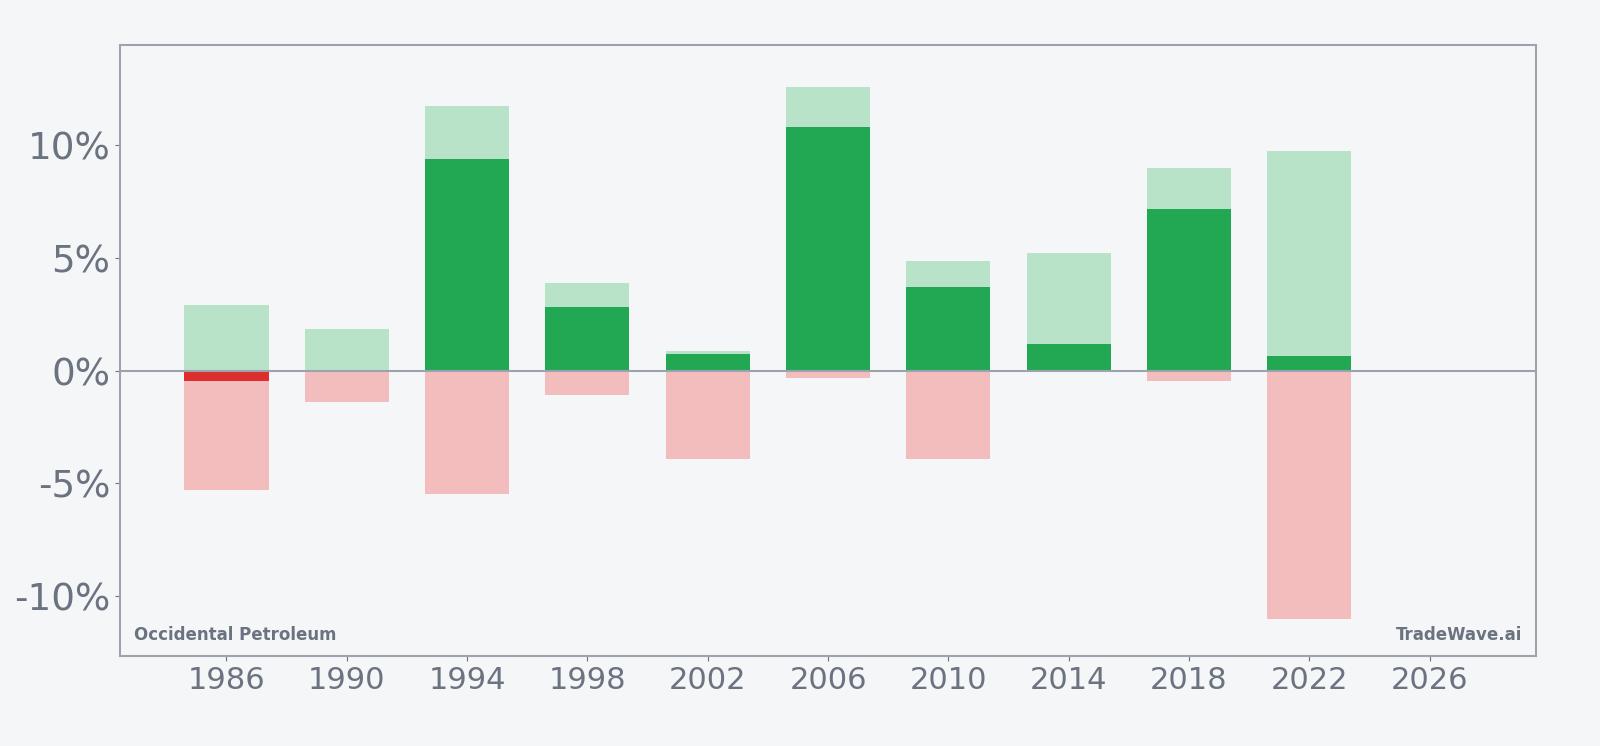
The stacked net, best-case and worst-case bars underline that this has been a bullish but not low-risk pattern. Several years show sizable maximum favorable moves in the high single to low double digits, while worst drawdowns have at times pushed into mid-single to low-double-digit territory before the window closed. Add it up and you get a long-biased window where price has often traveled meaningfully in both directions before finishing higher in most cycles.
History does not guarantee future results, and worst-case intraperiod drawdowns can be large even in years that ultimately finish as winners.
Price and near-term drivers
Occidental Petroleum closed at 57.88 on Mar 13, down 0.53 on the day for a 0.91% decline, after trading between 57.06 and 58.33 on volume of about 16.2 million shares. That leaves the stock roughly 27.24% higher over the past month and about 2.1% below its 52-week high of 59.15, with the 50-day moving average back at 47.42 and 20-day average volume near 19.7 million shares, a setup that reflects a strong rebound from last year’s pressure from softer oil prices and revenue declines.[1]
In Oct 2025, Forbes reported that Occidental’s revenue had been declining at an annual rate of 6.8% over three years, with quarterly revenue at $6.4 billion, down 6%, but still generating operating income of $5.5 billion and net income of $2.4 billion as the company leaned on strong margins and cash flow.[1] That backdrop, combined with high debt levels and sensitivity to crude prices, has kept OXY trading as a leveraged play on the energy tape rather than a pure defensive holding.
Also in late 2025, Occidental moved to streamline its portfolio, entering talks and then a definitive agreement to sell its OxyChem petrochemicals unit to Berkshire Hathaway for roughly $9.7 billion, a deal framed as a way to reduce debt and refocus on core oil and gas operations.[2][3][4] CNBC highlighted OXY among stocks making notable premarket moves around that period as investors weighed the balance between deleveraging and lost downstream earnings.[5] While those headlines are months old, they help explain why the stock’s recent strength has come with a sharper focus on balance sheet repair and capital discipline.
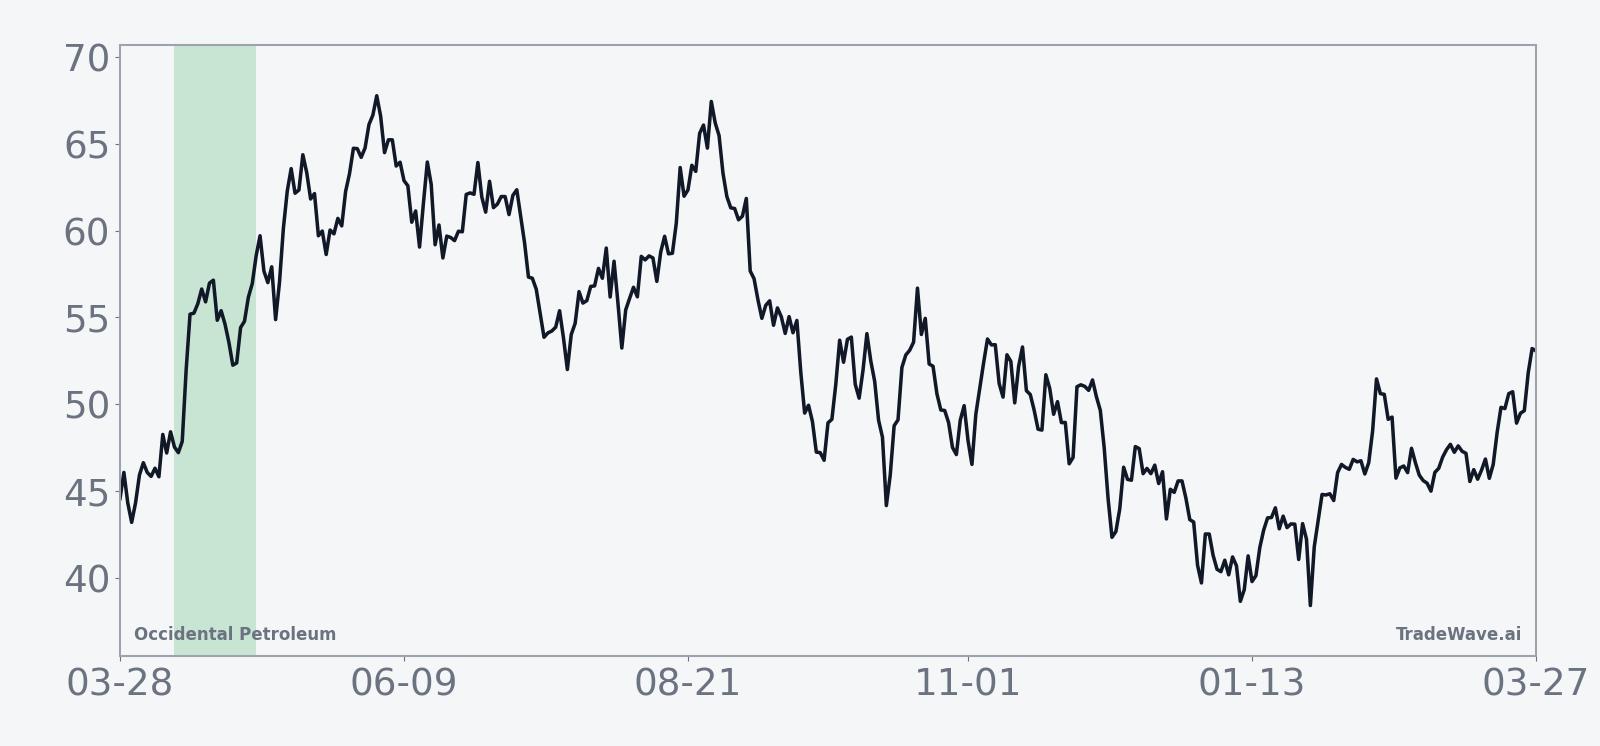
The chart below situates the latest move in its recent multi-month context.
Macro and election-cycle backdrop
Energy names like Occidental sit at the intersection of commodity markets and policy. In midterm election years, debates over regulation, drilling permits, emissions rules and strategic petroleum reserve policy often intensify, even if the biggest legislative moves wait for the presidential election year. For a balance-sheet-sensitive producer, that mix of macro and policy noise can amplify swings around earnings and oil price moves.
In Oct 2025, coverage of Occidental’s fundamentals pointed to declining revenue tied in part to softer oil prices, even as the company maintained profitability and strong cash flow margins.[1] That kind of environment, where crude is not in a runaway bull market but producers are still generating cash, can make seasonal windows more important as traders look for repeatable patterns in an otherwise choppy tape.
What to watch as the window opens
The key calendar marker is Apr 11, when the 22-day midterm-year spring window begins. Traders will be watching whether OXY can hold above its 50-day moving average and stay within striking distance of the 52-week high as the window opens, or whether profit-taking after the 27.24% one-month surge starts to bite. A pattern-consistent year would likely feature early or mid-window strength with net gains by the end of the stretch, even if intraperiod pullbacks are sharp.
On the macro side, any renewed pressure on oil prices or fresh headlines around Occidental’s portfolio strategy, capital returns or debt reduction could either reinforce or fight the historical pattern.[1][2][3][4][5] If crude stabilizes and management continues to emphasize balance sheet repair, the historical midterm-year bias toward upside in this window would be playing out against a supportive fundamental story. If oil rolls over or policy risk flares, the 2022 template is a reminder that the window can still finish positive while subjecting holders to double-digit drawdowns along the way.
For this cycle, the most useful tell may be how OXY behaves on dips inside the window. Quick reversals higher after 3% to 5% pullbacks would rhyme with many of the prior winning years, while a failure to bounce from early weakness would be an early sign that this iteration may diverge from the 9-for-10 track record. Either way, the calendar is about to shift into a part of the midterm year where OXY has historically not traded like an average month.
Sources
- Forbes, "Time To Buy Occidental Petroleum Stock?", Oct 08, 2025
- Seeking Alpha, "Berkshire Hathaway nears $10B deal for Occidental's petrochem unit", Sep 30, 2025
- Reuters, "Occidental to sell OxyChem unit to Berkshire for $9.7 billion", Oct 02, 2025
- Reuters, "Occidental in talks to sell OxyChem unit for at least $10 billion", Sep 28, 2025
- CNBC, "Stocks making the biggest moves premarket: Occidental Petroleum, Lithium Americas, Fair Isaac & more", Oct 02, 2025