New CEO Plan at Target Corporation (TGT) Meets a 7-of-8 Winning Midterm Spring Stretch
Target Corporation is trading well below its 52-week high just as a 40-day midterm-year seasonal window with a strong bullish track record gets underway.

Key takeaways
- A 40-day seasonal window tied to midterm election years began on Mar 23 and has historically favored long positions in Target Corporation.
- Across the last 8 midterm cycles, Target has finished this window higher in 7 years and lower in just 1, with Percent Profitable at 88%.
- Average gain in winning years is 5.04%, while Avg Profit - All, which includes the lone losing year, still comes in at 4%.
- Today’s $114.93 close leaves Target about 8.8% below its 52-week high of $126, even as the new CEO works through a sales slump and turnaround plan.[4]
- Intraperiod swings have been meaningful, with several years showing sizable peak run-ups and notable drawdowns before the window closed.
- History points to a bullish seasonal bias, but the combination of weak recent fundamentals and activist pressure keeps execution risk high.[4][11]
According to historical data from TradeWave.ai, this specific midterm-year stretch has behaved very differently from an average spring for Target, and the latest iteration is already in motion.
Seasonal window
Target Corporation has risen in 7 of the last 8 midterm election years during this 40-day window, posting an average gain of 5.04% in the winning runs. The current window began on Mar 23 and arrives with the stock at $114.93, about 8.8% below its 52-week high of $126 and well above its 52-week low near $81.48.[3] That gap between a historically strong calendar stretch and a stock still digging out from a sales slump is what makes this year’s setup stand out.[4]
Grouping the data by the presidential election cycle matters here because consumer spending and retail margins often respond to policy shifts and fiscal tone. Midterm election years tend to feature noisy debates over budgets and regulation, which can weigh on sentiment early in the year but have historically lined up with more constructive stretches for select retailers as visibility improves.
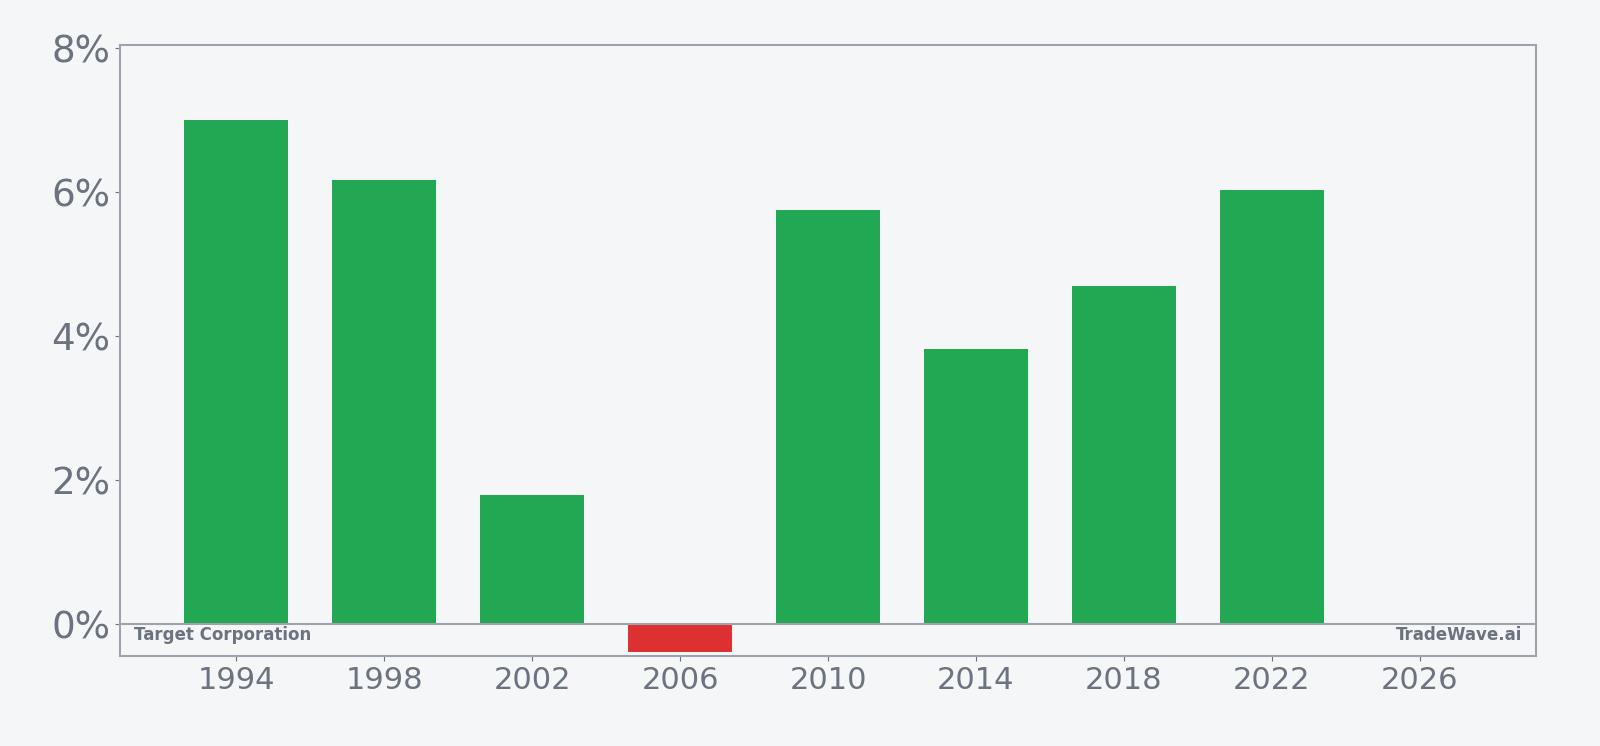
This seasonal window is currently underway, spanning 40 trading days, and has historically been a strong stretch for Target Corporation. The trade direction is long, and across the last 8 midterm election years the pattern shows 7 winners against just 1 loser, for a Percent Profitable reading of 88%. Average gain in the winning years is 5.04%, while including the single down year pulls the Avg Profit - All to 4%, which is still solidly positive for a roughly two-month span.
The per-year breakdown shows how that plays out in practice. In 1994, the stock gained 7.0% in the window, while 1998 delivered 6.17% and 2010 added 5.75%. The weakest outcome came in 2006, when Target slipped 0.39% despite a modest intraperiod rally, underscoring that even the “bad” year in this sample was only a small loss.
Intraperiod swings have been meaningful. In 2022, for example, the best point-to-peak move, or maximum favorable excursion, reached 17.6% even though the final net gain for the window was 6.03%. In 2002, the stock finished up 1.8%, but the worst drawdown from entry, or maximum adverse excursion, hit -5.94% before the recovery. That mix of strong upside bursts and occasional sharp dips is typical of a window where the TradeWave Ratio sits at 1.59 and the Sharpe ratio, which measures risk-adjusted average return based on end-of-window outcomes, is 1.56.
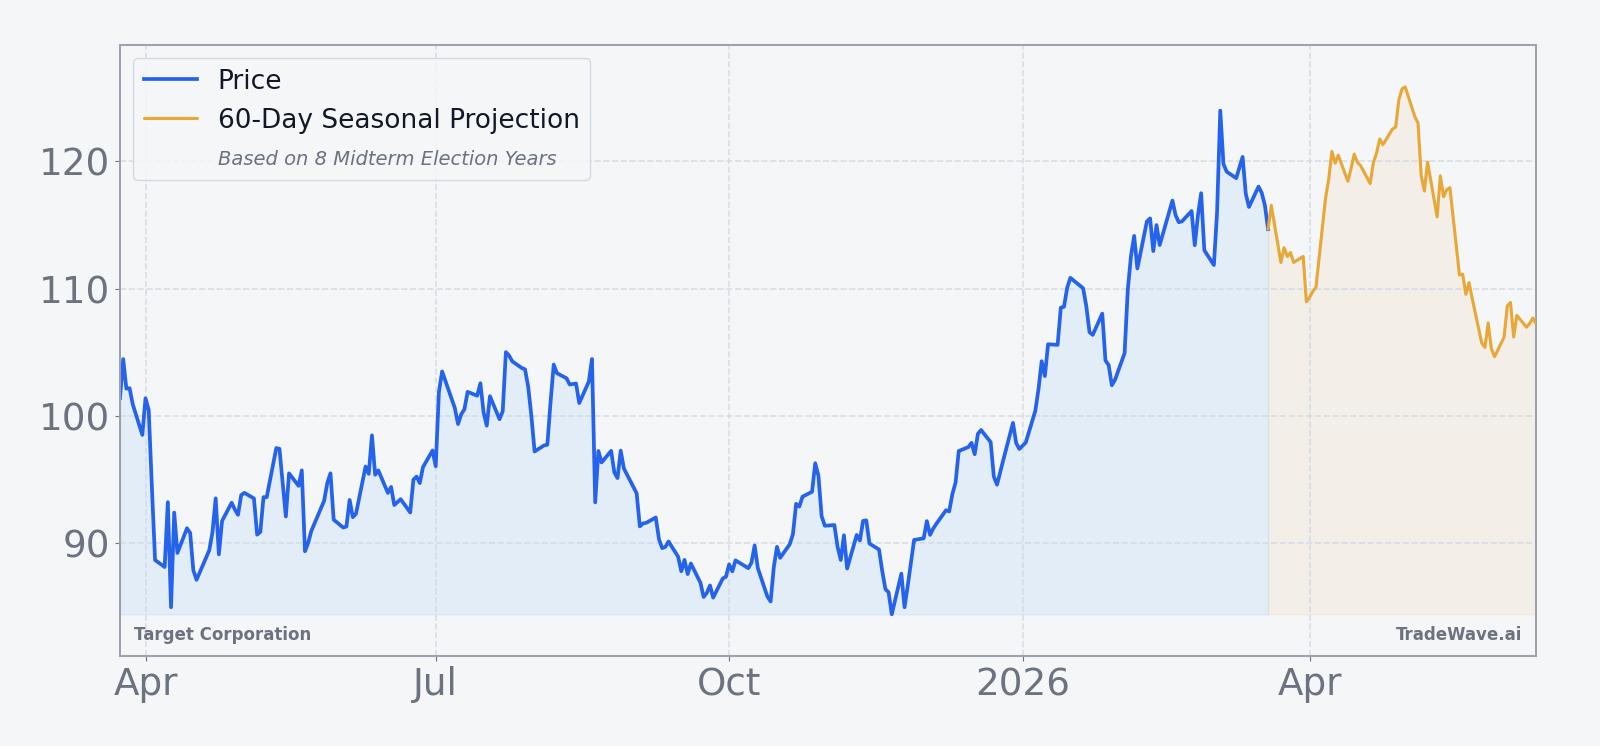
The historical seasonal trend line slopes higher through most of the window, with gains tending to build rather than arrive in a single spike. That suggests prior midterm-year runs often saw strength emerge and then persist across several weeks, even when the broader retail tape was choppy.
Yearly net results alongside peak run-ups and worst drawdowns show how often Target has rallied in this window and how deep setbacks have typically been.
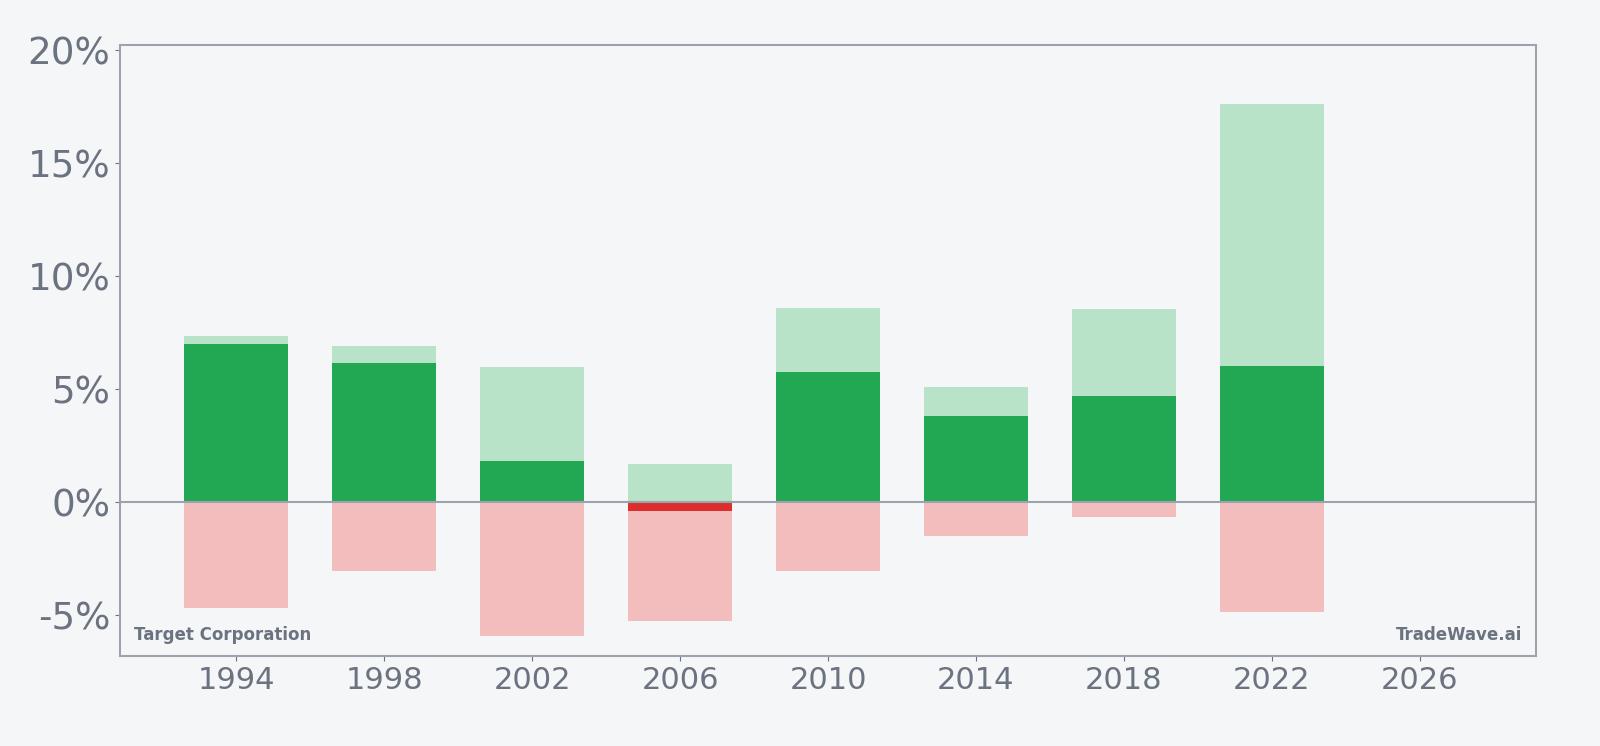
The stacked view of net results, peak favorable moves and worst drawdowns shows a clear bullish tilt but also real volatility. Several years feature sizable maximum favorable excursions in the mid to high single digits, and 2022 stands out with a double-digit intraperiod rally, while adverse excursions in the -3% to -6% range appear in multiple cycles. The pattern is clear: this window has favored longs in 7 of 8 years, with positive average outcomes, but it has not been a straight line.
History does not guarantee future results; adverse excursions (MAE) can be large even in winning windows.
Price and near-term drivers
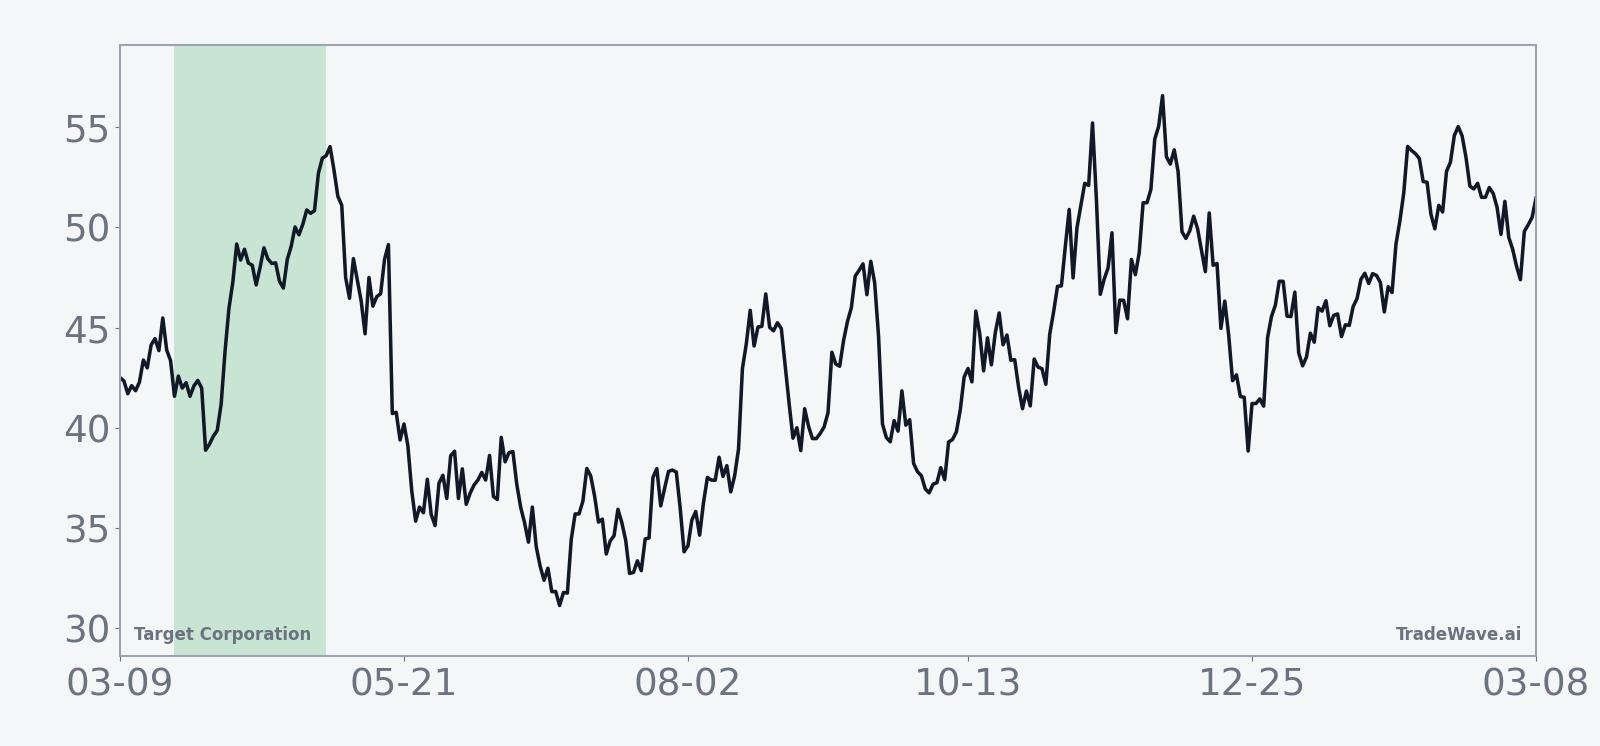
Target shares closed at $114.93 on Mar 24, up 1.47% on the day, leaving the stock about 8.8% below its 52-week high of $126 and well above its 52-week low near $81.48.[3] That puts the retailer in the middle of its one-year range as investors weigh a fresh turnaround plan against a still-soft sales backdrop.
The chart below situates the latest move in its recent multi-month context and overlays the 60-day seasonal projection tied to this midterm-year window.
The fundamental story remains challenging. On Mar 2, Target reported another quarter of declining sales, with comparable sales down 2.7% and both revenue and earnings per share falling year over year as the company ceded ground to rivals.[4] New CEO Michael Fiddelke outlined plans to revive growth by investing in stores and technology, but investors are still waiting for evidence that traffic and ticket size can stabilize.[4]
Pressure is also coming from the shareholder base. In Dec 2025, activist investor Toms Capital Investment Management disclosed a stake in Target, adding scrutiny to management’s strategy as the company works through restructuring and prior layoffs aimed at cutting costs.[11][1] The broader backdrop is a fiercely competitive retail landscape, with Walmart and Amazon pushing hard on price, logistics and digital reach, leaving Target to defend its brand and margin profile.[1]
Sector context has not helped. Over the past year, Target’s shares fell 37.6% against industry growth of 7.8%, leaving the stock trading at a forward price-to-earnings multiple of 11.91 that reflects both skepticism and optionality for a turnaround.[1] Earlier periods of disappointing sales and traffic already triggered bouts of heavy volume and downside volatility, reminding traders how quickly sentiment can swing when the company misses on execution.[5]
Macro and election-cycle backdrop
This year sits in the midterm election phase of the presidential cycle, a period that often brings noisy debates over fiscal policy, regulation and consumer confidence. For retailers like Target, that can translate into uneven spending patterns as households respond to headlines on taxes, benefits and interest rates, even when the underlying labor market remains relatively stable.[1]
Historically, midterm years have shown a two-playbook structure for risk assets: a choppier first half as policy uncertainty peaks, followed by stronger stretches as the path into the pre-election year becomes clearer. The 40-day Target window that just opened is part of that second act in prior cycles, capturing a span where the stock has often rallied even when the broader narrative around retail felt cautious.
What to watch in this window
For this iteration of the pattern, the first marker is how Target trades around key technical levels. Holding above the recent lows and pushing back toward the $120 area during the window would rhyme with prior midterm-year runs that saw steady accumulation rather than sharp reversals. A break back toward the low $100s, especially on heavy volume, would signal that this cycle may diverge from the historical script.
Fundamentally, investors will be watching for any early signs that Fiddelke’s turnaround plan is gaining traction, whether through updated commentary on store traffic, digital engagement or merchandising mix.[4] Even modest improvements in those metrics during the window could give the seasonal tailwind more room to operate, while fresh disappointments on sales or margins would test how much patience remains after last year’s underperformance.
Policy and macro headlines also matter. Any shifts in the fiscal debate that affect disposable income, such as changes in tax credits or consumer relief measures, could influence discretionary spending at big-box retailers during this midterm stretch. Traders will be gauging whether consumer sentiment stabilizes or weakens as the political calendar heats up, and how that filters into guidance from Target and its peers.[1]
Finally, watch the tape for signs of renewed pressure or support from large shareholders. Activist engagement from Toms Capital and others has already raised the stakes for management’s execution.[11] If the stock begins to respond positively to operational updates during this 40-day window, it would align with the historical pattern of midterm-year strength; if instead the shares sag despite constructive seasonality, that would be a clear signal that fundamentals and positioning are overpowering the calendar effect.
Sources
- [1] Nasdaq / Zacks Investment Research, "Target Restructures Workforce: Will the Bold Move Pay Off?", Oct 24, 2025
- [2] Yahoo Finance, "Target Restructures Workforce: Will the Bold Move Pay Off?", Oct 24, 2025
- [3] CNBC, "Check out Target Corp's stock price (TGT) in real time", Dec 23, 2025
- [4] Wall Street Journal, "Target Sales Just Fell Again. Now Its New CEO Plans for Turnaround.", Mar 3, 2026
- [5] MarketWatch, "Target sales disappoint as store traffic and spending decline", Nov 19, 2025
- [11] Reuters, "Target faces activist investor pressure amid sales decline", Dec 26, 2025