Shorts Eye Live Cattle (LE) as 6% Average Midterm Spring Decline Window Kicks Off
Live Cattle futures are hovering just below record highs as a 54-day midterm-year seasonal window that has historically leaned bearish for LE kicks in.
What is the seasonal pattern for Live Cattle (LE)?
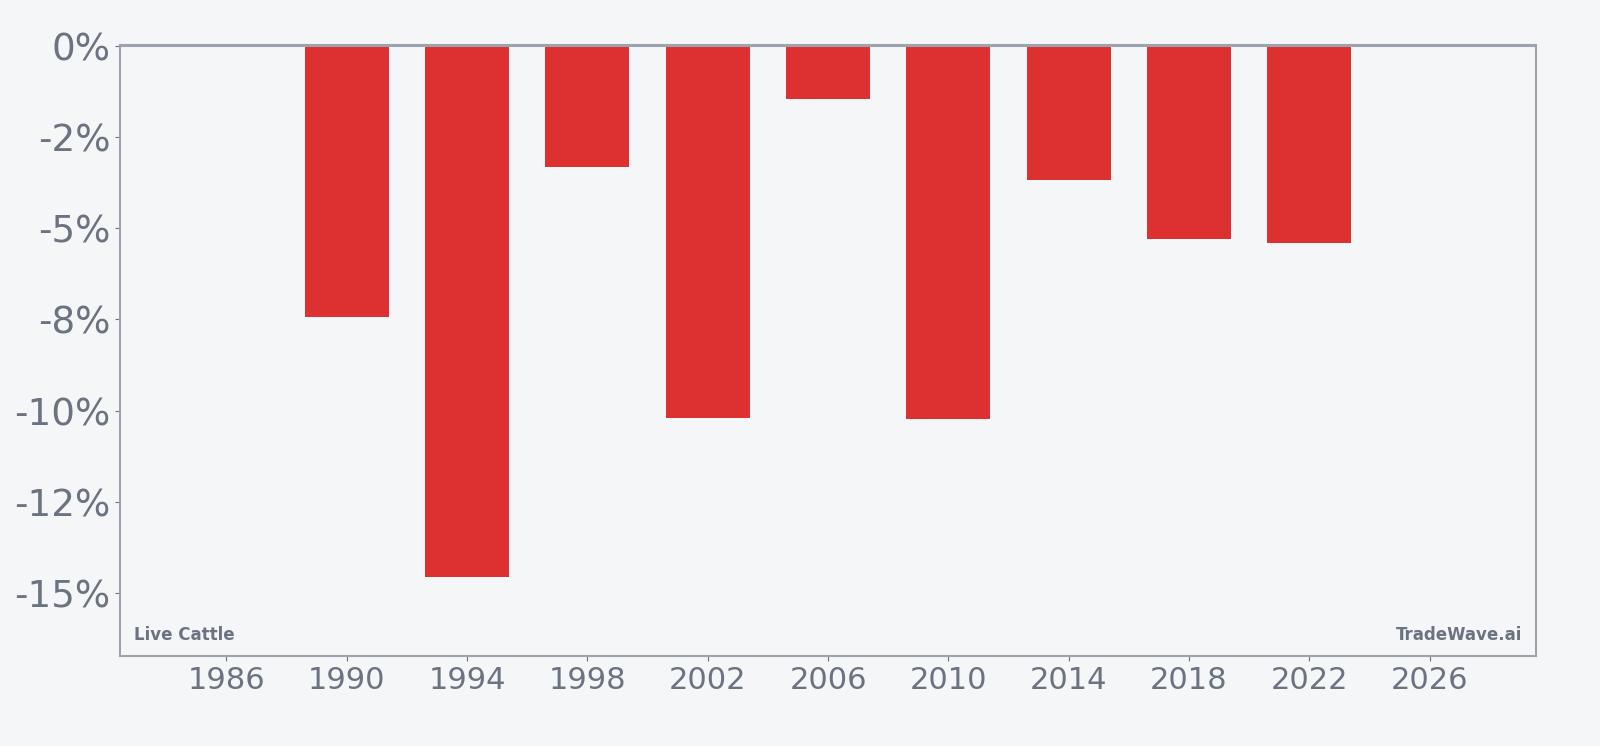
Live Cattle has fallen in 9 of 10 midterm-year spring windows starting Apr 7, with an average 6.84% gain in winning short years.
- 9 for 10 in this window, with short positions averaging 6.84% gains in winning years across the last 10 midterm election cycles.
- Percent Profitable is 90%, with 9 winners and 1 loser for the short-side pattern over this 54-day stretch starting Apr 7.
- Avg Profit - All, which includes both winning and losing years, comes in at 6%, pointing to a solid bearish seasonal bias for LE.
- The trade direction is short, meaning years where Live Cattle drifts or breaks lower have historically been the favorable outcomes in this window.
- Intraperiod swings have been meaningful, with best-case rallies for shorts and worst-case drawdowns both showing that Live Cattle can move sharply during this span.
- The pattern sits in the midterm election year phase, a part of the presidential cycle that often brings policy uncertainty and choppy commodity pricing.
According to historical data from TradeWave.ai, this midterm-year spring stretch in Live Cattle has behaved very differently from an average month on the calendar. The next section walks through how that pattern has played out across the last ten comparable election-cycle years.
How has Live Cattle (LE) traded in this midterm-year spring window?
Live Cattle has fallen in 9 of the last 10 midterm election years during the 54-day window that starts on Apr 7, with short trades averaging 6.84% gains when they work. The new iteration of that window begins today with LE futures last at 247.3, up 0.49% on the session and sitting right on their 52-week high of 248.45.
Grouping the data by the presidential election cycle matters here because this window only looks at the last ten midterm election years, a phase that often brings shifting farm policy, budget debates and demand uncertainty for protein markets. In that specific slice of the calendar, Live Cattle has tended to soften even when the broader commodity complex or equity indices were doing something very different.
Across those ten midterm-year samples, the trade direction is explicitly short. Years where Live Cattle drifted or broke lower are counted as “winners” for the pattern, while sharp rallies were losing years for shorts. With 9 winners and just 1 loser, the Percent Profitable metric of 90% is unusually high for a futures contract, and the 6% Avg Profit - All shows that the one losing year did not erase the gains from the rest of the sample.
Average profit in the winning short years is 6.84%, which is the typical net move from entry to exit when the pattern works. The median profit of 5.35% is slightly lower, which hints that a few stronger years, such as 1994 and 2002, pulled the average up. The cumulative return across all ten midterm-year windows is 80%, meaning that a systematic short approach in this specific 54-day stretch would have added up to a sizable gain over the full lookback.
The intraperiod path has not been one-way traffic. Maximum favorable excursions, which capture the best point-to-peak move in the trade direction, have often been larger than the final net result, showing that Live Cattle can overshoot to the downside before bouncing. Maximum adverse excursions, the worst drawdowns from entry, have also been meaningful in several years, reminding traders that even a strong short-side seasonal edge has come with uncomfortable squeezes along the way.
The historical seasonal average trend line slopes steadily in favor of shorts, with much of the downside accruing in the middle third of the window rather than right at the start. That profile suggests that in prior midterm years, Live Cattle often held up initially before rolling over more decisively as the window progressed.
A combined view of yearly net returns and intraperiod swings shows how often shorts have worked and how large both rallies and breaks have been.
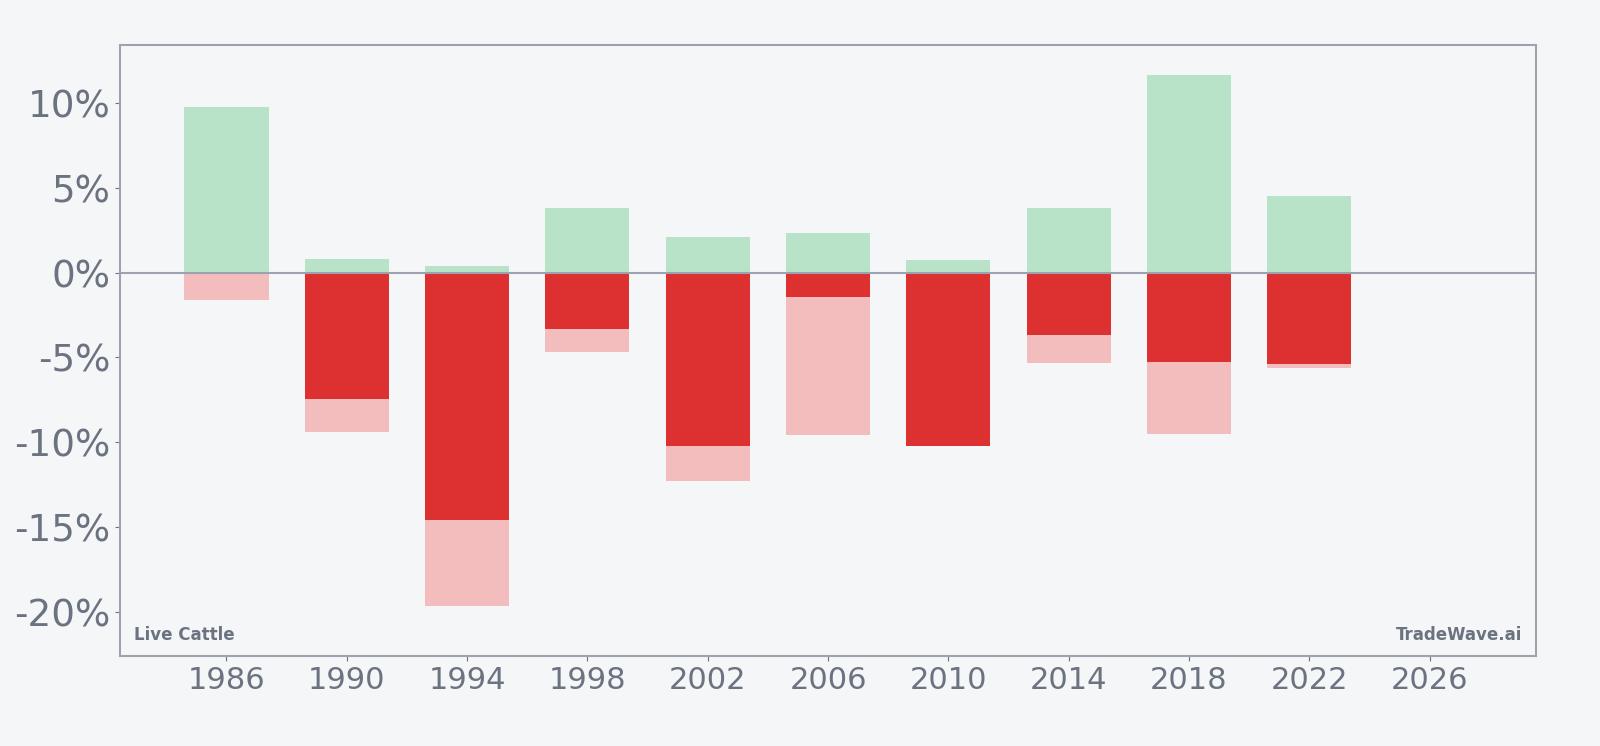
The combined net, maximum favorable and maximum adverse excursion bars show that even in winning years for shorts, Live Cattle has sometimes staged sizeable countertrend rallies before resuming lower, while the lone losing year featured a relatively shallow favorable move and a deeper squeeze. History does not guarantee future results; adverse excursions can be large even in winning windows.
Why does Live Cattle (LE) follow this seasonal pattern?
This midterm-year spring pattern in Live Cattle likely reflects a mix of commodity supply and demand seasonality and the policy calendar. One likely driver is the way feedlot placements, pasture conditions and slaughter schedules line up with early-summer grilling demand, which can shift expectations for beef availability and pricing. Analysts have also pointed to midterm-year budget and regulatory debates that can affect rancher margins and packer behavior, adding an extra layer of uncertainty to an already sensitive time of year for the beef complex.
What is driving Live Cattle (LE) today?
Live Cattle futures settled at 247.3 on Tuesday, up 1.2 points or 0.49% on the day, with the contract trading between 246.125 and a fresh 52-week high of 248.45 on volume of 22,075. The front month is also well above its 50-day moving average of 238.40 and has gained 7.46% over the past month, underscoring how strong the tape has been heading into this historically bearish seasonal window.
That strength follows a longer arc of volatility in the beef complex. In Nov 2025, CNBC reported that live cattle prices had dropped about 15% from record highs, offering some relief to restaurant operators but leaving the broader beef cycle unresolved.[1] The same report flagged that potential policy efforts to lower beef prices could collide with weather and supply constraints, a combination that keeps both upside spikes and sharp pullbacks on the table for 2026.[1]
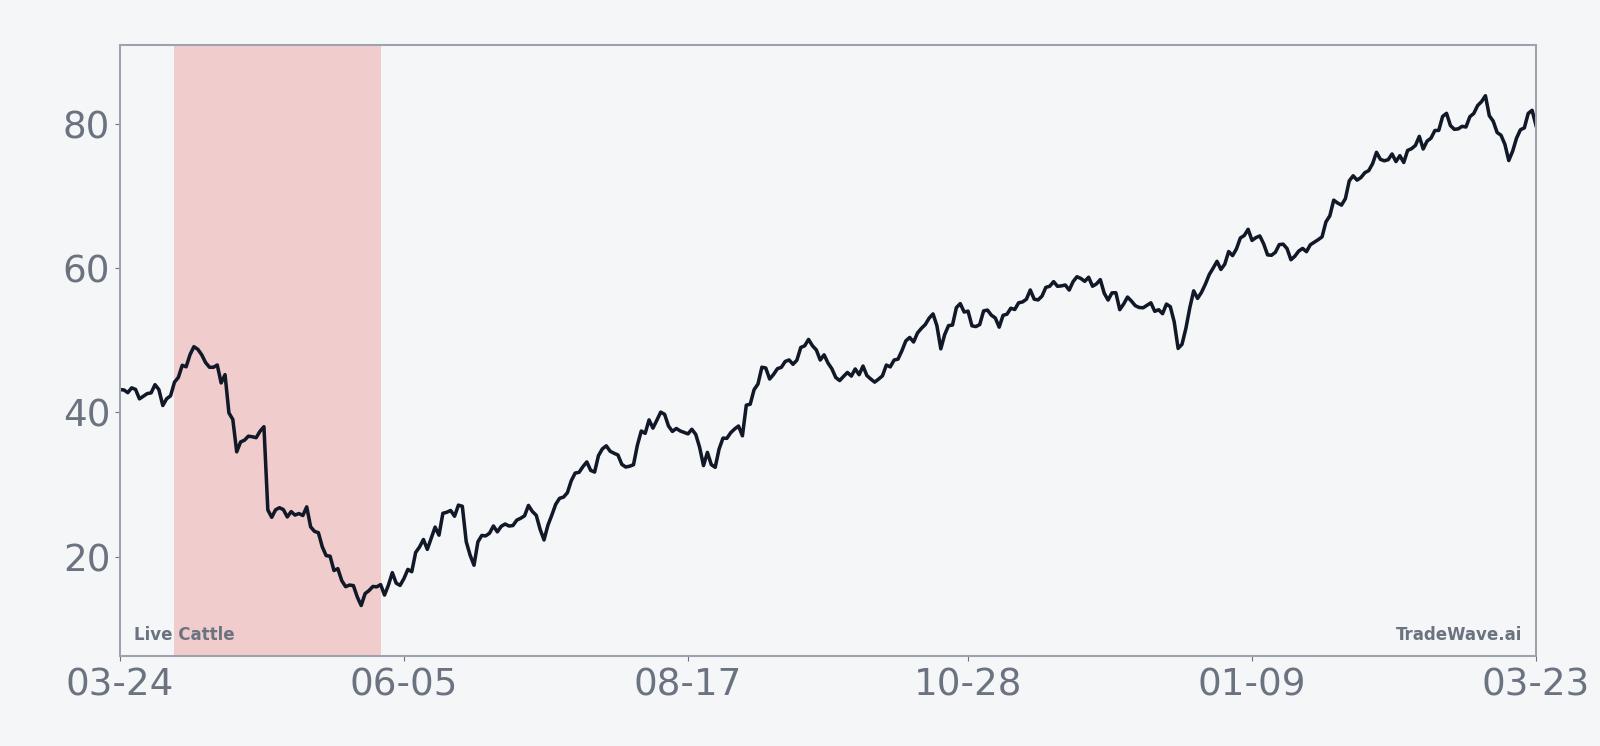
The chart below situates the latest move in its recent multi-month context, alongside a 60-day seasonal projection path.
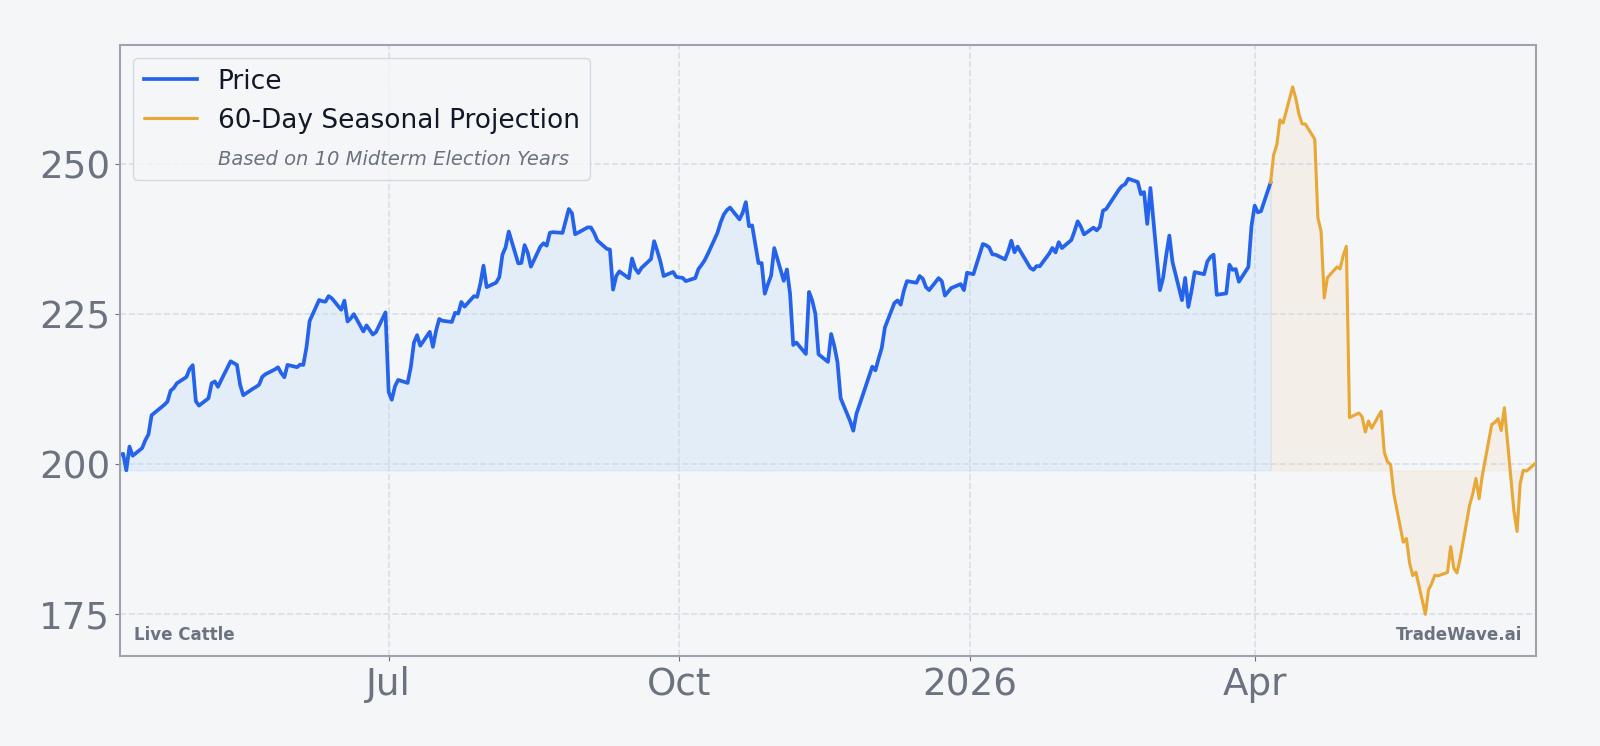
For cattle feeders, packers and beef-linked equities, the setup is a classic tension: spot prices are firm and near the top of the recent range, yet the historical seasonality for this election-cycle phase points to a stretch where downside has often emerged. If Live Cattle were to follow its typical midterm-year pattern, traders would be watching for signs that today’s strength gives way to softer pricing as the 54-day window unfolds.
Sources
About this seasonal analysis
Seasonal pattern data is sourced from TradeWave.ai, which analyzes historical price behavior across annual calendar windows going back up to 30 years. Read the full data methodology or the book The 100-Year Pattern by Afshin Moshrefi (2026 edition). Past performance of seasonal patterns does not guarantee future results. This article is for informational purposes only and does not constitute investment advice.