Silver (SI) Slides From December’s 33% Spike as AI-Driven Supply Crunch Shows Cracks
Silver futures are trading near $73 as the market heads toward a 108-day midterm-election-year window starting Apr 29 that has historically leaned lower and brought sharp swings.

What is the seasonal pattern for Silver (SI)?
Silver has fallen in 7 of 8 midterm-election-year windows starting around Apr 29, with an average 8.97% gain in winning years for the short side.
Key takeaways
- 7-for-8 record in this window for short positions, with an average 8.97% move in winning years and 8% across all years.
- The upcoming 108-day Silver trading window begins Apr 29 and covers the last 8 midterm election years in the presidential cycle.
- Percent Profitable stands at 88%, with 7 winners and 1 loser for the short-side seasonal pattern.
- Avg Profit reflects winners only at 8.97%, while Avg Profit - All, which includes the lone losing year, comes in at 8%.
- Historical excursions show sizable swings, with strong favorable moves for shorts but also deep adverse drawdowns in some years.
- With Silver currently around $73 after a volatile year, this midterm-year seasonal stretch has often marked a regime shift in price behavior.
According to historical data from TradeWave.ai, this late-April window has behaved very differently from an average summer for Silver, and the next iteration is less than a month away.
How has Silver (SI) traded in the late-April midterm-year window?
Silver has declined in 7 of the last 8 midterm-election-year windows that start around Apr 29 and run for 108 trading days, with the short side averaging an 8.97% gain in winning years. Today the front-month contract sits at $73.345, up 3.9% on the session, and roughly 39.8% below its 52-week high of $121.785.[1] That combination of a strong historical bearish seasonal pattern and a market still digesting last year’s spike makes this upcoming window hard for macro traders to ignore.
Because this pattern is grouped by the presidential election cycle, it only looks at the last 8 midterm election years rather than every calendar year. That matters for Silver because midterm years often coincide with shifting fiscal priorities, regulatory debates and liquidity changes that can ripple through industrial metals tied to technology and infrastructure spending.
Historically, the trade direction for this window has been short, meaning years where Silver drifted lower or sold off were the “good” outcomes for the pattern. Across those 8 midterm-year samples, 7 produced profitable short trades and only 1 ended higher, giving the window an 88% success rate for shorts. The average move in winning years was 8.97% in favor of the short side, while including the lone losing year pulls the all-years average to 8%.
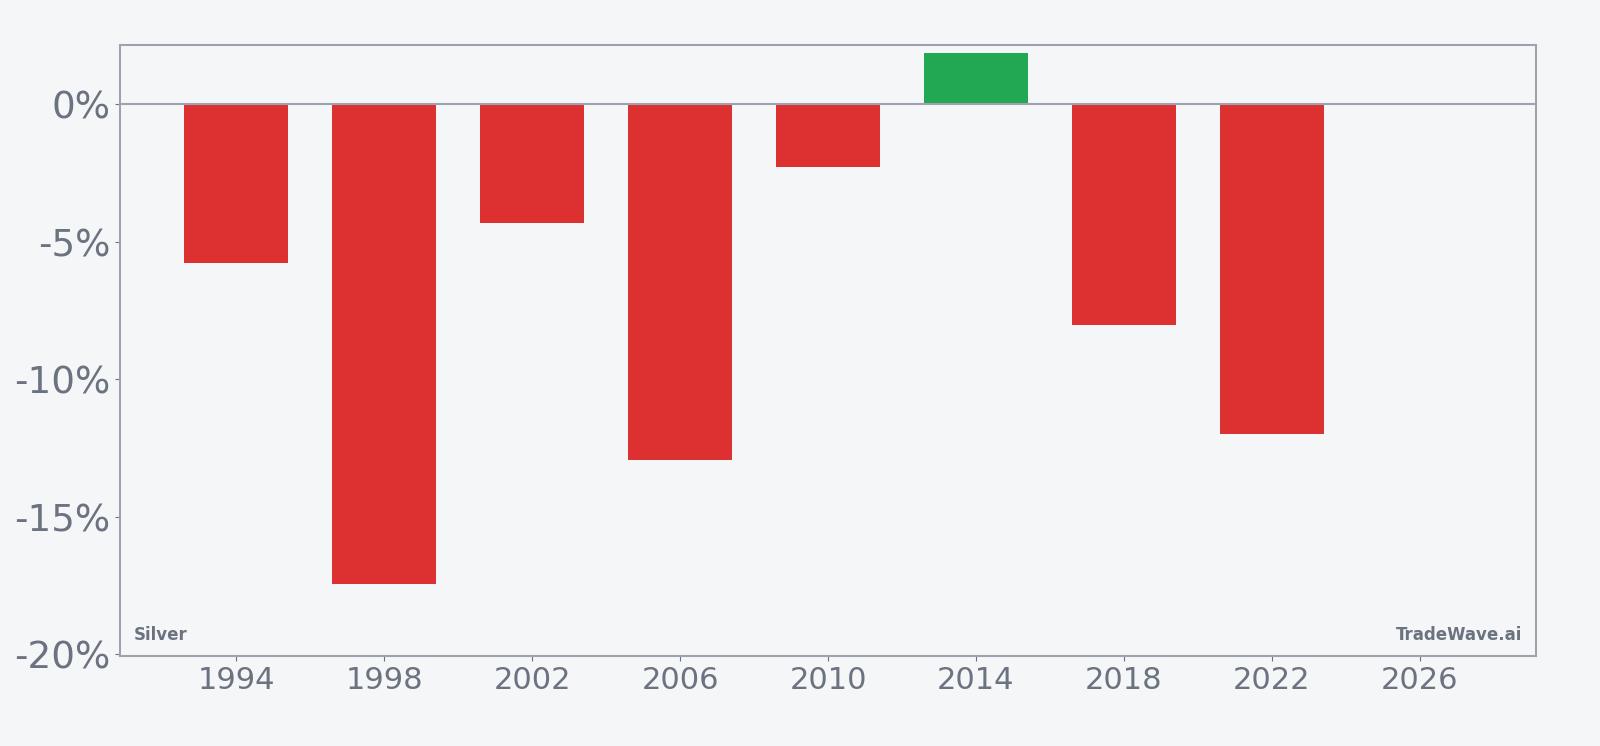
The per-year table shows how uneven those outcomes have been. In 1998, for example, Silver dropped 17.47% from entry to exit during this window, while 2006 saw a 12.93% decline and 2022 delivered an 11.99% slide. The one losing year for shorts was 2014, when Silver rose 1.88% over the window, turning that cycle into a small loss for the pattern.
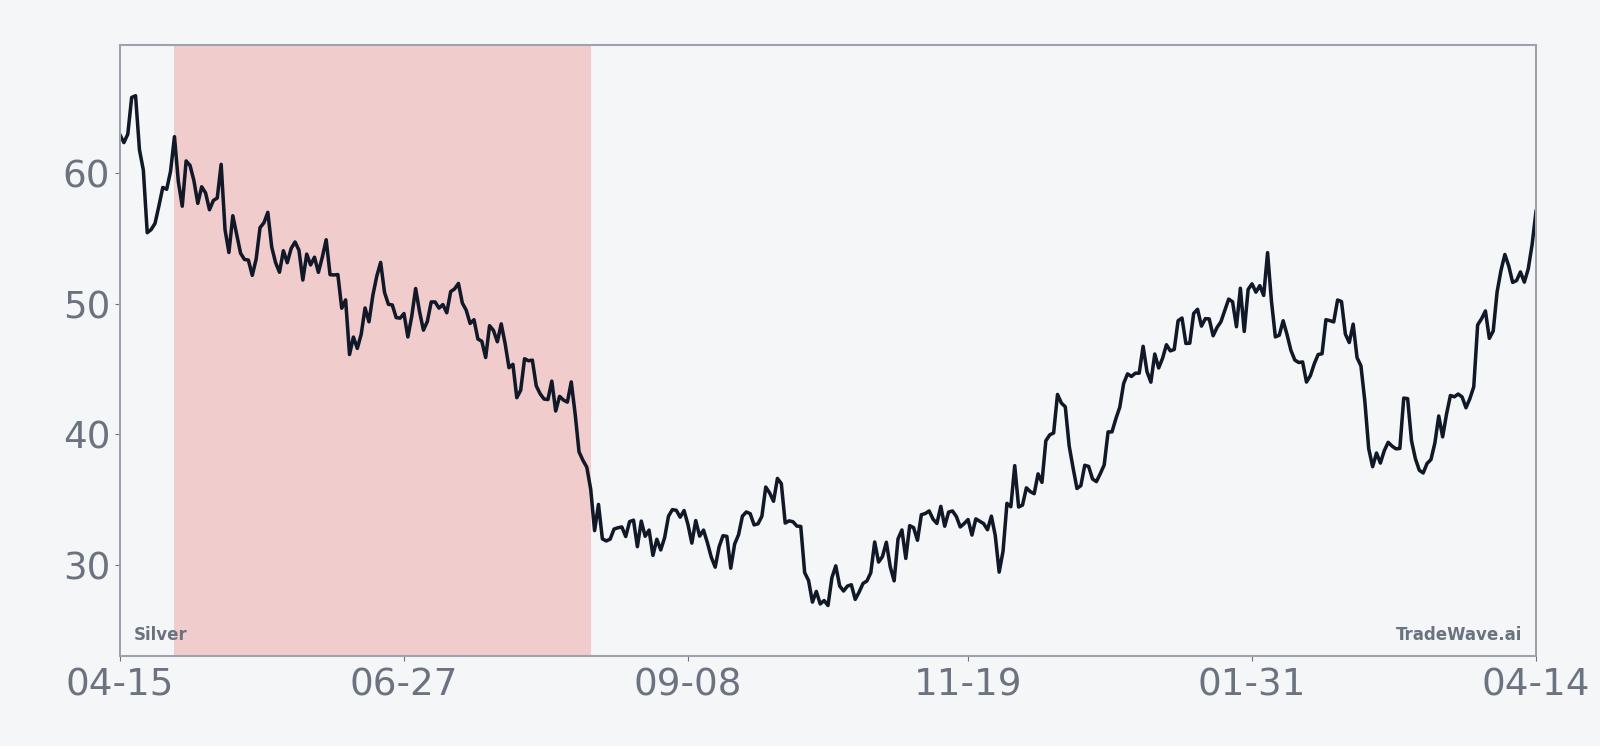
The historical seasonal trend line suggests that weakness for Silver in this window has often built gradually rather than collapsing all at once. The average path shows rallies early in the period that fade into a more persistent grind lower, which fits a pattern of early optimism around growth and policy that later runs into tighter financial conditions or softer demand.
A closer look at yearly net returns alongside best and worst intraperiod swings shows how far Silver has tended to travel before the window closes.
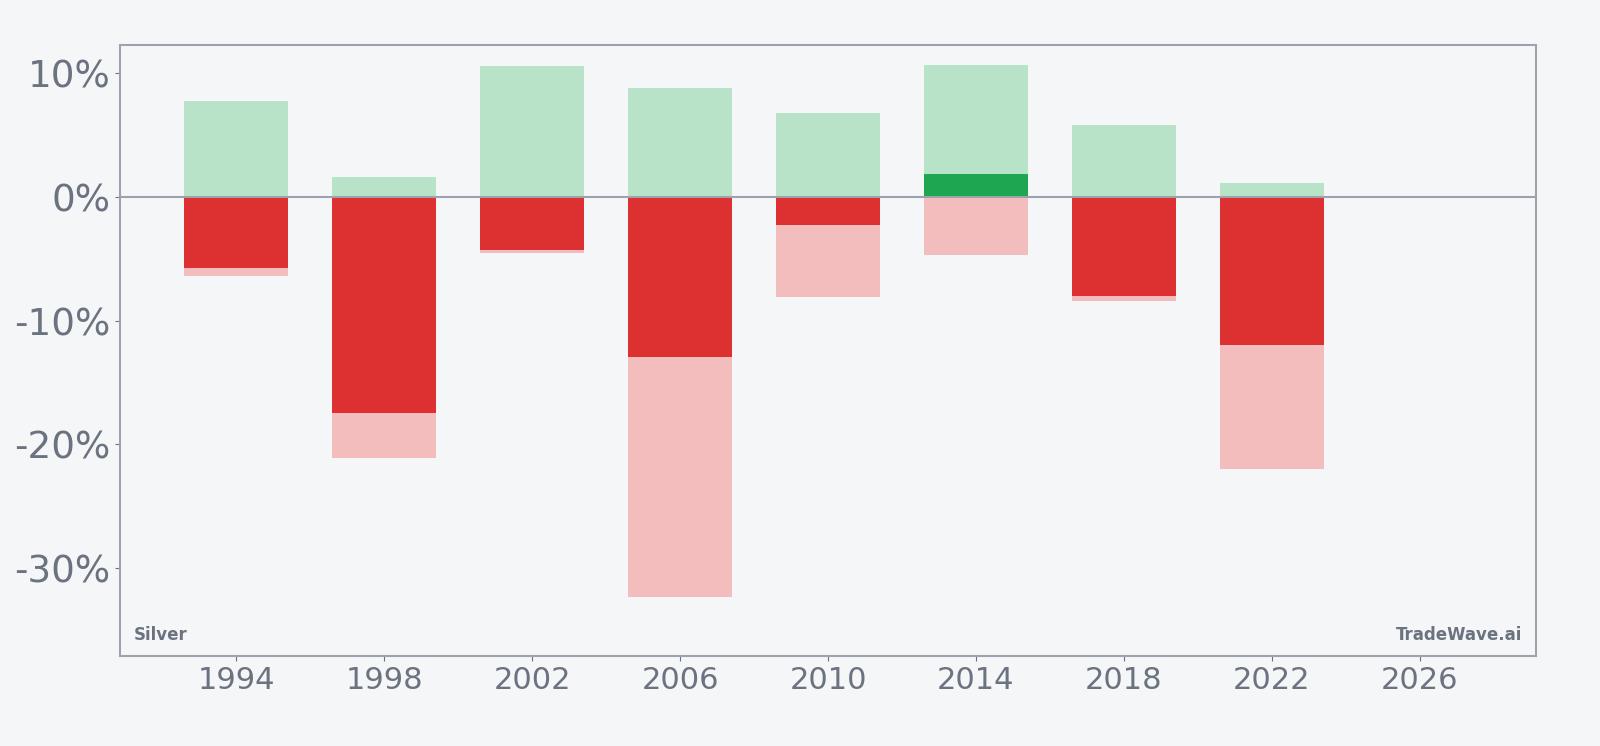
The stacked net, maximum favorable move and maximum adverse move bars underline how volatile this Silver trading window can be. In 2006, for instance, the short side ultimately finished with a 12.93% gain, but the worst intraperiod drawdown against that position reached 32.33%, while the best run in favor of the short was 8.84%. In 1994, the short trade ended up 5.78% but still saw a 6.37% adverse move at one point, showing that even winning years have demanded a strong stomach.
History does not guarantee future results; adverse excursions (MAE) can be large even in winning windows.
Why does Silver (SI) follow this seasonal pattern?
This midterm-year Silver seasonal pattern may reflect a mix of commodity supply and demand seasonality and the policy calendar. One likely driver is that midterm years often bring budget debates and shifting expectations for infrastructure and technology spending, which directly affect industrial demand for Silver tied to semiconductors and AI hardware. At the same time, positioning built up during the pre-election and election years can unwind as traders reassess growth and liquidity, creating a tendency for prices to soften in this specific late-spring and summer stretch.
What is driving Silver (SI) today?
Silver futures closed at $73.345 on Mar 30, up 3.9% on the day, after a choppy month that left the contract down 14.4% over the past 30 days and well below its 50-day moving average of $80.498.[1] That pullback comes after a powerful run in late 2025, when Silver surged above $60 as traders scrambled for exposure to AI and digital-economy demand, and then eased back as some of that frenzy cooled.[2][3] The contract’s 20-day average volume of about 33,000 contracts points to active but not extreme participation, suggesting the market is still digesting last year’s spike rather than chasing a fresh breakout.[1]
The chart below situates the latest move in its recent multi-month context, including a 60-day seasonal projection overlay.
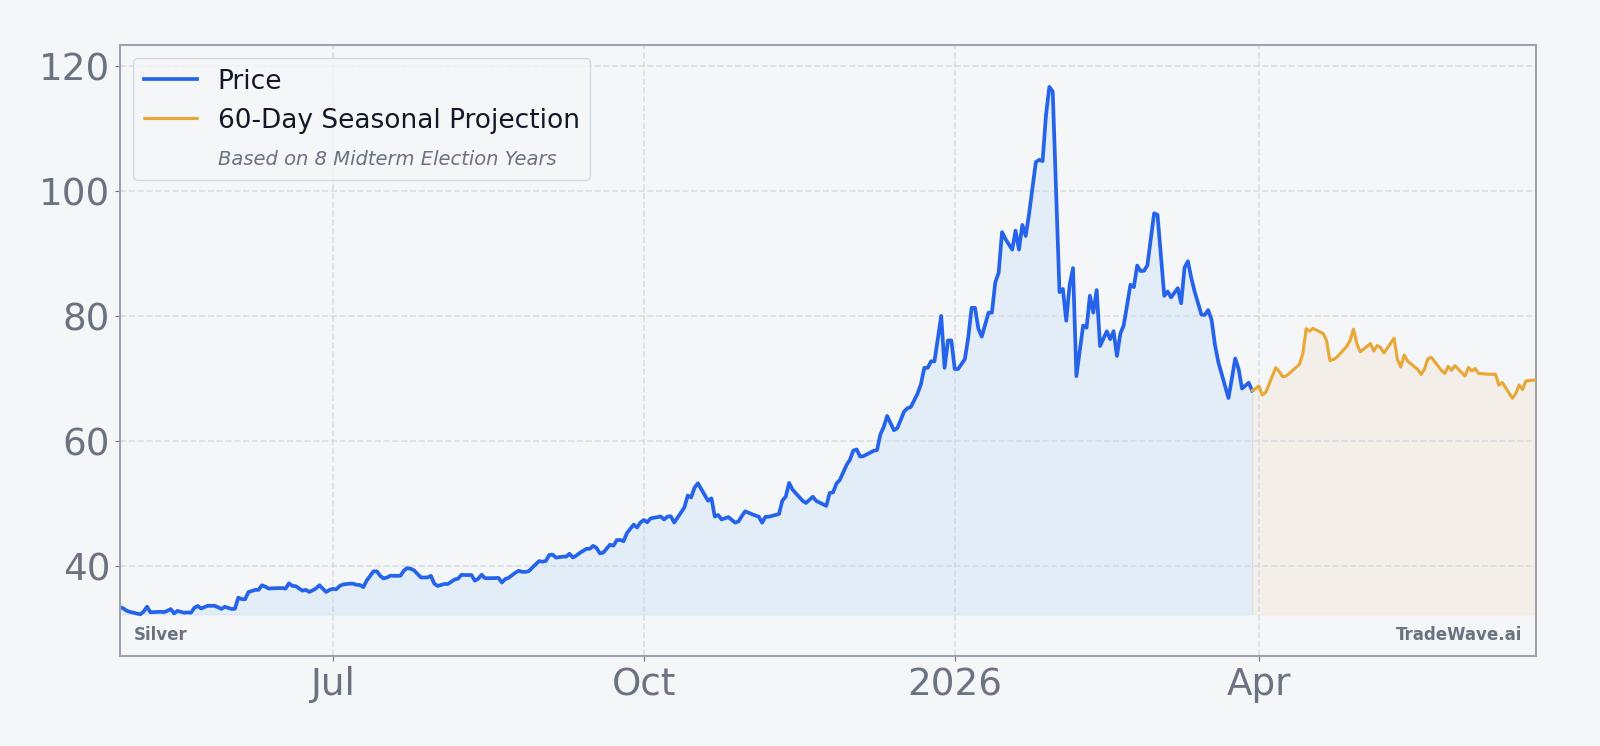
In Dec 2025, Silver rallied roughly 33% as investors focused on its role in AI infrastructure, data centers and advanced electronics, a move that left inventories tight and fueled talk of a supply crunch.[2][3] By late December, prices began to ease as profit-taking set in and some of the most aggressive short-squeeze dynamics faded, but the broader narrative of Silver as a critical input for the digital economy has not gone away.[2][3] That backdrop means any renewed volatility in the upcoming seasonal window could spill over into semiconductor and technology-equipment names that are sensitive to input costs.
From a macro standpoint, Silver now sits in a kind of no-man’s land: far off its 52-week high, but still elevated versus the sub-$40 levels seen earlier in the cycle.[1] With the Federal Reserve still balancing inflation control against growth and fiscal policy debates heating up ahead of the next presidential election, traders are watching whether industrial metals like Silver start to price in slower capex or another leg of AI-driven demand. The historical midterm-year seasonal pattern suggests that this late-April to summer stretch has often been when that optimism has met reality.
What should traders watch in this upcoming Silver (SI) window?
The first marker is timing. The 108-day window begins on Apr 29, so price action in the next few weeks will set the starting point for any seasonal move. If Silver continues to rebound toward its 50-day moving average near $80 into the start date, the historical pattern suggests that rallies during the window have often been sold rather than extended.
Second, levels matter. On the upside, the $80 area lines up with the 50-day average and a band where prior rallies have stalled, while on the downside, traders will be watching how the contract behaves if it revisits the high-$60s zone that marked recent support.[1] In prior midterm-year windows, the strongest short-side years have seen Silver break through early support and trend lower, while the lone losing year for shorts held those floors and squeezed higher into the back half of the window.
Third, volatility inside the window will be as important as the final outcome. The historical maximum favorable and adverse moves show that even in years where the short side ultimately won, Silver often staged sharp countertrend rallies before rolling over. Traders will be watching whether intraday and intraweek swings expand again as the window progresses, especially around policy headlines, central-bank meetings and any fresh data on AI-related capex or industrial demand.
Finally, behavior relative to the historical script will be a tell. If Silver grinds lower through the window with rallies being sold and downside excursions building, that would line up with the 7-of-8 track record for shorts. If instead the contract stabilizes, holds key support and starts to build a base despite the seasonal headwind, that would signal that the AI and digital-economy demand story is overpowering the usual midterm-year pattern. Either way, this is one of the more statistically distinctive Silver trading windows on the calendar, and the way it plays out will offer a clean read on how much seasonality still matters in a market reshaped by technology demand.
Sources
About this seasonal analysis
Seasonal pattern data is sourced from TradeWave.ai, which analyzes historical price behavior across annual calendar windows going back up to 30 years. Read the full data methodology or the book The 100-Year Pattern by Afshin Moshrefi (2026 edition). Past performance of seasonal patterns does not guarantee future results. This article is for informational purposes only and does not constitute investment advice.