Live Cattle (LE) Has Dropped in 10 of 10 Midterm Springs, Averaging 6.54% Short Profits
Live Cattle is pressing against its 52-week highs just as a historically bearish midterm-year seasonal window for the contract approaches.
What is the seasonal pattern for Live Cattle (LE)?
Live Cattle has fallen in 10 of 10 midterm-year spring windows during this 51-day pattern, with an average 6.54% gain for short positions in winning years.
- 10 for 10 in this window, with short trades averaging 6.54% profit in winning years across the last 10 midterm election cycles.
- The upcoming 51-day Live Cattle trading window starts Apr 10, 2026 and has historically favored downside moves for prices.
- Percent Profitable is 100%, with 10 winners and 0 losers for the short-side pattern in this specific election-cycle slice.
- Average annualized return across the window is 6.47% for shorts, with a Sharpe ratio of 1.47 indicating strong risk-adjusted results.
- The TradeWave Ratio of 1.97 signals that Live Cattle typically travels meaningfully in the trade direction during this window, even before final settlement.
- Individual years have seen adverse moves against the short as deep as roughly 19.56% intraperiod, underscoring meaningful drawdown risk even in a perfect win record.
According to historical data from TradeWave.ai, this midterm-year spring stretch in Live Cattle has behaved very differently from an average month on the calendar. The next section walks through what that election-cycle seasonality has looked like in practice, without making any prediction about 2026.
How has Live Cattle (LE) traded in this midterm-year spring window?
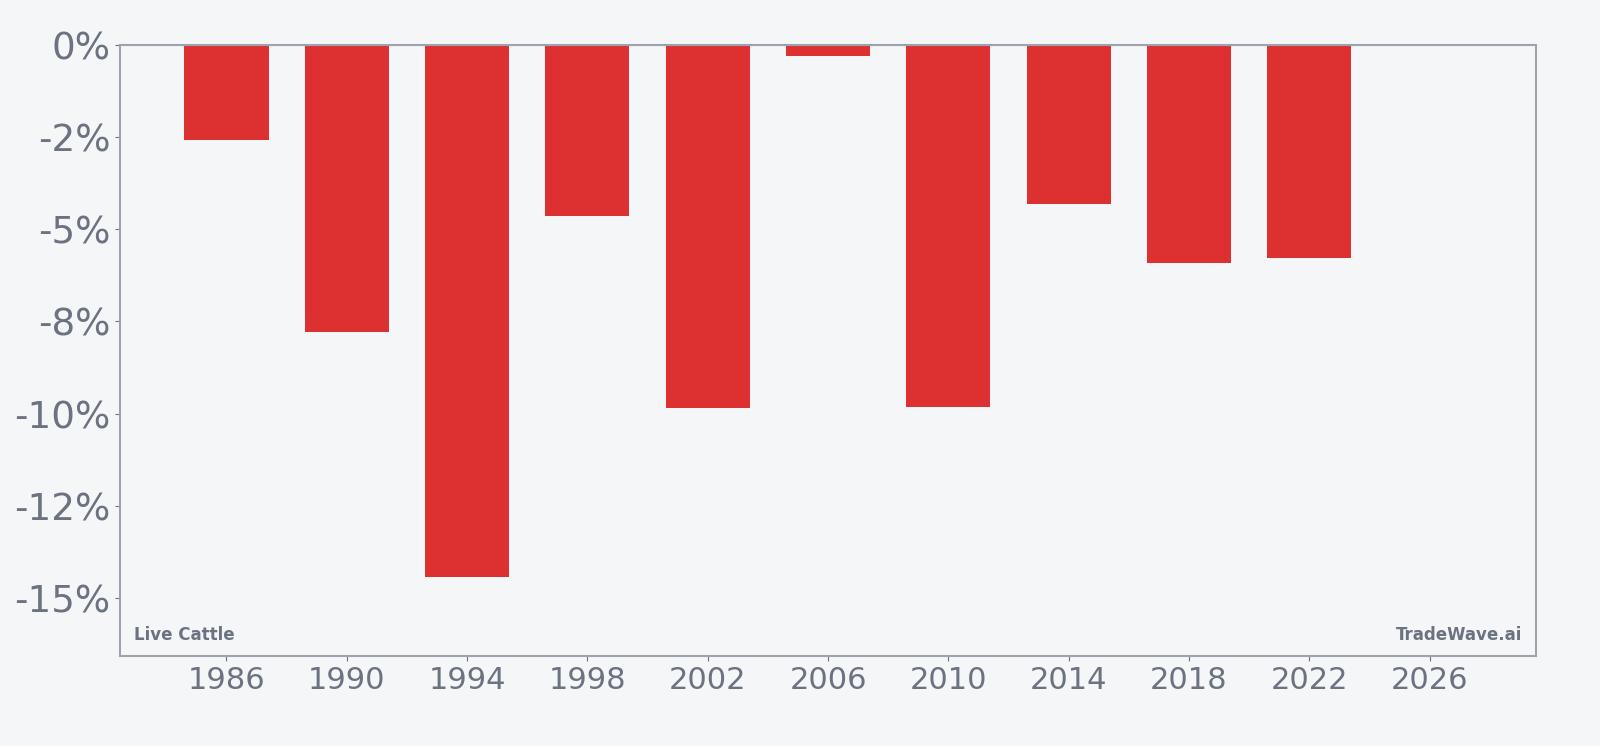
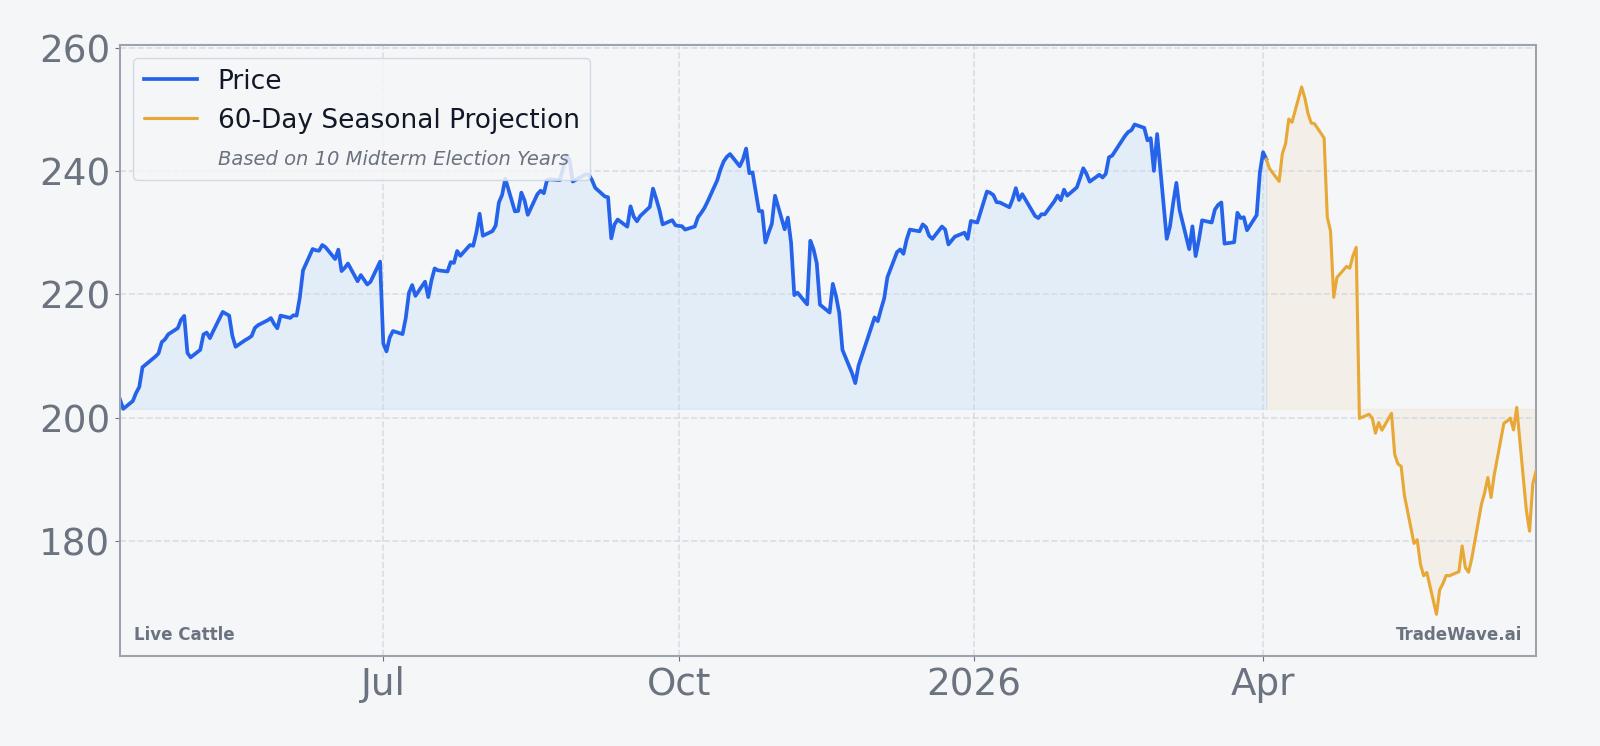
Live Cattle has dropped in every one of the last 10 midterm election years during this 51-day spring window, delivering a cumulative 87% gain for short positions. The next iteration begins on Apr 10, 2026, with the contract currently at 246.2, about 0.6% below its 52-week high of 247.75 and sitting near the top of its recent range. That combination of a clean 10-for-10 historical record and prices pressing resistance gives this Live Cattle seasonal pattern unusual weight heading into the heart of the midterm year.
Grouping the data by the presidential election cycle matters here because this window only looks at the last 10 midterm election years, not at every calendar year. Midterm years often bring policy uncertainty around farm bills, trade and regulation, which can distort normal supply and demand rhythms in agricultural futures and create repeatable pockets of volatility.
Historically, the short-side bias in this Live Cattle trading window has been clear. Percent Profitable sits at 100%, with 10 winners and 0 losers, and average profit per winning year is 6.54% for shorts. The annualized return of 6.47% and a Sharpe ratio of 1.47 show that the pattern has not just been directional but also relatively efficient on a risk-adjusted basis for this specific 51-day slice.
The per-year table shows how that has played out in individual cycles. The strongest year for the pattern was 1994, when Live Cattle fell 14.42% from entry to exit during the window, while the weakest winning year was 2006, which still delivered a 0.31% decline in prices from entry to close. Even in softer years like 1986 and 1998, the contract finished the window lower, preserving the perfect record for shorts.
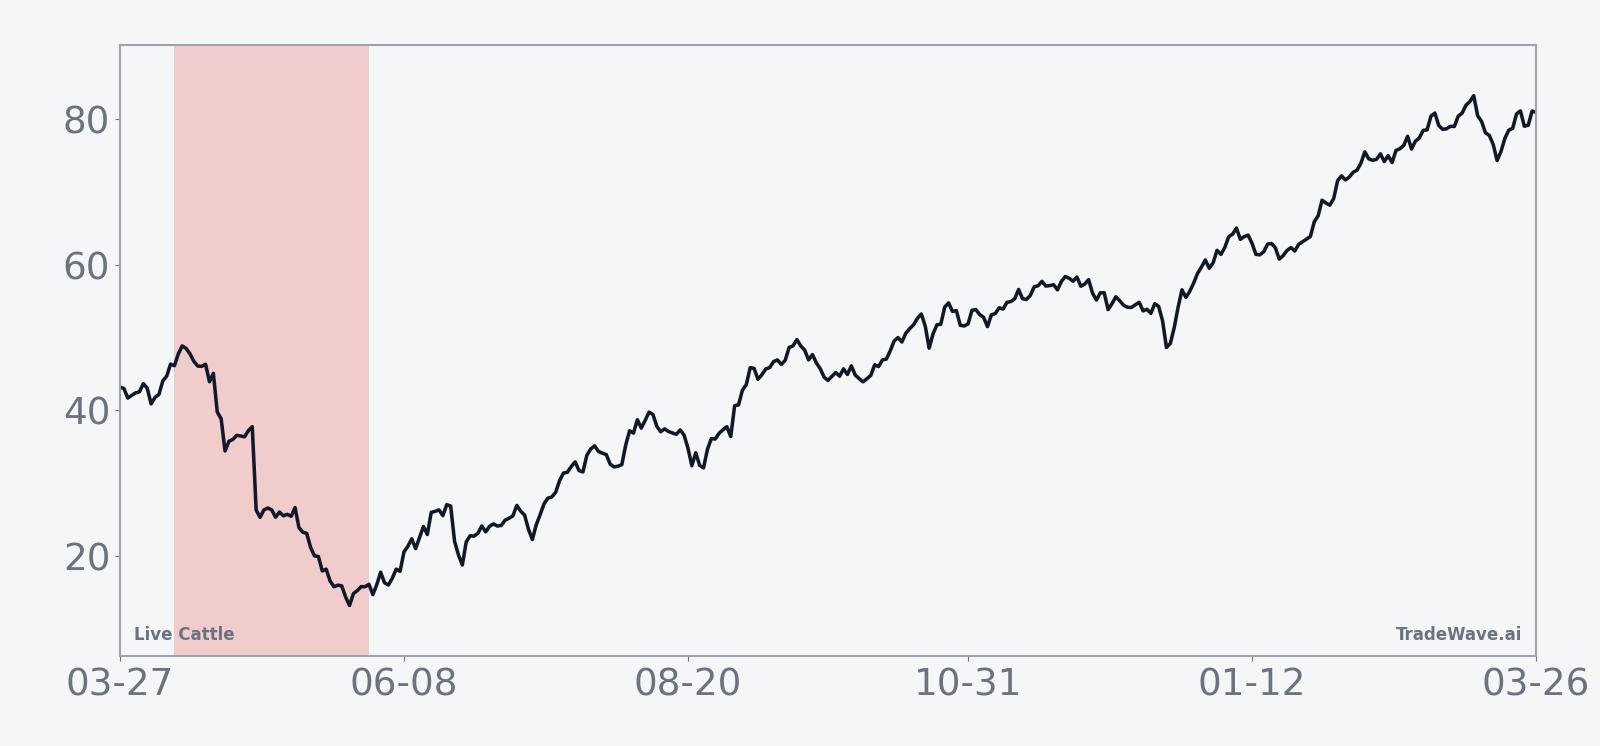
The historical seasonal trend line suggests that much of the typical downside for Live Cattle in this window has tended to accrue steadily rather than in a single air pocket. The average path slopes lower across the 51 days, with only modest mid-window countertrend rallies, which fits a grind-lower profile rather than a crash pattern.
A closer look at yearly net returns alongside peak rallies and drawdowns shows how much Live Cattle has moved inside the window before settling.
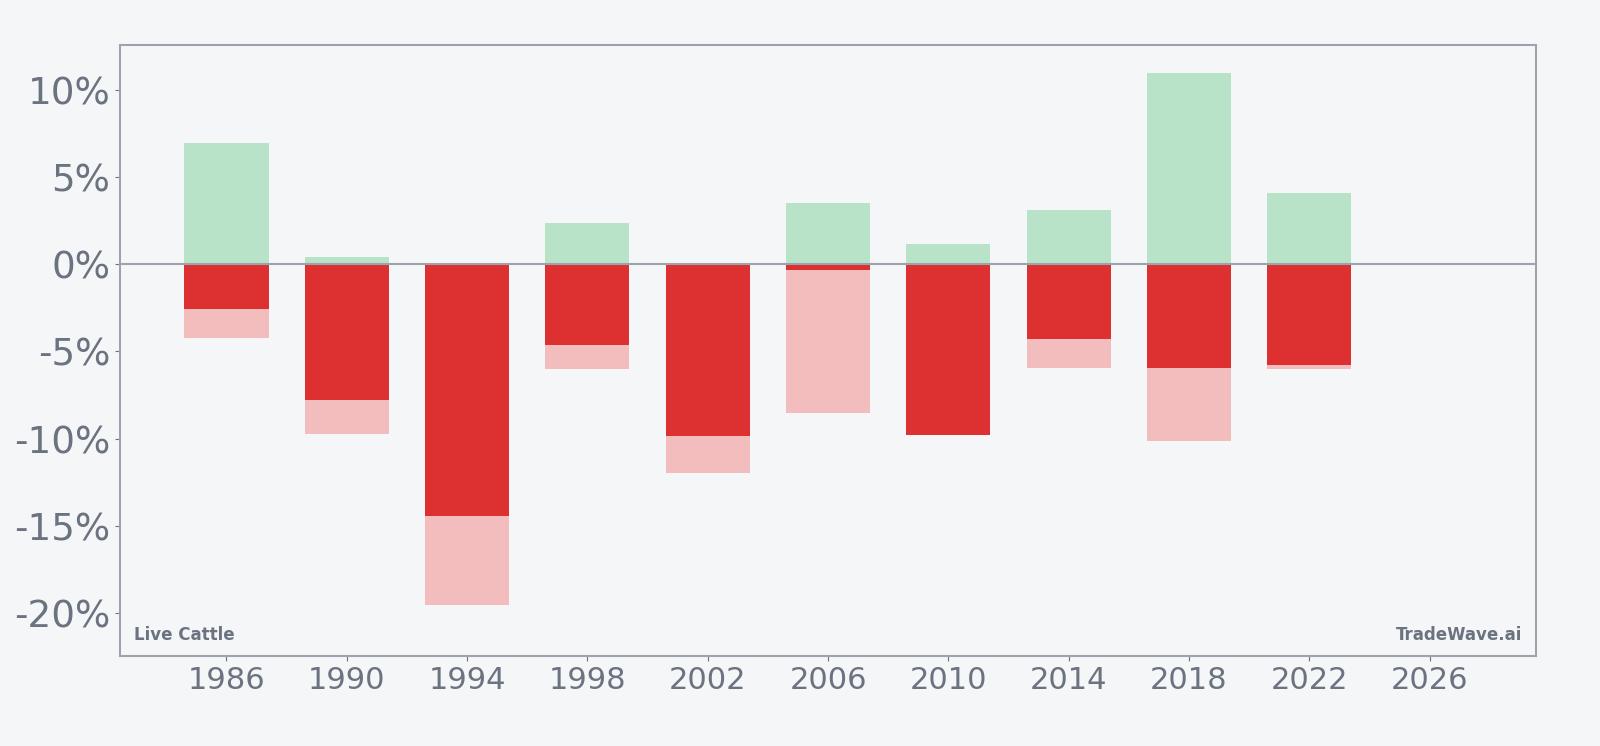
The combined net, maximum favorable excursion and maximum adverse excursion view shows why this pattern has mattered to risk managers. In strong years like 1994 and 2002, Live Cattle barely rallied at all after entry and instead slid quickly, with maximum adverse moves against the short of roughly 19.56% and 11.97% respectively before the window closed. Other years, such as 2018, saw sizeable intraperiod rallies of up to 10.95% against the short before prices ultimately rolled over, a reminder that even a perfect win record has come with sharp squeezes along the way.
History does not guarantee future results; adverse excursions can be large even in winning windows, and Live Cattle has often staged double-digit rallies inside this pattern before finishing lower.
Why does Live Cattle (LE) follow this seasonal pattern?
One likely driver is the way the U.S. cattle and beef supply chain lines up with the policy calendar in midterm election years. Analysts have pointed to a mix of spring pasture conditions, feed cost visibility and government program decisions that often become clearer by early summer, which can trigger herd and hedging adjustments in this window. The pattern may also reflect how packers and large buyers manage price risk ahead of the grilling season when consumer demand peaks but policy and weather uncertainty are still high.
What is driving Live Cattle (LE) today?
Live Cattle futures settled at 246.2 on Apr 3, up 0.88% on the day and sitting just 0.6% below the 52-week high of 247.75, with the contract also well above its 50-day moving average of 237.88 on solid volume of 29,098 contracts. The front month is up 3.22% over the past month, a firm backdrop that leaves prices elevated relative to the 52-week low of 197.75 and keeps beef costs in focus for restaurant chains and retailers that hedge cattle exposure.[1]
The chart below situates the latest move in its recent multi-month context, alongside a 60-day seasonal projection path.
In Nov 2025, Live Cattle prices were reported to be roughly 13% to 15% off their mid-October highs, easing some pressure on restaurant operators but still elevated versus 2020 levels as drought and tight U.S. cattle inventories constrained supply.[1] That backdrop of high but volatile beef costs has kept Live Cattle central to the broader agriculture and consumer inflation story, with policy proposals around imports and meatpacker practices discussed as potential swing factors for the complex.[2]
For traders, the tension is clear. The contract is in a strong uptrend into early April, yet the historical seasonality for midterm years points to a 51-day stretch where prices have repeatedly softened. If Live Cattle were to stall or reverse near current highs as the window opens, it would fit the established LE seasonal trend; a decisive breakout through the 52-week high and sustained strength into late May would mark a rare departure from the pattern.
Sources
About this seasonal analysis
Seasonal pattern data is sourced from TradeWave.ai, which analyzes historical price behavior across annual calendar windows going back up to 30 years. Read the full data methodology or the book The 100-Year Pattern by Afshin Moshrefi (2026 edition). Past performance of seasonal patterns does not guarantee future results. This article is for informational purposes only and does not constitute investment advice.