Despite 70-Year-Low Herds, Live Cattle (LE) Faces a Historically Weak Midterm Spring
Live Cattle is hovering near recent highs just as a 52-day midterm-year seasonal window with a perfect record of downside for shorts comes into view.
Key takeaways
- A 52-day seasonal window for Live Cattle starting Apr 9 has produced declines in all 10 midterm election years in the sample, favoring short exposure.
- The pattern is 100% profitable for shorts, with 10 winners and 0 losers and an average gain of 6.66% in the trade direction.
- Live Cattle last settled at 234.825, up 0.17% on the day and about 5.2% below its 52-week high of 247.75, leaving room for a pullback within the historical range.
- The TradeWave Ratio of 1.89 signals that price has typically traveled meaningfully in the short direction during this window, while the Sharpe ratio of 1.38 points to strong risk-adjusted results.
- Intraperiod swings have been real: in the weakest year for shorts, prices still rallied as much as 7.77% before reversing, and adverse moves have reached nearly 20% in the best short year.
- With cattle supplies historically tight and beef still a key inflation input, any seasonal softening in Live Cattle could ripple into restaurant margins and food inflation gauges.
According to historical data from TradeWave.ai, this upcoming midterm-year stretch in Live Cattle has behaved very differently from an average spring, with a clear directional bias that traders often overlook.
Seasonal window
Live Cattle has declined in all 10 midterm election years during this 52-day spring window, with shorts averaging a 6.66% gain in the trade direction. The next iteration begins on Apr 9, with the contract trading at 234.825 on Mar 26, up 0.17% on the day and sitting about 5.2% below its 52-week high of 247.75. That combination of a strong historical short pattern and prices still near the upper end of the past year’s range gives this window more bite than a typical seasonal quirk.
The pattern is built on the last 10 midterm election years, a phase of the presidential cycle that often brings policy uncertainty and shifting expectations for food inflation. Grouping by the election cycle matters here because beef is politically sensitive: midterm years frequently feature debates over grocery prices, trade flows and support for ranchers, which can alter demand expectations and hedging behavior in Live Cattle futures.
This seasonal window begins on Apr 9 and spans 52 trading days. Historically, during this period, Live Cattle has tended to drift lower, aligning with a short trade direction rather than a bullish setup. The trade direction is explicitly short, so years where prices fell were favorable outcomes for the pattern, while any sharp rallies represented losing environments for shorts.
Across those 10 midterm-year windows, the pattern has been 100% profitable for shorts, with 10 winners and 0 losers. Average profit in the trade direction is 6.66%, meaning that in a typical year, a short entered at the start of the window and held to the end would have captured a mid-single-digit percentage decline in the contract. Because there are no losing years in this sample, the all-years average of 7% is effectively the same story: every instance has delivered net downside for prices by the close of the window.
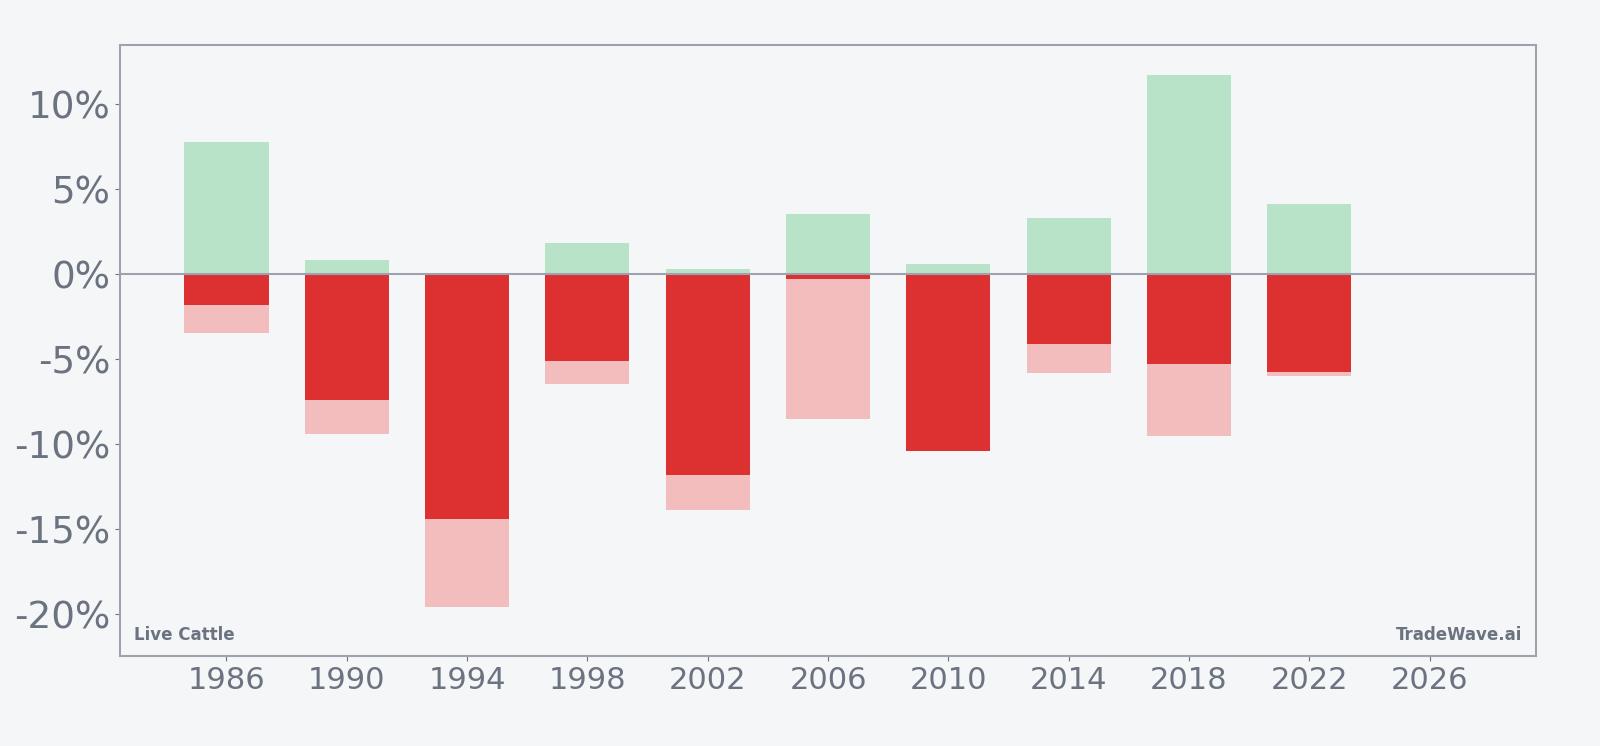
The per-year table shows how that plays out in individual cycles. The strongest year for shorts was 1994, when Live Cattle fell 14.42% from entry to exit, with the worst intraperiod drawdown for shorts reaching 19.56% in the trader’s favor. On the other side, 1986 was the softest win, with a 1.82% net decline by the end of the window and a maximum favorable move of 7.77% before prices partially retraced. Even that mild year still finished in the red for prices, which is why the win rate remains perfect.
Intraperiod swings have been meaningful. Maximum favorable excursions, the best point-to-peak move in the short direction within each window, have ranged from roughly 0.26% to 11.71%. Maximum adverse excursions, the worst drawdown against the short, have stretched as far as 19.56% in 1994 and around 13.89% in 2002. In plain English, shorts have usually been rewarded, but they have had to sit through some sharp countertrend rallies along the way.
The TradeWave Ratio (TWR) for this pattern is 1.89. TradeWave Ratio (TWR) reflects how far price typically travels in the trade direction within the window regardless of the final close. A value near 2 suggests that Live Cattle often makes a sizable move lower at some point during the window, even in years where the final close-to-close decline is more modest.
The Sharpe ratio of 1.38, calculated on end-of-window outcomes, points to strong risk-adjusted performance for the short side across these midterm-year springs. Standard deviation of 4.43% indicates that results have clustered reasonably tightly around the average, rather than being driven by a single outlier year. Add it up: 10 for 10 wins, mid-single-digit average declines and a solid Sharpe make this one of the cleaner short-biased seasonal windows in the Live Cattle calendar.
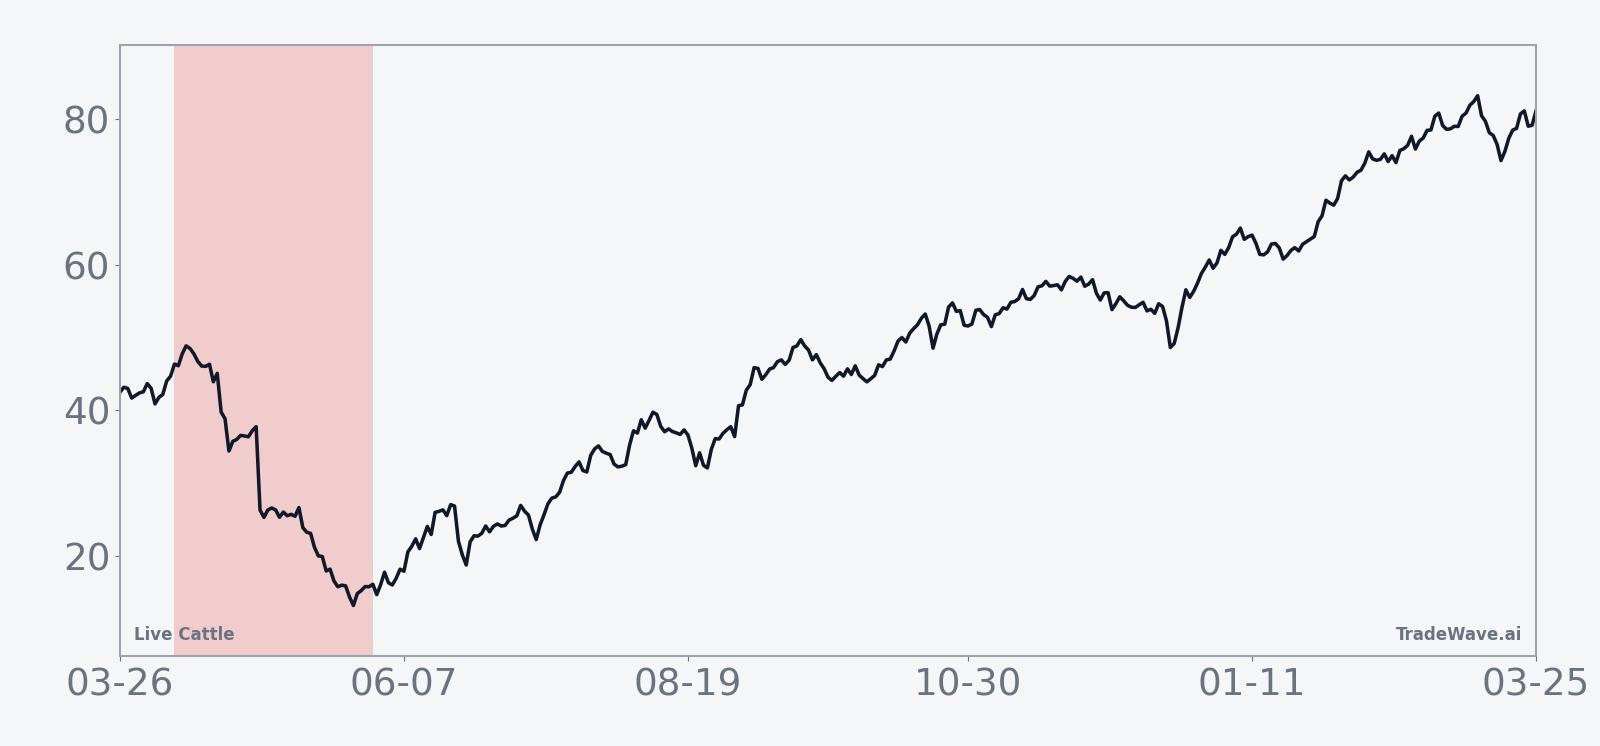
The historical seasonal trend chart for this window shows that most of the downside has tended to accrue in the middle of the 52-day stretch rather than right at the start. Early days often feature choppy price action, with shorts moving into profit as the window progresses and then stabilizing toward the end. That timing nuance matters for traders who care about path, not just destination.
Year-by-year bars with maximum favorable and adverse moves show how consistently shorts have worked, and how large the swings have been inside the window.
History does not guarantee future results, and adverse excursions within the window can be large even in years that ultimately finish in the pattern’s favor.
Price and near-term drivers
Live Cattle futures last settled at 234.825, up 0.4 points or 0.17% on the session, with intraday trade between 232.50 and 235.20 on volume of 15,468 contracts. That leaves the contract about 5.2% below its 52-week high of 247.75 and well above the 52-week low of 197.75, with prices also sitting slightly under the 50-day moving average of 236.996 and trading below the 20-day average volume of 24,263 contracts.
Over the past month, Live Cattle is down 0.91%, a modest pullback that comes after a powerful multi-quarter run driven by historically tight supplies. U.S. cattle inventory is at its lowest level since 1951, a structural squeeze that has kept beef prices elevated even as other food categories have cooled.[1] Cattle supplies are described as the lowest in roughly 70 years, with droughts and heifer retention expected to keep the market tight through at least 2026 and 2027, limiting how far prices can fall without a demand shock.[1]
That supply backdrop has made Live Cattle a key input into the broader inflation story. Tight cattle supplies and strong beef demand have supported menu prices at steakhouses and fast-casual chains, even as some operators look for ways to protect margins. In Nov 2025, for example, CNBC highlighted how a major casual-dining chain was wrestling with high beef costs while still delivering on what it could control, underscoring how Live Cattle futures filter directly into corporate P&L decisions.[1]
Policy talk has occasionally focused on ways to ease beef prices, including ideas such as increasing imports. Analysts have questioned how much relief such measures can deliver in the face of biological constraints like low herd inventory and long production cycles, which limit how quickly supply can respond.[1] That tension between political pressure for cheaper beef and the slow-moving nature of cattle supply is part of what makes the midterm election year a distinctive phase for this market.
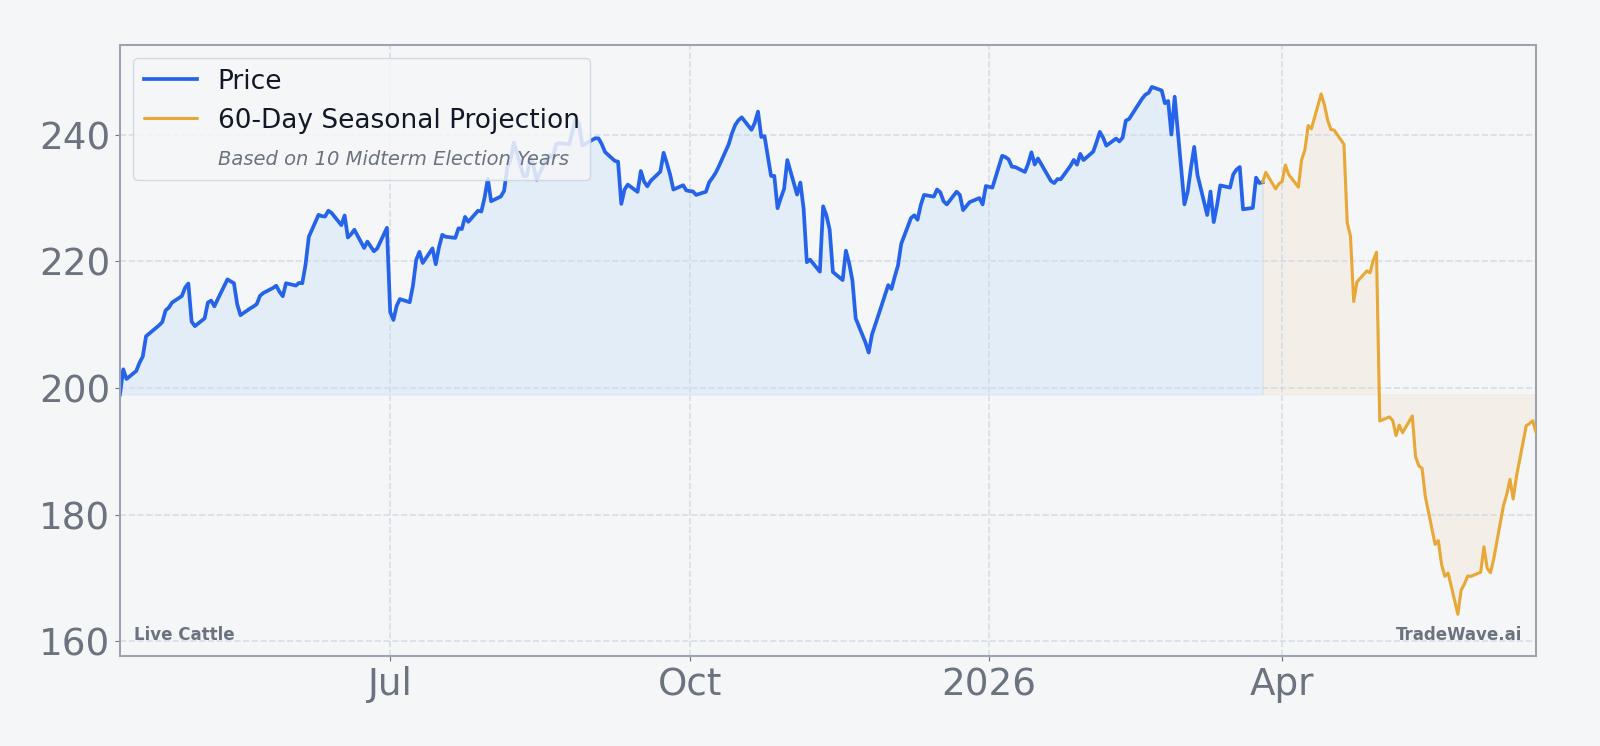
The chart below situates the latest move in its recent multi-month context, alongside a 60-day seasonal projection that reflects the historical midterm-year pattern.
Macro and election-cycle backdrop
The current calendar phase is the midterm election year, which often brings a different policy tone than presidential or pre-election years. For beef, that can mean renewed focus on food inflation, trade policy and support for producers, all of which can influence hedging flows in Live Cattle. Midterm years also sit between the immediate post-election adjustment period and the historically more growth-friendly pre-election year, a transition that can shift expectations for consumer spending and restaurant traffic.
In this context, the upcoming 52-day window starting Apr 9 effectively captures the early-to-middle part of the midterm year, when Washington is debating budgets and regulatory priorities but before the campaign season fully dominates headlines. Historically, that slice of the calendar has lined up with softer Live Cattle prices in the midterm years studied, even when the longer-term trend in beef has remained firm. For traders and hedgers, the message is not that prices must fall again, but that this particular stretch has repeatedly behaved differently from the broader bull market in cattle.
What to watch as the window opens
As Apr 9 approaches, the first thing to watch is whether Live Cattle remains near the upper end of its 52-week range or starts to roll over ahead of the window. A failure to retest the 247.75 high, combined with continued trade below the 50-day moving average, would be more in line with the historical short-biased pattern. A decisive breakout to new highs, by contrast, would mark a clear departure from how prior midterm-year windows have started.
Second, monitor intraperiod volatility once the window is underway. Past cycles have featured sizable rallies against the short before the pattern ultimately resolved lower, with maximum adverse moves for shorts reaching double digits in some years. If early April and May bring sharp upside spikes that quickly fade, that would echo the historical script. A smooth, low-volatility drift higher would be a sign that this midterm-year iteration is breaking from the playbook.
Third, keep an eye on the policy calendar around food inflation and trade. Any credible moves to ease beef prices through imports or regulatory changes could reinforce the seasonal tendency toward softer Live Cattle, especially against a backdrop of already tight supplies and historically low herd numbers.[1] Conversely, signals that policymakers are backing away from aggressive action on food prices could blunt some of the pressure that has historically coincided with this window.
Finally, watch how restaurant and food retailers talk about beef costs in upcoming conference appearances and industry updates. When operators lean into menu price increases or highlight beef as a margin headwind, it can feed back into expectations for demand and hedging flows. If those conversations start to shift toward relief on beef costs during the window, it would align with the historical pattern of Live Cattle softening into midterm-year spring.