USDA Corn Supply Surprise Pressures Corn (CME) (ZC) as Bearish 130-Day Window Nears
Corn (CME) futures sit near the middle of their 52-week range as a historically bearish 130-day spring–summer window approaches, raising fresh questions about supply, stocks and price risk.
What is the seasonal pattern for Corn (CME) (ZC)?
Corn (CME) has fallen in 12 of 13 years during this April 13 to 130-day window, with an average loss of 14.06% in winning years for the short setup.
- 12-for-13 record for the short side in this window, with average winning-year declines of 14.06% and a 13% average move across all years.
- The upcoming seasonal window begins Apr 13 and runs for 130 trading days, covering the core U.S. growing and early harvest period.
- Percent Profitable stands at 92%, with 12 winning short years versus just 1 losing year across the 13-year lookback.
- Avg Profit reflects winners only at 14.06%, while Avg Profit - All, which includes the lone losing year, still shows a 13% decline.
- The TradeWave Ratio of 1.64 indicates that price has typically traveled meaningfully in the short direction within the window, even beyond the final close.
- Historical best and worst intraperiod swings show that adverse moves against shorts can be sharp, so risk management has mattered even in a strongly bearish seasonal trend.
According to historical data from TradeWave.ai, this mid-April start date has behaved very differently from an average month on the corn calendar. The next section walks through what that seasonal bias has looked like and how it frames the coming 130 trading days.
How has Corn (CME) (ZC) traded in this April–summer window?
Corn (CME) has declined in 12 of the past 13 years during the 130-day window that starts on Apr 13, with the short side averaging 14.06% gains in winning years and a 13% move when every year is included. Futures settled Tuesday at 443.5 cents per bushel, down 1.2% on the day and sitting about 9.3% below the 52-week high of 488.75 while still 20.3% above the 52-week low of 368.75. That combination of a firmly negative historical seasonal pattern and a price parked mid-range gives this year’s window extra weight for traders watching supply, stocks and weather risk.
TradeWave’s stats frame this as a clearly bearish seasonal window for corn, with a short trade direction and a 92% hit rate across the 13-year sample. The average winning-year decline of 14.06% is large for a major grain contract, and the fact that the all-years average still sits at 13% shows how little the lone losing year has dented the pattern. Median profit of 10.78% suggests that while some years have seen very deep drops, the typical outcome has still been a double-digit slide.
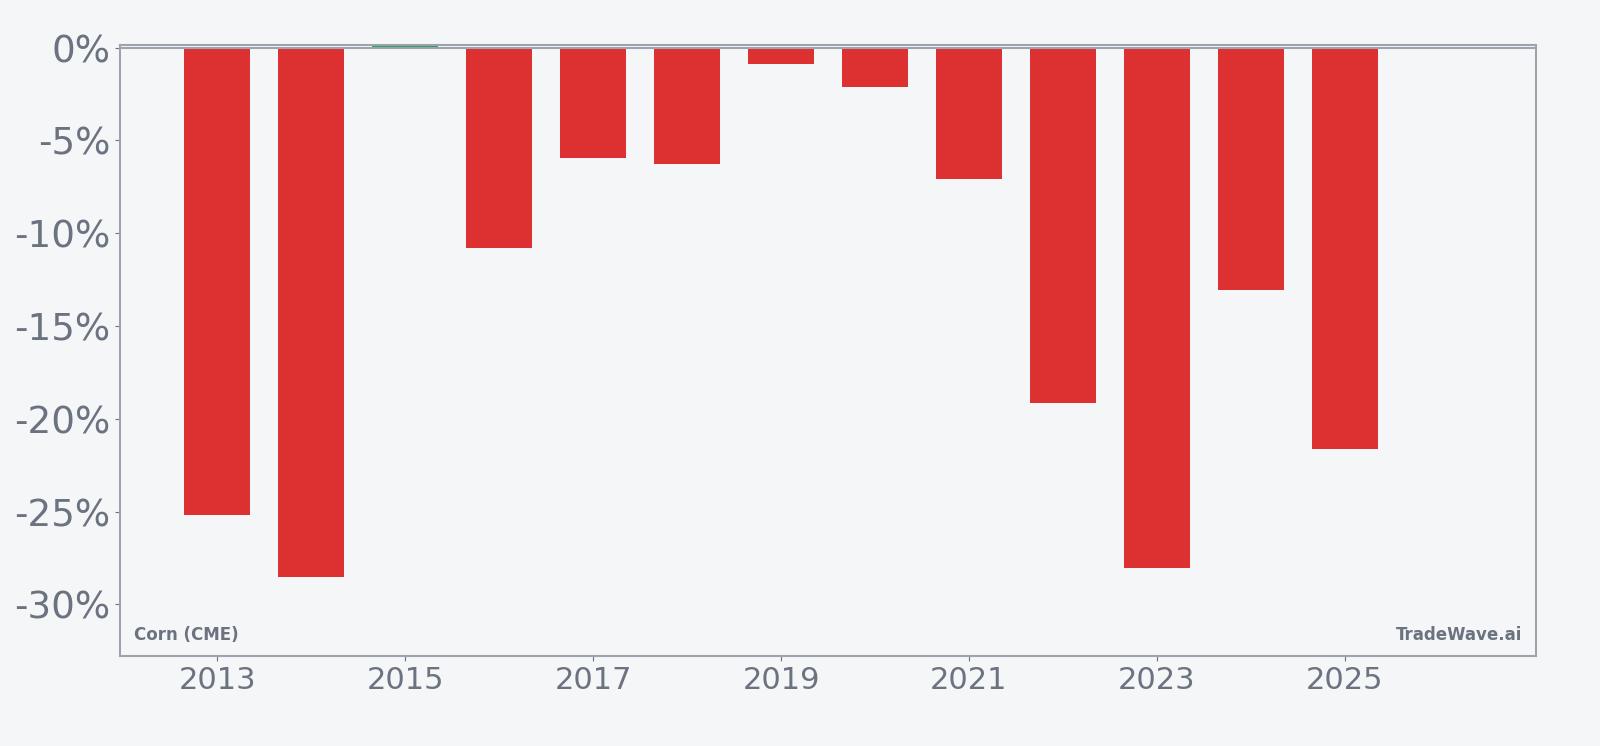
The 13-year seasonal trend chart shows that the bulk of the move for shorts has tended to accrue gradually rather than in a single air pocket. Returns often build through late spring as planting progress firms up, then extend into the heart of the U.S. growing season when weather and yield expectations become clearer. The pattern does not look like a one-day shock; it looks like a regime where rallies have repeatedly faded and lower highs have given way to lower lows.
Year-by-year bars that combine net results with best and worst intraperiod swings help clarify how much room corn has historically given both shorts and longs inside this window.
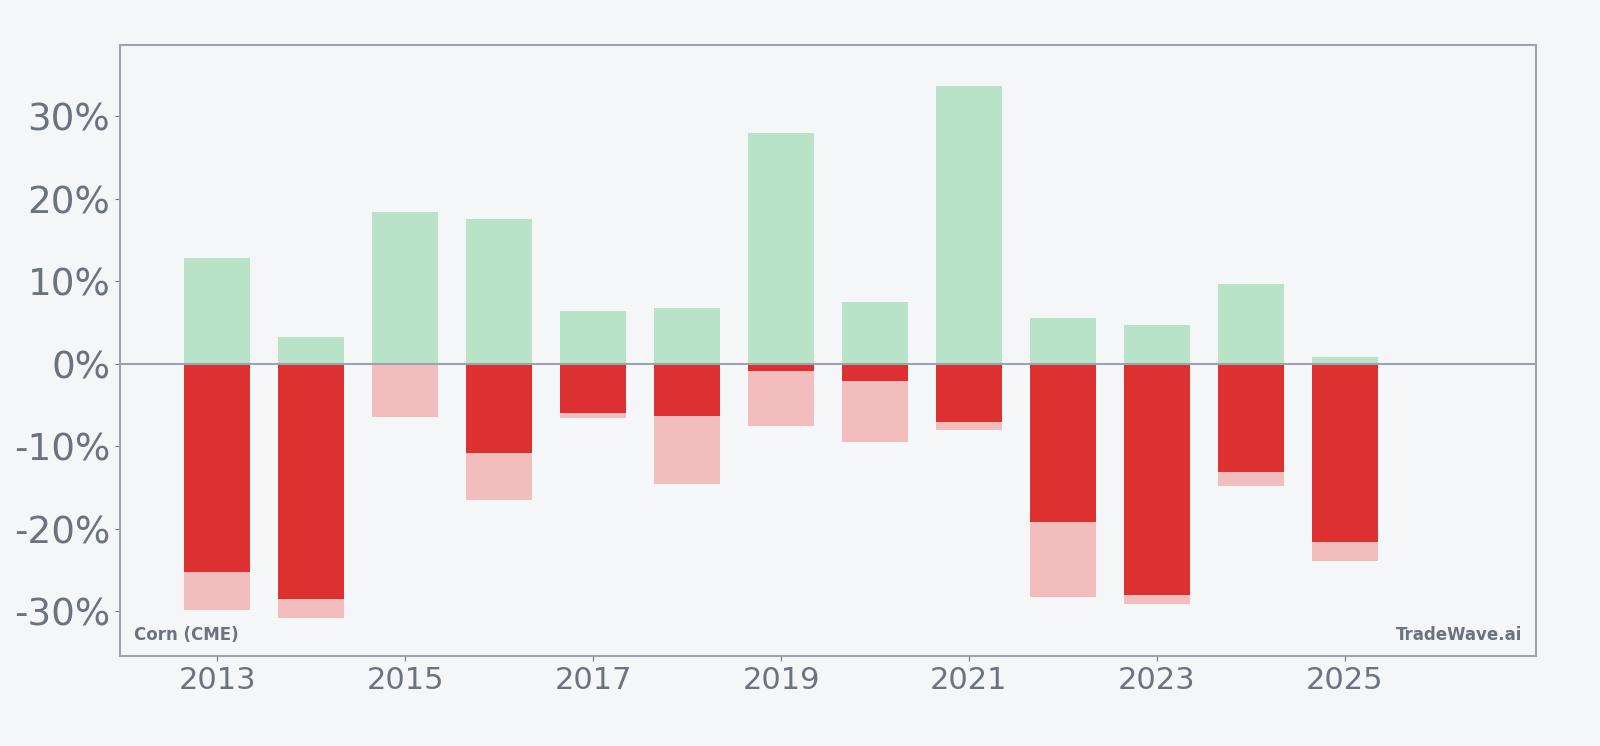
The per-year bars with maximum favorable and adverse excursions underline how volatile this window can be even when it ends lower. In 2021, for example, the short side ultimately finished with a 7.11% gain, but the best intraperiod move in favor of shorts reached 33.62% while the worst drawdown against them was 8.06%. In 2023, the short setup booked a 28.06% gain as corn fell from 652.25 to 469.25, yet there was still a 4.64% countertrend rally at one point and a 29.17% adverse swing in 2022 shows how painful squeezes have been in the rare years when weather or supply shocks hit. The TradeWave Ratio of 1.64 captures this tendency for price to travel meaningfully in the trade direction inside the window, but the MAE profile is a reminder that shorts have needed room to breathe.
History does not guarantee future results, and even in a strongly bearish seasonal window, adverse excursions against the trade can be large.
Why does Corn (CME) (ZC) follow this seasonal pattern?
This April-to-late-summer stretch lines up with the core of the U.S. planting and growing season, when supply visibility tends to improve and weather risk gradually shifts from fear to realized yield. One likely driver is that early-season uncertainty often supports prices into spring, then gives way to pressure as acreage, emergence and condition reports confirm adequate supply and higher ending stocks. Analysts also point to hedging flows from producers and merchandisers, along with fund rebalancing across the grain complex, as forces that can reinforce this recurring spring–summer soft patch in corn.
What is driving Corn (CME) (ZC) today?
Corn (CME) front-month futures closed at 443.5 cents per bushel on Apr 7, down 5.5 cents or 1.2% on the session, with volume of 49,855 contracts versus a 20-day average of about 150,106. That leaves ZC trading roughly mid-range between its 52-week high of 488.75 and low of 368.75, and only slightly above its 50-day simple moving average of 441.165, a sign that the market has cooled after last year’s sharp declines but has not yet broken into a new trend.
Fundamentally, the backdrop remains shaped by heavier supply. In January 2026, the U.S. Department of Agriculture raised its crop-supply estimates for corn, projecting higher ending stocks than traders had expected and triggering a sharp drop across grain futures.[1] That update reinforced a narrative of comfortable inventories heading into the 2026 planting season, which has kept rallies in check even as weather risk begins to creep back into the conversation. With the dollar, rates and broader inflation expectations relatively stable in recent weeks, the key macro impulse for corn has been this supply story rather than a sudden shift in global risk appetite.
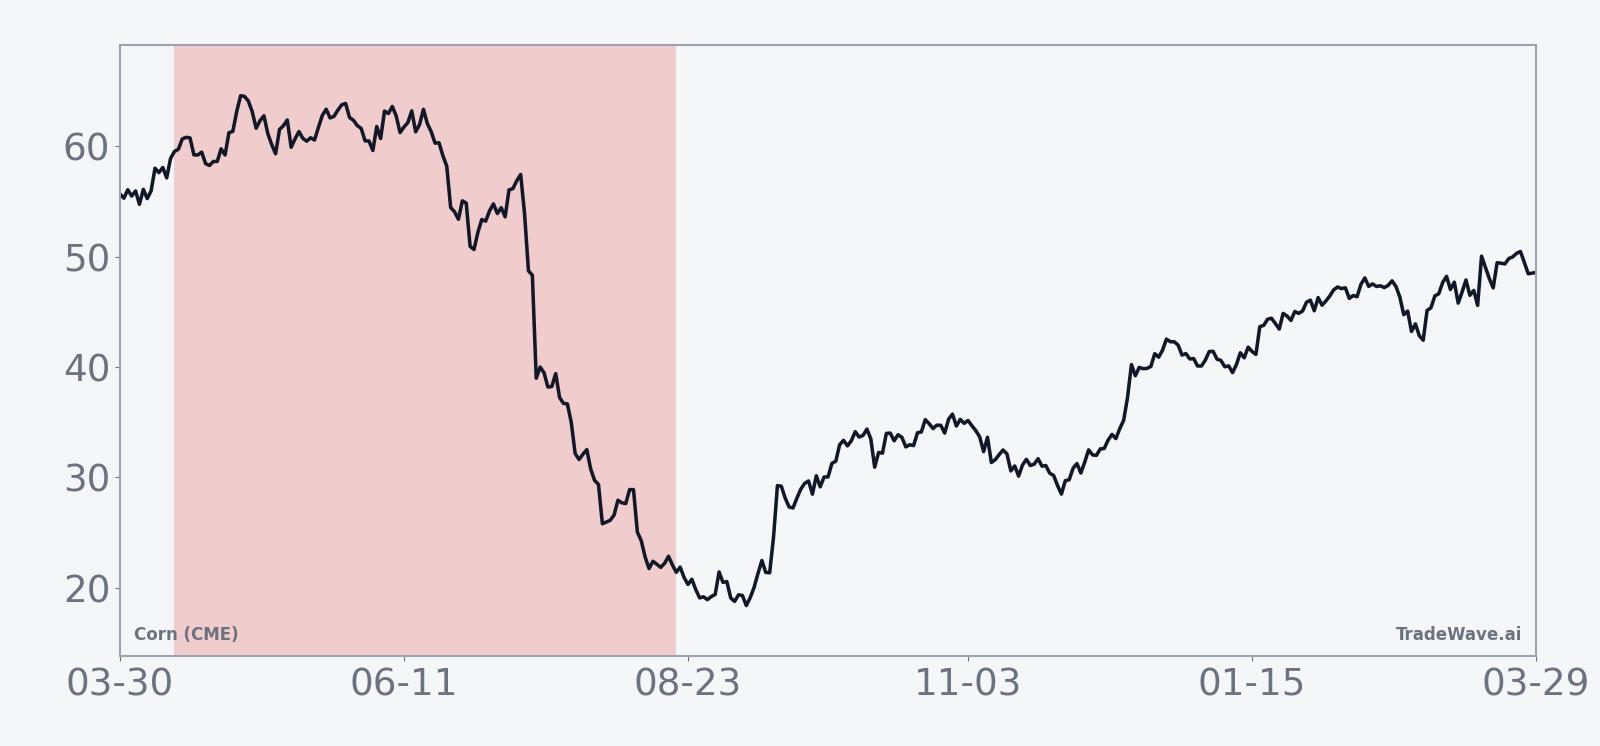
The chart below situates the latest move in its recent multi-month context and overlays a short-term seasonal projection.
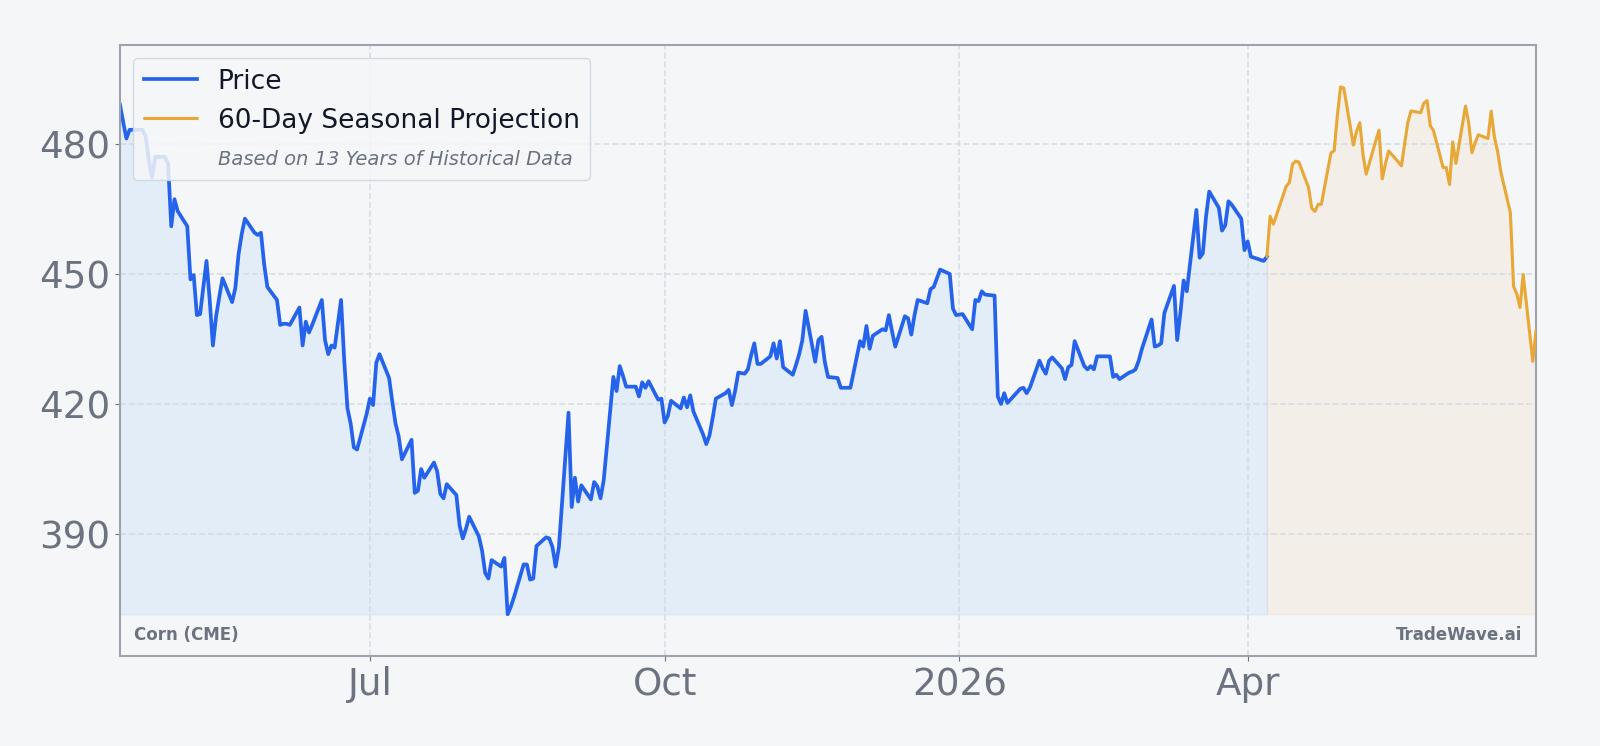
For end users and producers, this mix of mid-range pricing and a historically weak seasonal window raises tactical questions rather than clear answers. Ethanol margins, feed costs and export competitiveness all hinge on whether the 2026 crop follows the comfortable-supply script implied by USDA’s higher stocks outlook or whether weather and global demand inject fresh volatility. The seasonal pattern does not predict the outcome of those fundamentals, but it does show that when this window has opened in the past, the path of least resistance for corn prices has usually been lower.
What should traders watch as this seasonal window opens?
As the Apr 13 window approaches, the first thing to watch is how corn behaves around key technical levels: the 50-day moving average near 441 and the 52-week high at 488.75. A failure to sustain rallies above the mid-440s, especially on days with bullish weather headlines, would be consistent with the historical pattern of fading strength during this stretch. A decisive break above the 480s on strong volume, by contrast, would be an early sign that 2026 might rhyme more with the lone losing year in the sample than with the dominant run of short-friendly seasons.
On the macro and supply side, weekly crop progress and condition reports, along with any revisions to USDA’s acreage and yield assumptions, will be critical. The January move to higher ending stocks set the tone for a comfortable balance sheet,[1] so any sequence of weather scares, planting delays or export surprises that chip away at that cushion could blunt the usual seasonal pressure. Traders should also keep an eye on basis levels and export sales as real-time checks on whether the futures curve is correctly pricing physical tightness or slack.
Finally, behavior inside the window will matter as much as the end result. If corn repeatedly sells off after intraday rallies, respects resistance near recent highs and sees volatility cluster around bearish supply headlines, that would line up neatly with the 12-for-13 historical record for shorts. If instead the contract shrugs off bearish data, holds higher lows and grinds toward the top of its 52-week range, it would signal that this year’s fundamentals are overpowering the usual seasonal gravity. Either way, the next 130 trading days are set to test whether one of the strongest seasonal trends in the grain complex can extend its run.
Sources
About this seasonal analysis
Seasonal pattern data is sourced from TradeWave.ai, which analyzes historical price behavior across annual calendar windows going back up to 30 years. Read the full data methodology or the book The 100-Year Pattern by Afshin Moshrefi (2026 edition). Past performance of seasonal patterns does not guarantee future results. This article is for informational purposes only and does not constitute investment advice.