Shutdown Fears Just Drove Gold (COMEX) (GC) Higher - Right Into a Historically Weak 84-Day Window
Gold (COMEX) is approaching an 84-day midterm-election-year seasonal window that has consistently favored shorts, even as prices hold well below last year’s peak and speculative call spreads target extreme upside.

What is the seasonal pattern for Gold (COMEX) (GC)?
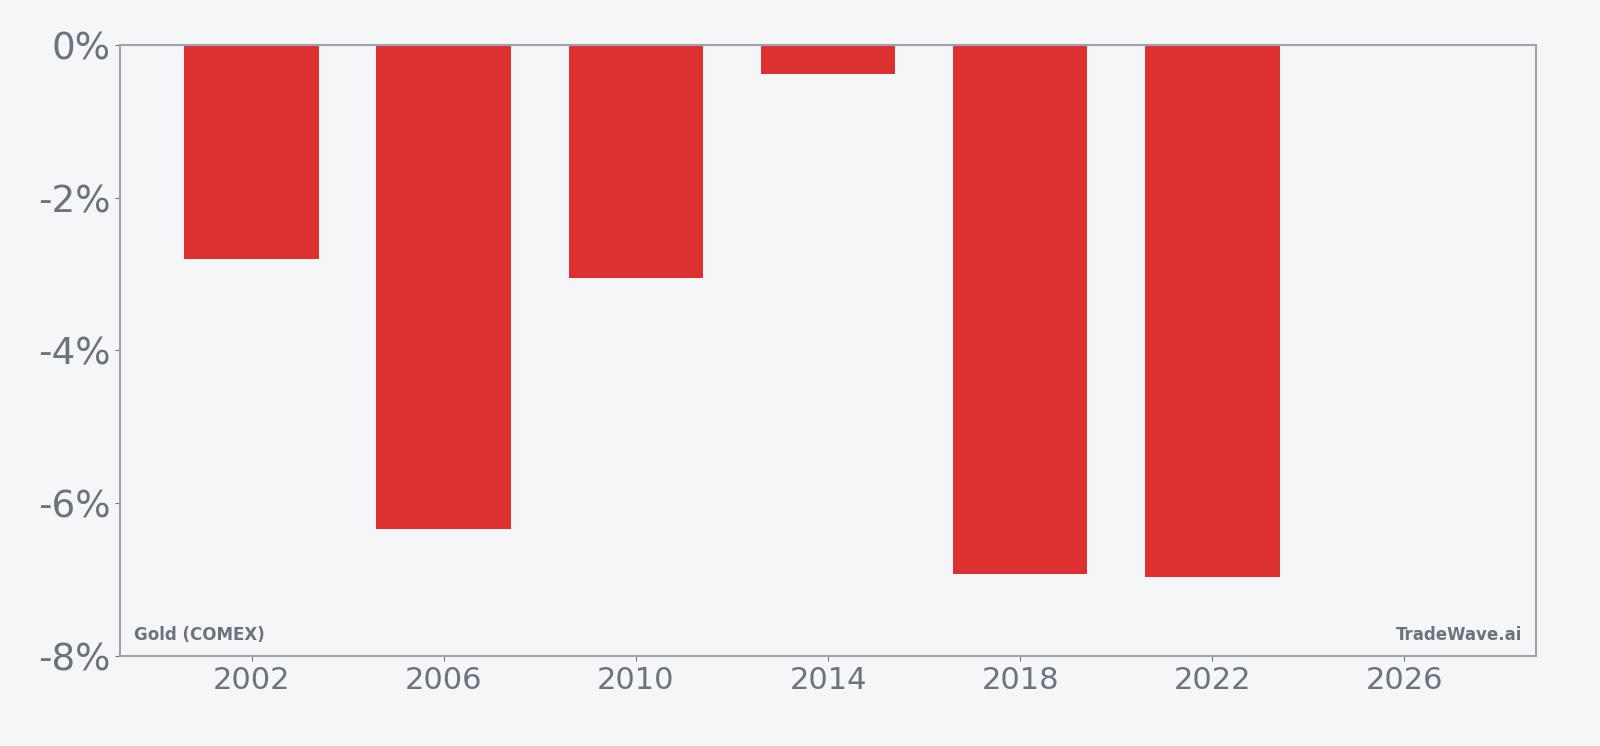
Gold (COMEX) has fallen in 6 of 6 midterm-election-year windows starting around May 6 and lasting 84 days, with an average gain of 4.41% in winning short trades.
- 6 for 6 in this window for short trades, with an average profit of 4.41% across those winning years.
- The upcoming 84-day window begins May 6 and has historically been a bearish seasonal stretch for Gold (COMEX) in midterm election years.
- Percent Profitable is 100%, with 6 winners and 0 losers for the short-side pattern in this election-cycle slice.
- Average winner gains of 4.41% for shorts compare with a median profit of 4.7%, pointing to fairly consistent downside moves.
- The TradeWave Ratio of 1.25 suggests price typically travels meaningfully in the trade direction within the window before settling.
- Intraperiod swings have been sizable, with some years showing double-digit peak drawdowns against the short before the trade finished profitable.
According to historical data from TradeWave.ai, this midterm-election-year stretch has behaved very differently from a typical summer for gold, with a clear short-side bias across the last six cycles.
How has Gold (COMEX) (GC) traded in this midterm-year summer window?
Gold (COMEX) has declined in all six midterm-election-year windows that start around May 6 and run for 84 days, with short trades averaging 4.41% profits. Today the front-month GC contract settled at 4560.30, up 0.9% on the session and sitting about 18.4% below its 52-week high of 5586.20.[2] In February 2026, options traders built large December $15,000/$20,000 call spreads on Comex even as prices consolidated, a sign of speculative upside positioning that could collide with this historically weak seasonal stretch if gold stumbles again.[1]
Grouping the data by the presidential election cycle matters here because midterm years often bring policy uncertainty, shifting rate expectations and fiscal debates that can jolt safe-haven assets like gold. This 84-day slice captures the early-to-mid part of that year, when Washington’s agenda is colliding with markets but before the pre-election-year growth push typically kicks in.
Across the last six midterm election years in this specific window, every short trade finished profitable, with net returns ranging from about 0.4% to nearly 7% in favor of the bears. The strongest years for the pattern were 2018 and 2022, when short positions captured declines of 6.93% and 6.96% respectively as gold rolled over from spring levels. The weakest outcome for shorts came in 2014, when the contract slipped only 0.38% over the window but still ended lower.
The average profit of 4.41% and median profit of 4.7% show that results have clustered in a fairly tight band rather than hinging on one outlier year. For a short pattern, that consistency matters: it suggests that in midterm years, this May-through-summer stretch has repeatedly seen gold drift lower rather than spike sharply higher into the close. The annualized return of 4.38% for the strategy and a Sharpe ratio of 1.28 underline that the risk-adjusted profile has been solid for traders positioned with the trend.
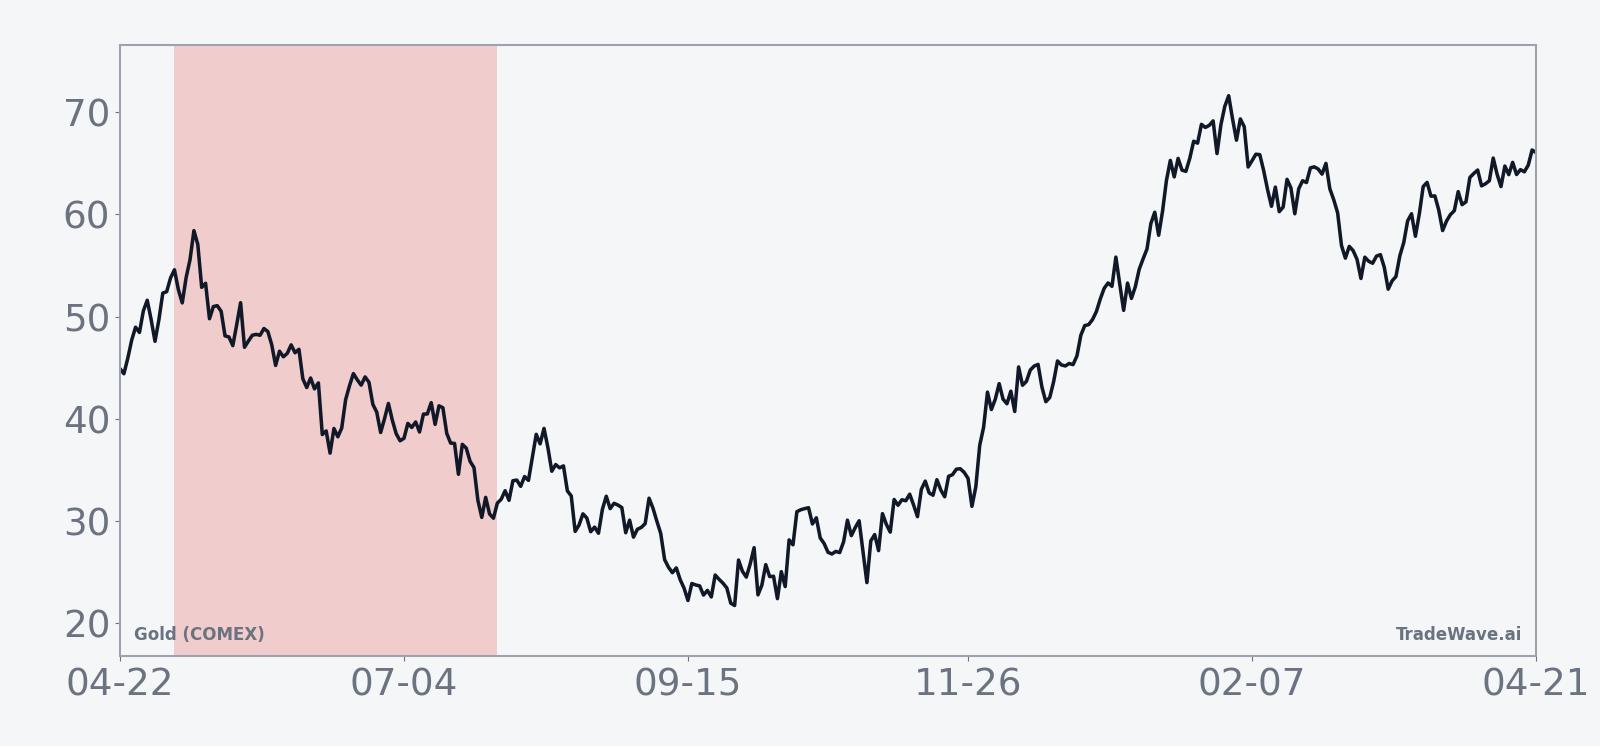
The historical seasonal trend line slopes gently in favor of the short side, with much of the downside accruing in the middle third of the window. Early days often show modest noise, followed by a more persistent grind lower, then a tendency to stabilize toward the end as markets look ahead to the pre-election year. That shape fits the idea of a policy-heavy midterm summer that eventually gives way to a more growth-friendly phase.
Year-by-year bars that include both peak run-ups and worst drawdowns show how much the contract has tended to swing inside the window before settling lower.
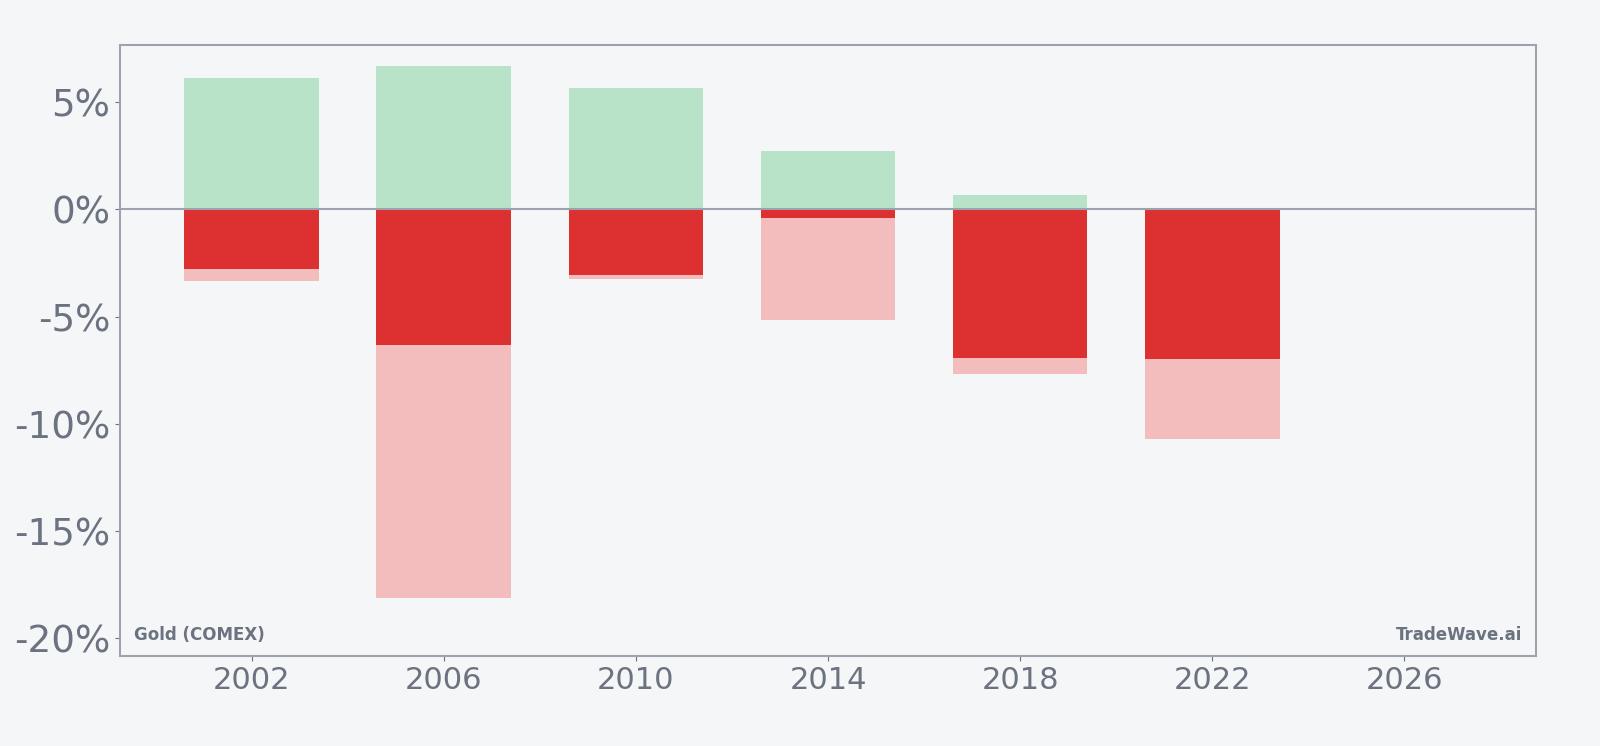
The maximum favorable move in winning years has often been larger than the final net profit, which means shorts have at times seen deeper intraperiod gains before some retracement. At the same time, maximum adverse moves have been meaningful, with years like 2006 and 2022 showing double-digit drawdowns against the short before the trade ended in the money. That mix of sizable best-case and worst-case excursions points to a window where volatility can be high even when the final direction has been reliably lower.
History does not guarantee future results, and intraperiod drawdowns can be large even in windows that have finished profitable in every prior cycle.
Why does Gold (COMEX) (GC) follow this seasonal pattern?
One likely driver is the way midterm election years concentrate policy risk, with debates over spending, taxes and regulation often peaking in late spring and summer. Analysts have also pointed to shifting expectations for central-bank policy and real yields in this phase, which can sap enthusiasm for gold after early-year safe-haven flows. The pattern may further reflect portfolio rebalancing as investors trim profitable gold positions to fund risk assets ahead of the historically stronger pre-election year.
What is driving Gold (COMEX) (GC) today?
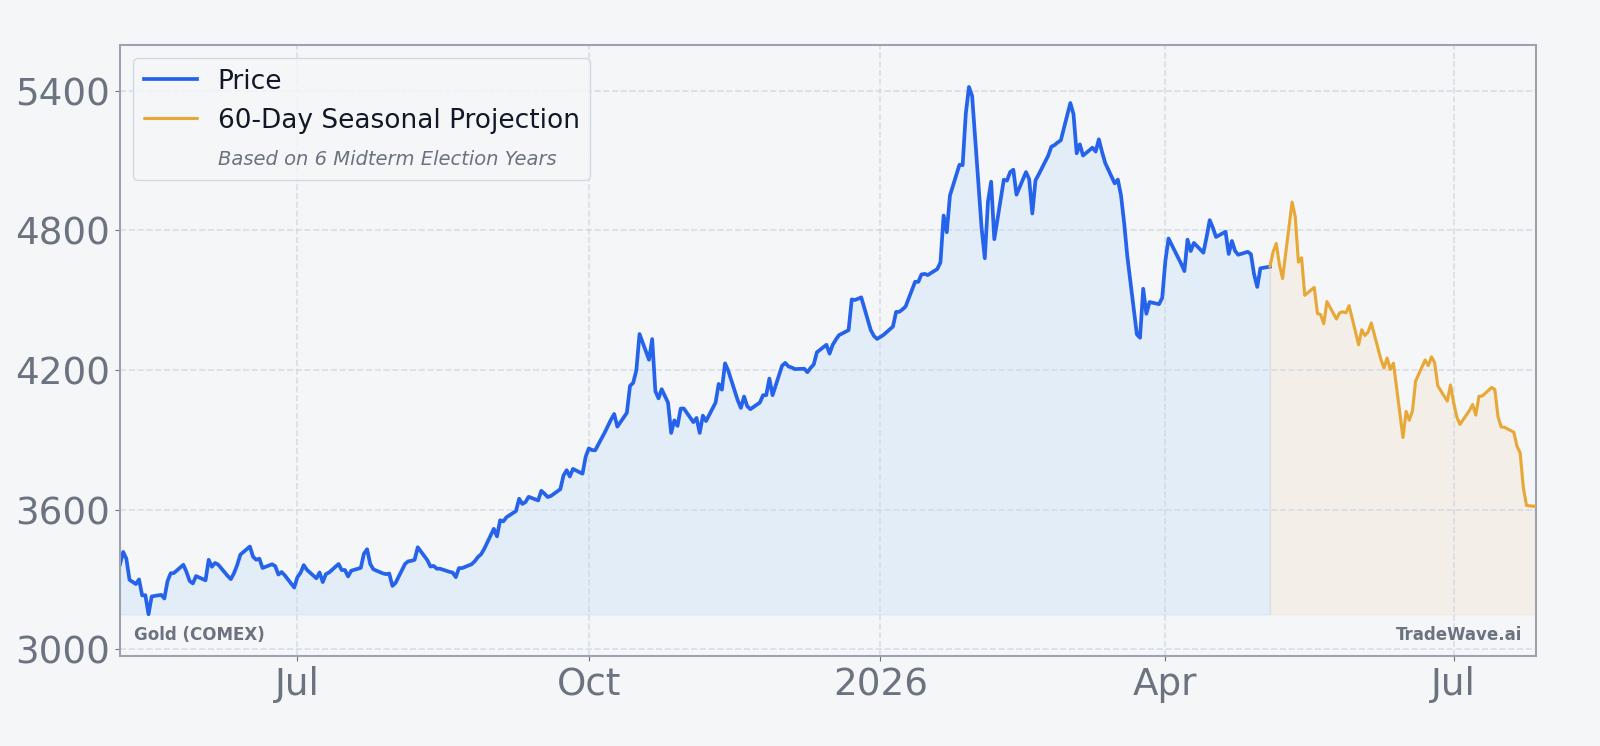
Gold (COMEX) futures closed at 4560.30 on May 5, up 0.9% on the day, after trading between 4522.70 and 4561.50 on moderate volume of 18,629 contracts.[2] The contract is about 18.4% below its 52-week high of 5586.20 and sits under its 50-day moving average of 4825.03, reflecting a market that has cooled from the parabolic spike above $5,000 earlier this year but remains elevated versus last autumn’s levels.[2] Speculative positioning has shifted from outright momentum buying to profit-taking, yet the broader backdrop of geopolitical risk, tariff worries and inflation uncertainty continues to support a structurally bullish narrative for gold over the longer term.[1][2][3]
In February 2026, Bloomberg reported that investors were building December $15,000/$20,000 call spreads on Comex, amassing roughly 11,000 contracts even as prices corrected from their highs.[1] That kind of long-shot upside bet is unusual in size and strike, and it suggests a cohort of traders is willing to pay for tail-risk exposure to an extreme gold rally. At the same time, Wall Street Journal coverage earlier in the year highlighted how shutdown fears and tariff concerns had driven gold’s surge above $5,000, underscoring how sensitive the metal has become to policy and political headlines rather than just traditional macro data.[2][3]
The chart below situates the latest move against the past year’s swings and overlays a short-term seasonal projection.
What should traders watch in this upcoming window?
The 84-day window that starts May 6 lands squarely in the midterm election year, when Washington’s policy fights and tariff debates can dominate the tape. For traders, the first marker is whether gold respects the pattern’s tendency to soften in the middle third of the window or instead squeezes higher, which would be a clear break from the last six cycles. Price action around the 50-day moving average near 4825 and the psychological $5,000 level will be key reference points for whether rallies are being sold or extended.[2]
Options flow is the second big tell. If the December $15,000/$20,000 call spread interest continues to build or migrates into nearer expiries, it would signal that speculative upside conviction is growing into a window that has historically favored shorts.[1] A fade in that activity, or a shift toward put buying and collars, would be more in line with the GC seasonal trend and could reinforce the idea that traders are using strength to hedge or lighten exposure. Finally, watch the policy calendar: any renewed shutdown scare, tariff escalation or surprise central-bank pivot could either accelerate the usual midterm-year softness or overwhelm it, providing an early test of how much weight this pattern carries in a cycle defined by political risk.
Sources
- [1] Bloomberg, "Gold Options Traders Boost Long-Shot Bets Even After Correction", Feb 16, 2026.
- [2] The Wall Street Journal, "Comex Gold Futures’ Strong Bullish Momentum Still in Play, Chart Shows", Jan 26, 2026.
- [3] The Wall Street Journal, "Comex Gold Settles 1.59% Higher at $4908.80", Oct 6, 2025.
About this seasonal analysis
Seasonal pattern data is sourced from TradeWave.ai, which analyzes historical price behavior across annual calendar windows going back up to 30 years. Read the full data methodology or the book The 100-Year Pattern by Afshin Moshrefi (2026 edition). Past performance of seasonal patterns does not guarantee future results. This article is for informational purposes only and does not constitute investment advice.