8-for-8 Midterm Slide: Natural Gas (CME) (NG) Shorts Have Averaged 7.92% Summer Profits
Natural Gas (CME) is trading below $3 as it heads toward a midterm-year seasonal window that has historically rewarded short exposure with sharp but volatile downside moves.
What is the seasonal pattern for Natural Gas (CME) (NG)?
Natural Gas (CME) has fallen in 8 of 8 midterm-year summer windows during this 111-day pattern, with an average short-side gain of 7.92% in winning years.
- 8 for 8 in this window, with Natural Gas (CME) averaging 7.92% gains for short positions across the last eight midterm election years.
- The upcoming 111-day Natural Gas (CME) trading window starts on May 22, 2026 and runs through early September, aligning with the heart of the cooling season.
- Percent Profitable is 100%, with 8 winners and 0 losers for the short-side pattern in this midterm-year slice.
- Average profit of 7.92% for winning shorts comes alongside sizable intraperiod swings, reflecting a historically volatile NG seasonal trend.
- Maximum favorable moves have reached into the 20% to 37% range in several years, while adverse excursions have at times pushed beyond 20% against shorts.
- Add it up: an 83% cumulative return for the pattern across eight cycles, but with drawdowns that demand tight risk management.
According to historical data from TradeWave.ai, this midterm-year summer stretch in natural gas has behaved very differently from an average calendar quarter, with a distinct short-side bias that traders often overlook.
How has Natural Gas (CME) (NG) traded in past midterm-year summer windows?
Natural Gas (CME) has declined in all eight midterm election years captured by this 111-day window, delivering an average 7.92% gain for short positions and an 83% cumulative return across cycles. The next iteration begins on May 22, 2026, with NG futures currently at 2.848 and still well below last year’s spike above 7.80, underscoring how far the contract has already reset. That combination of a clean short-side seasonal record and a sub-$3 price base turns this upcoming Natural Gas (CME) trading window into a focal point for energy desks watching for another volatile summer.
The presidential election cycle matters here because the pattern isolates only midterm election years, a phase that often brings policy uncertainty, shifting fiscal priorities and choppy risk appetite across energy markets. In this context, the NG seasonal trend from late May through early September has repeatedly leaned lower, even when the broader commodity complex or equities were not in clear downtrends.
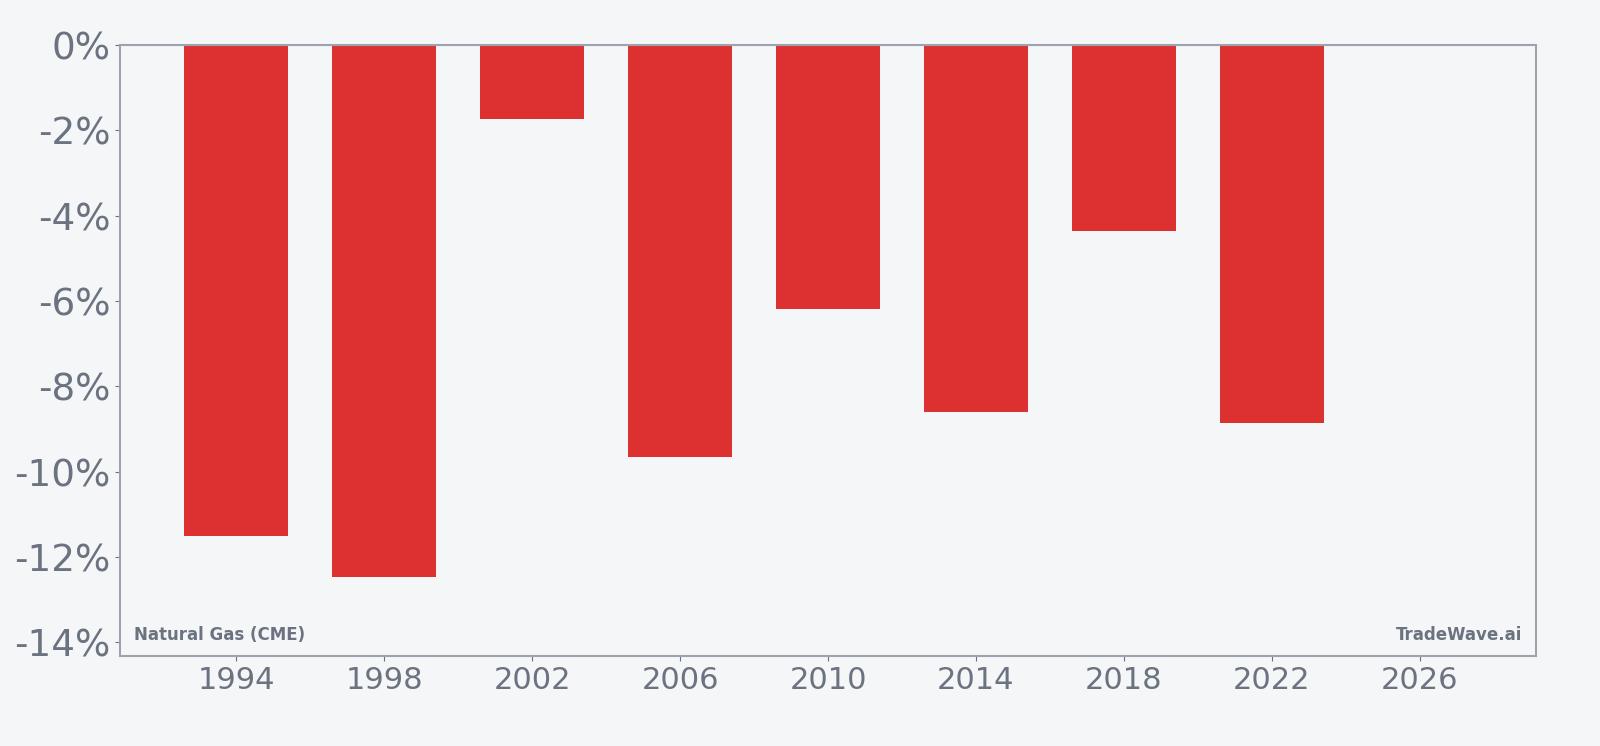
Across the eight midterm-year samples from 1994 through 2022, every single iteration of this Natural Gas (CME) seasonal pattern produced a negative net return for the underlying contract, which is a positive outcome for the short-side trade direction. The strongest year for shorts was 1998, when NG fell 12.46% over the window, while 2002 was the softest outcome with a 1.73% decline that still counted as a win for the pattern. Average profit of 7.92% and a Sharpe ratio of 1.85 point to a historically consistent edge rather than a single outlier year driving the statistics.
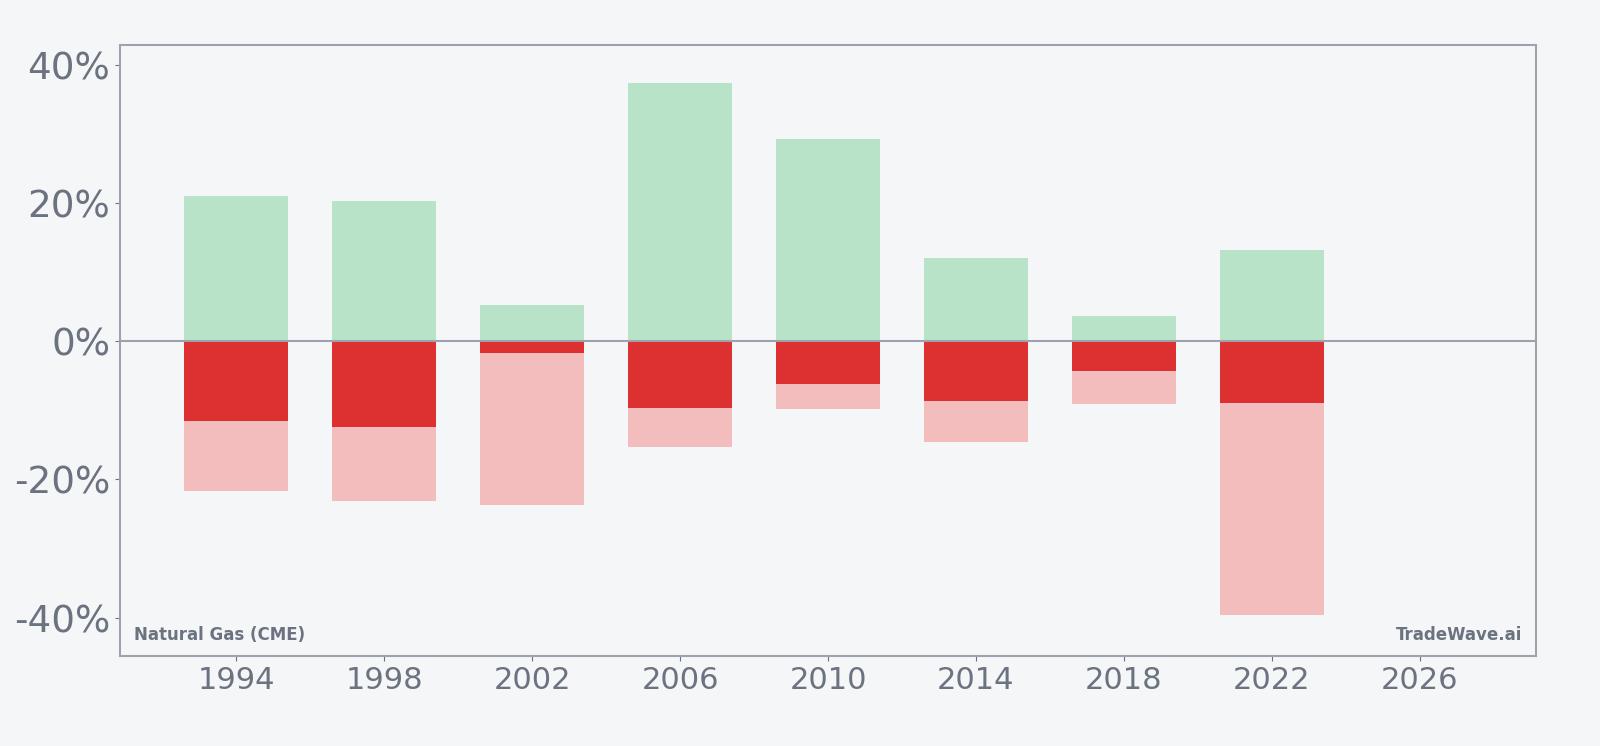
Intraperiod swings have been large. Maximum favorable moves for shorts, which capture the best peak-to-trough decline within each window, ranged from 3.64% in 2018 to 37.33% in 2006. On the flip side, maximum adverse excursions against shorts have at times been severe, including a 39.69% run-up in 2022 before prices ultimately rolled over by 8.87% into the close of the window. That profile fits natural gas’s reputation as a high-beta contract where both sides of the tape can move quickly.
The historical seasonal average curve suggests that in many midterm years, NG has either drifted lower from the start of the window or rallied early only to give back gains later in the summer. That pattern is consistent with weather and storage narratives that can spark short squeezes in June or July before supply-demand balances reassert themselves into late August.
A stacked view of net returns alongside best and worst intraperiod moves shows how often shorts have had to sit through sharp rallies before the pattern paid off.
For traders, the key takeaway is simple: this midterm-year summer window has been both consistently bearish for NG prices and consistently volatile, with large rallies often embedded inside ultimately lower outcomes. The pattern is clear and unusual for a major commodity: eight for eight winning short windows with meaningful average gains, but with enough adverse excursions to punish loose risk controls.
Why does Natural Gas (CME) (NG) follow this seasonal pattern?
One likely driver is the way summer weather, power demand and storage dynamics collide in midterm election years, when policy debates around energy, regulation and infrastructure can add noise to already volatile fundamentals. Analysts have pointed to the tendency for early-season heat or hurricane fears to spark price spikes that later fade as actual demand and storage data come in, leaving NG weaker into late summer.[2][3][6] This pattern may also reflect institutional positioning and hedging cycles in the energy sector, as utilities and producers adjust exposure ahead of the transition from cooling season into the build-up for winter.
History does not guarantee future results, and even in a perfect 8-for-8 window, adverse intraperiod moves have been large enough to challenge both long and short positions.
What is driving Natural Gas (CME) (NG) today?
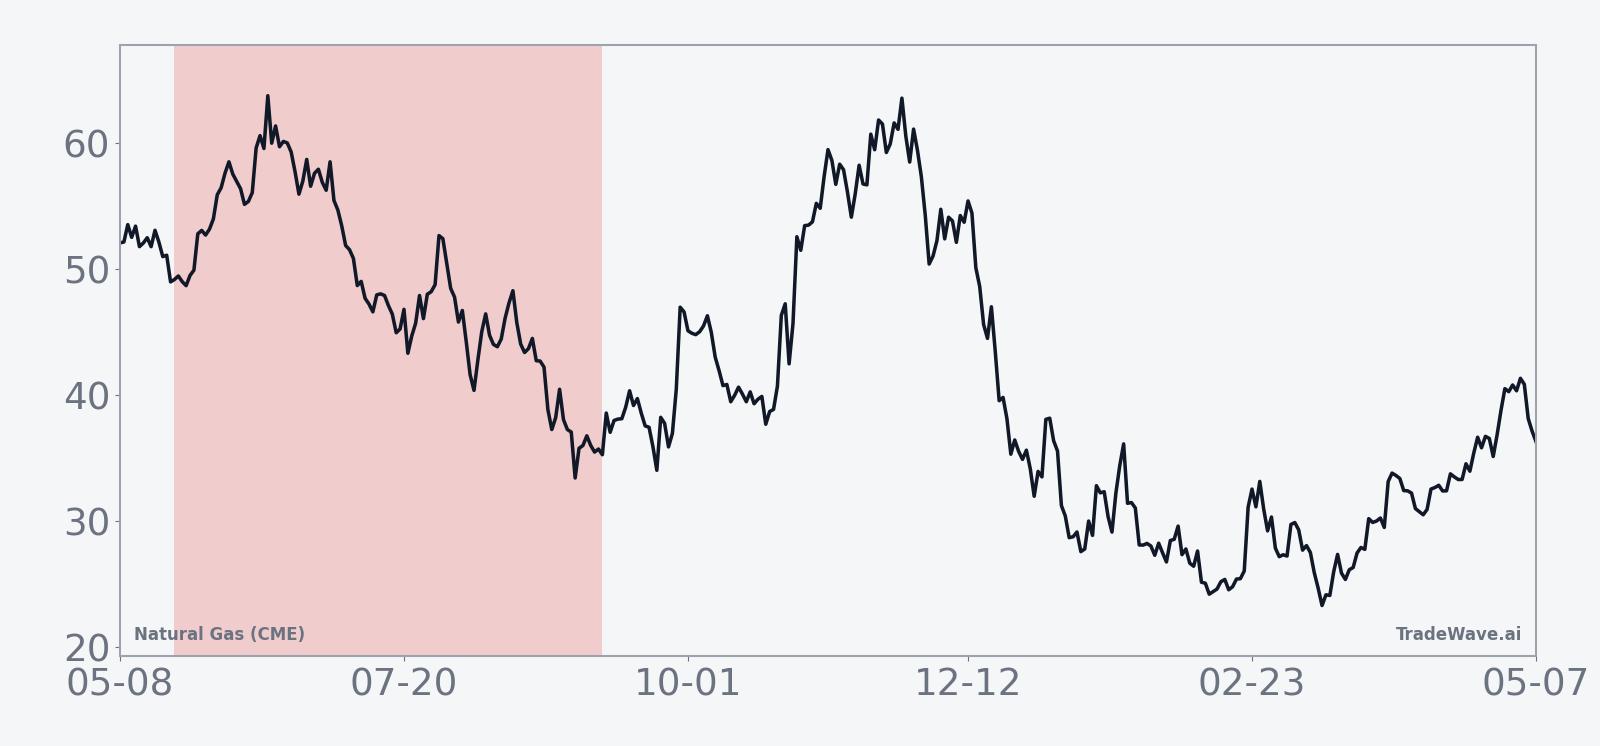
Natural gas futures are trading at 2.848, up 2.45% on the day, after a choppy spring that has left the contract down 7.88% over the past month and far below last year’s weather-driven spikes above 7.80. The move comes against a backdrop where weather and storage expectations continue to dominate the narrative: in late 2025, for example, U.S. natural gas futures swung between gains and losses as traders reacted to shifting forecasts and inventory data, with cold snaps tightening balances and milder outlooks quickly knocking prices back.[3][6][7][13][14]
The chart below situates the latest bounce within the past year’s slide from last year’s highs and overlays a 60-day seasonal projection.
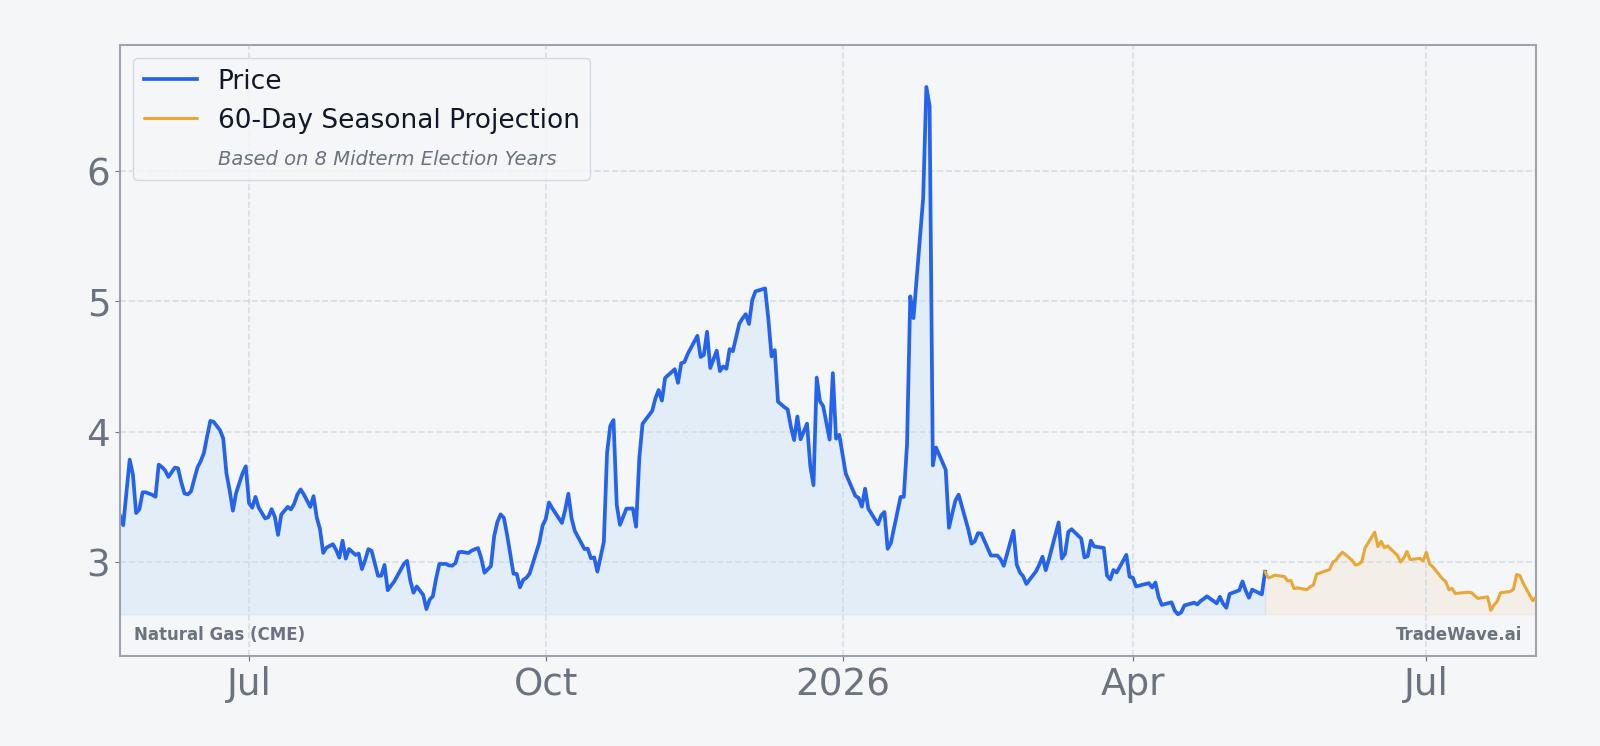
In 2025, U.S. natural gas prices gained more than 2% on mid-July heat forecasts that boosted expected cooling demand, only to give back ground when weather models turned milder later in the year.[2][7][14] Storage has been another swing factor: expectations of a 173 Bcf withdrawal that would cut the surplus to 107 Bcf helped support prices in December 2025, while delayed data and shifting surplus estimates kept intraday volatility elevated.[3][6] By early 2026, a sharp temperature drop in the Northeast again sent futures sharply higher, underscoring how quickly the contract can react to short-term demand shocks even when the broader trend is soft.[5]
Against that backdrop, the current sub-$3 level leaves NG in a kind of no-man’s land between the crisis-like spikes of 2022 and the depressed levels seen during oversupplied periods. For utilities, industrial users and LNG exporters, this price zone still offers relatively cheap feedstock, but the historical seasonality suggests that the next few months in a midterm election year have often delivered another leg lower before the market stabilizes. For traders, the key is whether upcoming storage reports and summer weather patterns reinforce that historical bias or trigger another round of short-covering rallies inside the window.
What should traders watch in this Natural Gas (CME) seasonal window?
The first marker is timing. The 111-day window opens on May 22 and runs through early September, so price behavior in the second half of May will set the tone for how closely this cycle tracks the historical pattern. A quick rally into the start of the window has often preceded some of the best short-side outcomes, as seen in years like 2006 and 2022 where early squeezes gave way to sizable declines by the end of the period.
Second, watch the weekly U.S. storage reports and high-frequency weather models for signs that demand is either overshooting or undershooting expectations. In Dec 2025, expectations of a large withdrawal that would flip a surplus into a deficit helped firm prices even as the broader trend remained fragile, and similar surprises this summer could temporarily overwhelm the seasonal tendency.[3][6] If storage draws come in lighter than expected while production stays strong, that would align more closely with the historical pattern of late-summer softness.
Third, monitor how NG trades around key technical levels highlighted on the recent price chart, particularly the 50-day moving average near 2.91 and the 2.56 area that marked the 52-week low.[9] A failure to reclaim the 50-day average as the window opens would fit the historical short-side bias, while a decisive break above it with strong volume would signal that this cycle may diverge from prior midterm years. Price action around the 2.56 to 3.00 band will offer an early read on whether the market is respecting the established NG seasonal trend or attempting to build a new base.
Finally, traders should keep an eye on cross-asset signals from energy equities and LNG-linked names, which often react to the same weather and policy catalysts that move NG futures. If those stocks begin to price in tighter supply or stronger demand even as NG approaches its historically weak midterm-year summer window, it would raise the odds that this cycle breaks the eight-for-eight streak. If, instead, energy equities stay range-bound or soften while NG fails to sustain rallies, it would be one more sign that the familiar seasonal script is playing out again.
Sources
- [2] Reuters, "US natgas prices gain over 2% on mid-July heat forecasts, more cooling demand", Jul 2, 2025.
- [3] The Wall Street Journal, "U.S. Natural Gas Picks Up Ahead of Storage Data", Dec 10, 2025.
- [5] MarketWatch, "Natural-gas prices soar as temperatures drop", Jan 20, 2026.
- [6] The Wall Street Journal, "U.S. Natural Gas Futures Gain Ahead of Delayed Storage Data", Dec 29, 2025.
- [7] The Wall Street Journal, "U.S. Natural Gas Futures Extend Decline", Dec 12, 2025.
- [9] The Wall Street Journal, "U.S. Natural Gas Futures Slip in Choppy Trade", Feb 19, 2026.
- [13] The Wall Street Journal, "U.S. Natural Gas Futures Post Daily Gain, Weekly Loss", Dec 19, 2025.
- [14] The Wall Street Journal, "U.S. Natural Gas Futures Give Back Some Gains", Dec 8, 2025.
About this seasonal analysis
Seasonal pattern data is sourced from TradeWave.ai, which analyzes historical price behavior across annual calendar windows going back up to 30 years. Read the full data methodology or the book The 100-Year Pattern by Afshin Moshrefi (2026 edition). Past performance of seasonal patterns does not guarantee future results. This article is for informational purposes only and does not constitute investment advice.