Near 52-Week High, Corn (CME) (ZC) Enters 24-Day Mid-May Window That Has Dropped Prices Every Time
Corn futures are trading just below their 52-week high as an early midterm-year window that has rewarded shorts every time since 2002 approaches in mid-May.
What is the seasonal pattern for Corn (CME) (ZC)?
Corn (CME) has fallen in 6 of 6 midterm-year late-spring windows starting around May 15, with an average gain of 5.56% for short positions in winning years.
- 6 for 6 in this window for shorts, with average winning-year profits of 5.56% over 24 trading days.
- Seasonal window runs from May 15 for 24 sessions, grouped across the last six midterm election years.
- Percent Profitable is 100%, with 6 winners and 0 losers for the short-side pattern.
- TradeWave Ratio (TWR) of 3.25 signals that price has typically traveled meaningfully in the trade direction within the window.
- Sharpe ratio of 3.92 reflects unusually strong risk-adjusted returns for this specific short pattern.
- Individual years have seen adverse moves against the short before paying off, so intraperiod drawdowns can still be uncomfortable.
According to historical data from TradeWave.ai, this mid-May stretch in midterm election years has behaved very differently from an average month on the corn calendar, and the next iteration is less than a month away.
How has Corn (CME) (ZC) traded in the upcoming mid-May window?
Corn (CME) has delivered short-side profits in every one of the last six midterm election years during the 24-session window that begins on May 15, with average gains of 5.56% for those short the contract. Today the front-month ZC future settled at 459.75, up 1.7% on the day and sitting about 4.4% below its 52-week high of 480.75, leaving room above if weather or supply headlines squeeze prices before the seasonal window opens.
Grouping the data by the presidential election cycle matters here because midterm years often bring policy uncertainty around farm support, biofuel mandates and trade, which can amplify weather and supply shocks. This pattern isolates the last six midterm election years and looks only at how corn behaved in the same late-spring slice of the calendar, rather than averaging across calmer pre-election or post-election years.
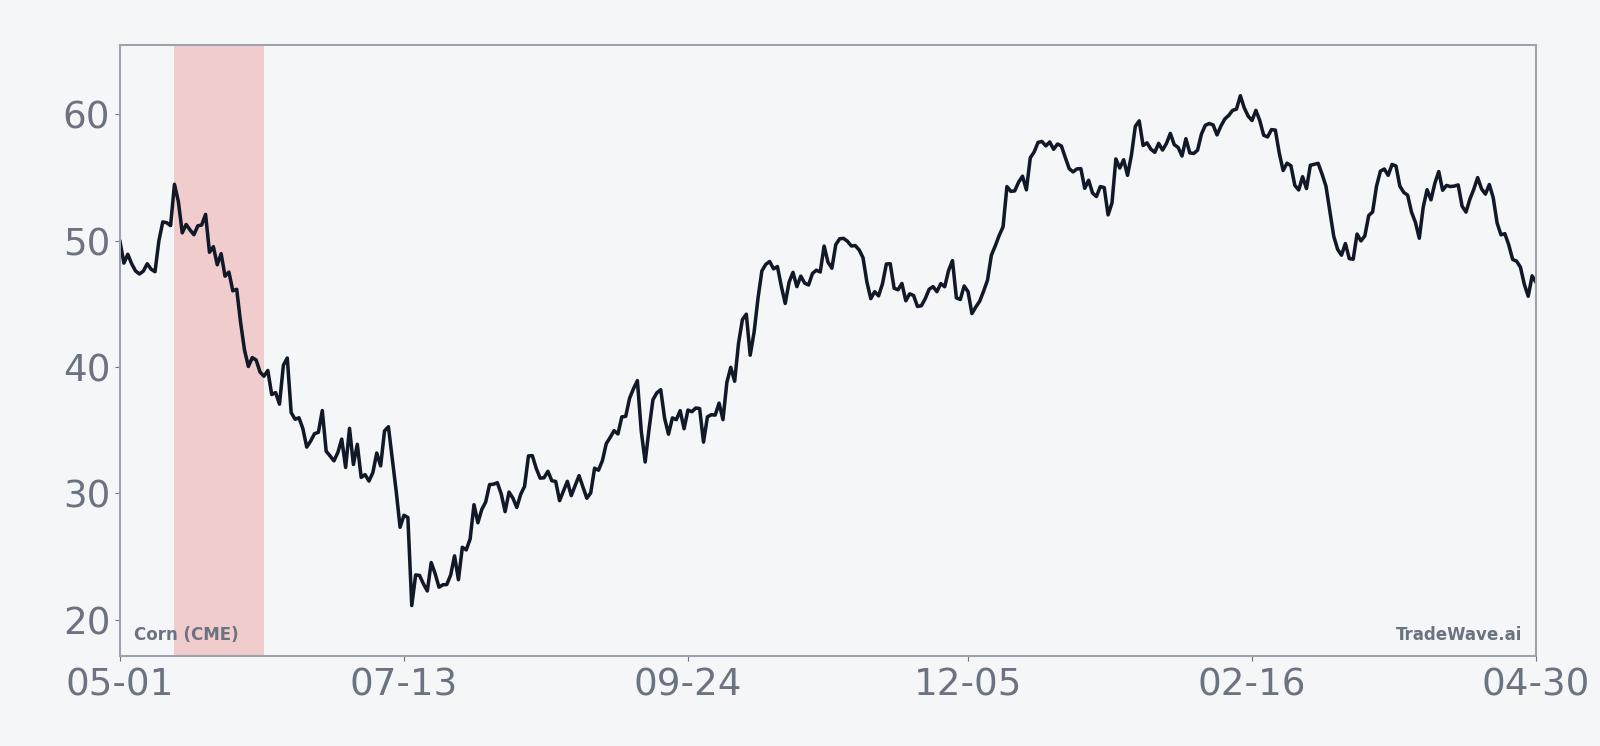
The historical seasonal average shows corn prices tending to roll over early in the window, with much of the short-side profit accruing in the first half of the 24 sessions. Later days have typically seen choppier action, with some years giving back part of the initial move but not enough to erase the net decline by the end of the window.
Per-year bars with both best and worst intraperiod moves show how consistently this window has favored shorts, and how deep the drawdowns have run before paying off.
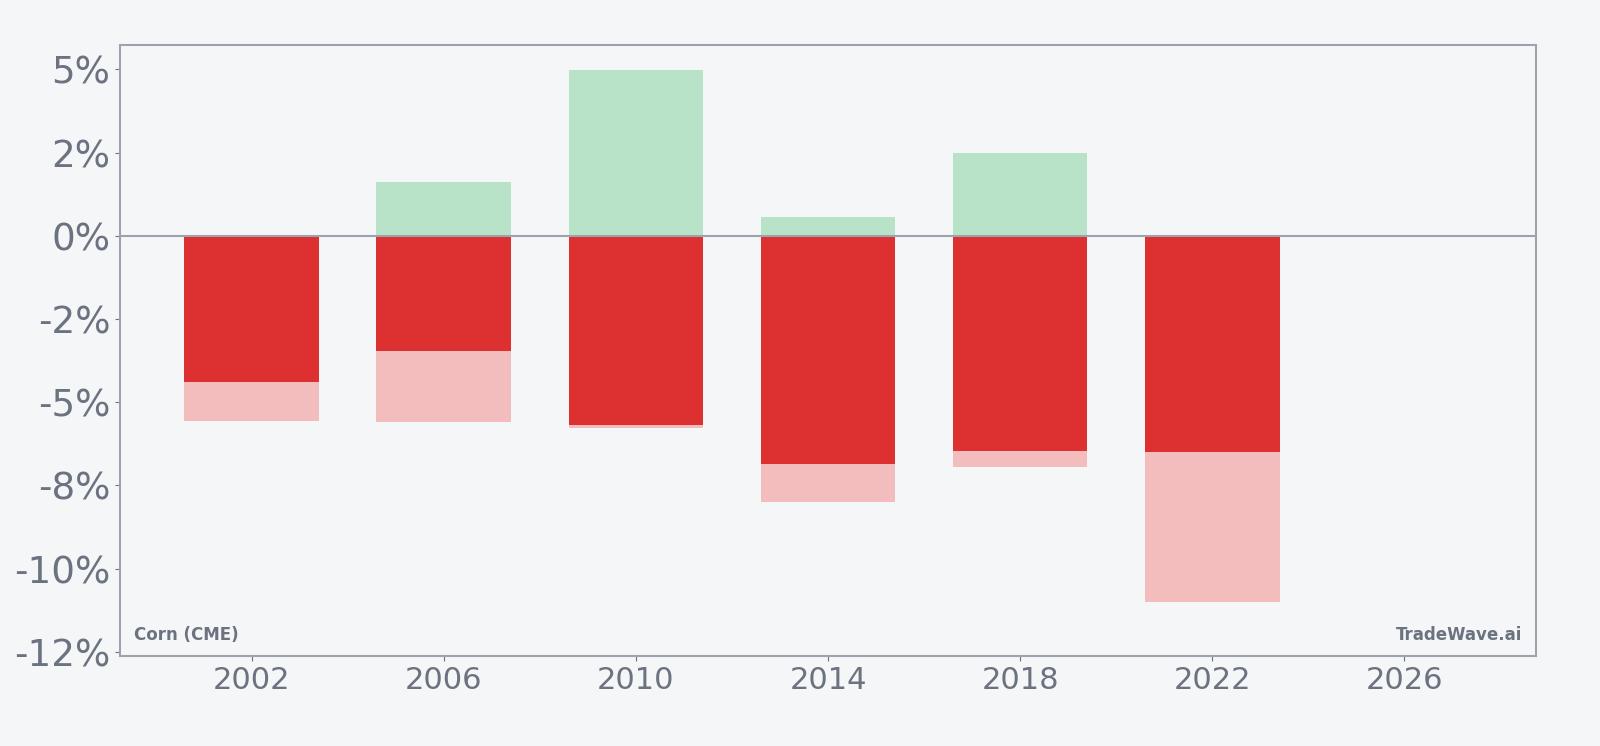
Across the six midterm-year samples, net returns for shorts ranged from about 3.46% to 6.87% gains, with every year finishing in the green for the trade direction. Maximum favorable moves inside the window have reached as much as 4.99% in 2010, while maximum adverse excursions have stretched to roughly 11% against shorts in 2022 before prices ultimately rolled over. That mix of strong net results and occasionally sharp squeezes is what drives the high TradeWave Ratio and Sharpe ratio for this pattern.
On a cumulative basis, stacking these windows together produces a 38% total gain for the short-side strategy across the six midterm election years in the sample. The curve is not perfectly smooth, but it slopes steadily lower for prices, which is exactly what short sellers want to see in a seasonal pattern.
History does not guarantee future results, and even in a 100% profitable sample, the worst intraperiod drawdowns have been large enough to challenge risk limits for traders who mistime entries or use excessive leverage.
Why does Corn (CME) (ZC) follow this seasonal pattern?
This mid-May window likely reflects a mix of commodity supply and policy seasonality. By late spring, early planting progress and updated USDA balance sheets often start to firm up expectations for ending stocks, which can pressure prices if supply looks comfortable. In midterm election years, shifting expectations around farm policy, biofuel mandates and trade agreements may add another layer of uncertainty, encouraging hedgers and speculators to lean short into what has repeatedly been a soft patch for corn.
What is driving Corn (CME) (ZC) today?
Corn futures closed at 459.75 on Tuesday, up 7.75 points or 1.7% on the session, with volume of 4,359 contracts against a 20-day average of 186,066.4. That leaves ZC about 4.4% below its 52-week high of 480.75 and roughly 24.7% above its 52-week low of 368.75, a mid-range position that gives the upcoming seasonal window room to bite in either direction.
Fundamentally, the market is still digesting a backdrop of higher ending stocks and strong export flows. In January 2026, USDA projections pointed to increased corn ending stocks, a shift that had already pressured grain futures as traders adjusted to a looser balance sheet.[1] In July 2025, USDA-linked commentary flagged record US corn exports for the 2024-25 marketing year, with the notable twist that China was largely absent from the buying list, underscoring how demand has broadened beyond a single large customer.[2] Together, those forces leave corn trading in a zone where weather, acreage and policy headlines can quickly swing sentiment into the mid-May window.
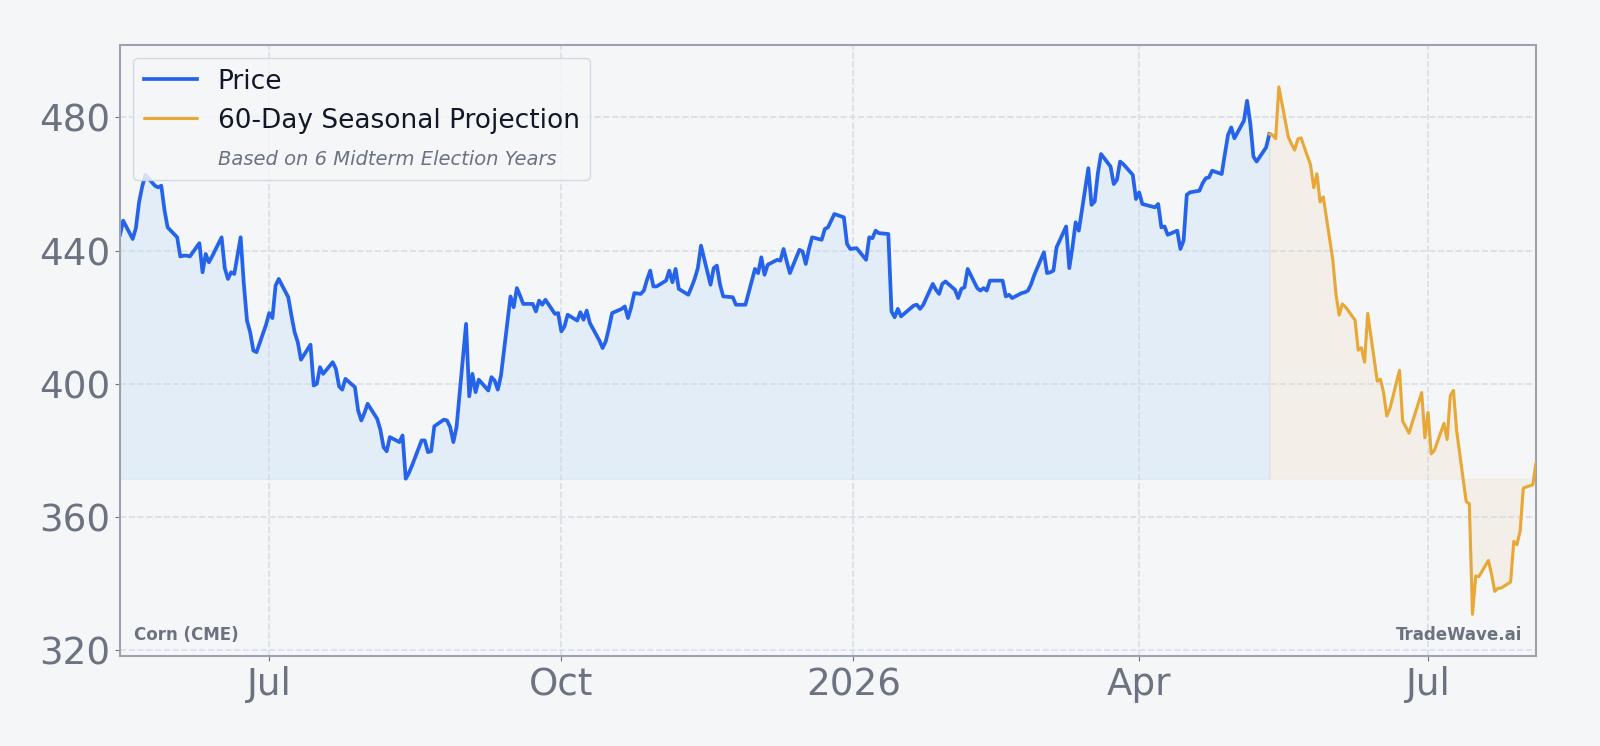
The chart below puts the latest bounce in context and overlays a 60-day seasonal projection around the upcoming window.
What should traders watch as the mid-May window approaches?
With less than a month until the 24-session window opens on May 15, the key question is whether corn rallies into that date or stalls below the 480.75 high. A push back toward that level would give shorts more air to work with if the historical pattern repeats, while a failure to hold current gains could mean the seasonal weakness is arriving early.
On the macro side, upcoming USDA supply-and-demand updates and any revisions to ending stocks will be critical, especially if they confirm or challenge the looser balance sheet narrative from early 2026.[1] Traders will also be watching export pace relative to the record 2024-25 marketing year, looking for signs that demand is broad enough to absorb larger crops without tightening the market too quickly.[2]
Inside the window itself, behavior around sharp intraday rallies will be telling. In prior midterm years, some of the best short-side outcomes still featured sizable squeezes before prices rolled over, with adverse excursions reaching double digits in 2022. If this year’s window again shows strong early downside followed by contained bounces, it would fit the historical ZC seasonal trend. A sustained breakout above the 52-week high during the window, by contrast, would mark a clear departure from the last six cycles and signal that supply, demand or policy dynamics have shifted enough to overwhelm the pattern.
Sources
About this seasonal analysis
Seasonal pattern data is sourced from TradeWave.ai, which analyzes historical price behavior across annual calendar windows going back up to 30 years. Read the full data methodology or the book The 100-Year Pattern by Afshin Moshrefi (2026 edition). Past performance of seasonal patterns does not guarantee future results. This article is for informational purposes only and does not constitute investment advice.