USDA’s Higher Corn (CME) (ZC) Stock Estimates Deepen Price Slide as Mid-May Weak Window Nears
Corn futures are hovering just below a 52-week high as an early midterm-year window that has delivered six straight short-side wins approaches in mid-May.
What is the seasonal pattern for Corn (CME) (ZC)?
Corn (CME) has fallen in 6 of 6 midterm-year spring windows starting around May 15, with an average 5.56% gain for short positions in winning years.
- 6 for 6 in this window, with short trades averaging 5.56% profits across winning years.
- The seasonal window begins May 15 and runs for 24 trading days in midterm election years.
- Percent Profitable is 100%, with 6 winners and 0 losers for the short-side pattern.
- Median profit for shorts is 6.08%, pointing to a consistently negative price bias in this slice of the calendar.
- The TradeWave Ratio (TWR) of 3.25 signals that price typically travels meaningfully in the trade direction within the window.
- A Sharpe ratio of 3.92 indicates unusually strong risk-adjusted returns for this specific short window in prior midterm cycles.
According to historical data from TradeWave.ai, this mid-May stretch in midterm election years has behaved very differently from an average month on the corn calendar, and the next iteration is now one month away.
How has Corn (CME) (ZC) traded in the upcoming mid-May window?
Corn (CME) has dropped in every one of the last six midterm election years during the 24-day window that starts around May 15, delivering a 5.56% average profit for short positions. Today the front-month contract settled at 446.25 cents per bushel, up 0.7% on the session and about 7.2% below its 52-week high of 480.75, after slipping 2.42% over the past month.
Grouping the data by the presidential election cycle matters here because this window only looks at midterm election years, when policy uncertainty around farm support, trade and biofuel mandates tends to be elevated. Pattern phase and calendar phase are aligned: the current year is a midterm election year, and the historical sample covers the last six midterm cycles, so the upcoming window sits squarely in that same part of the political calendar.
Historically, the trade direction for this pattern is short, and every one of the six midterm-year samples has delivered a negative net return for corn prices over the 24-day span. The median profit for shorts is 6.08%, close to the 5.56% average, which suggests the wins have been relatively clustered rather than driven by a single outlier year. Because there are no losing years in the sample, the 6% “all-years” average lines up with the winner-only average, reinforcing how consistently this window has leaned lower.
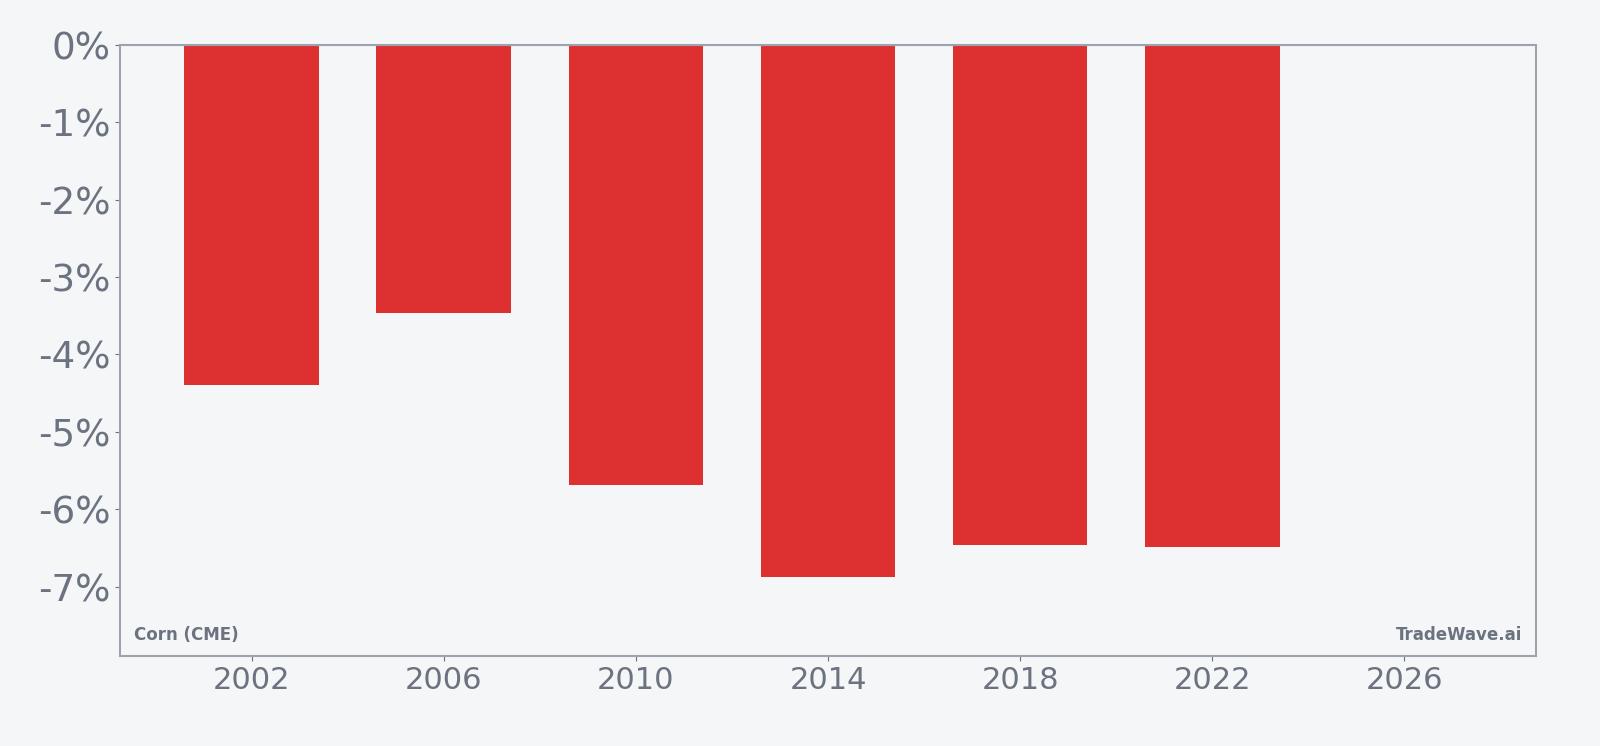
The per-year table shows that 2014 and 2022 were the strongest years for the pattern, with net returns of about 6.87% and 6.49% for shorts as corn slid from 484.25 to 451.00 and from 809.50 to 757.00 respectively. The weakest outcome for shorts still produced a 3.46% gain in 2006, when prices fell from 260.00 to 251.00 over the window. Add it up: across six midterm election years, every iteration of this mid-May stretch has rewarded traders positioned for softer corn prices.
The historical seasonal trend chart shows that most of the downside for corn in this window has tended to accrue steadily rather than in a single air pocket. Prices often drift lower through the middle of the window, with some years showing a modest early bounce that fades into a more persistent decline. That profile fits a market where supply expectations and planting progress gradually weigh on sentiment rather than a one-off shock.
A second view that stacks net returns with peak run-ups and worst drawdowns helps frame how far prices have swung inside the window.
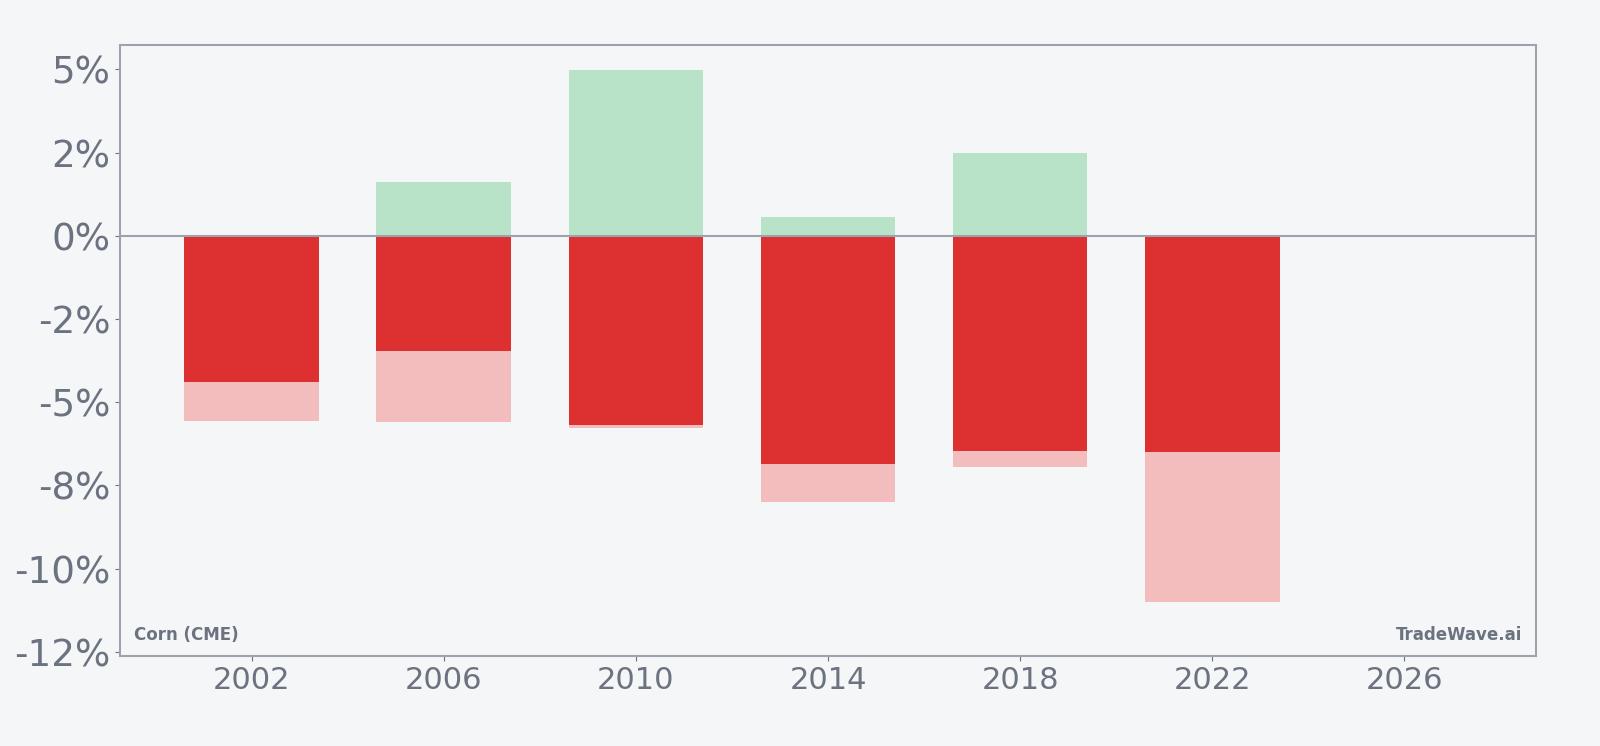
The stacked bar chart of net returns, maximum favorable excursion and maximum adverse excursion shows that even in winning years, corn has often moved sharply both for and against the short trade inside the window. In 2022, for example, the best intraperiod move for shorts (the peak run-up) was almost 11% from entry, while the worst drawdown against the position was modest, which is ideal for a short setup. In other years such as 2010, the maximum favorable move for shorts approached 5% but came with adverse swings of a similar magnitude, underscoring that this is a window with real two-way volatility even though the final outcomes have all favored lower prices.
History does not guarantee future results; adverse excursions can be large even in winning windows, and traders can still be forced out of positions before the seasonal tendency plays out.
Why does Corn (CME) (ZC) follow this seasonal pattern?
This mid-May window lines up with the heart of U.S. planting season, when acreage decisions, early weather and updated government supply estimates start to harden into a clearer production outlook. One likely driver is that midterm election years often bring added uncertainty around farm policy, trade and ethanol mandates, which can encourage producers to lock in prices and pressure futures lower as planting progresses. Analysts also point to the tendency for early-season weather scares to fade by late May, shifting the balance from fear of shortage toward comfort with supply just as this window unfolds.
What is driving Corn (CME) (ZC) today?
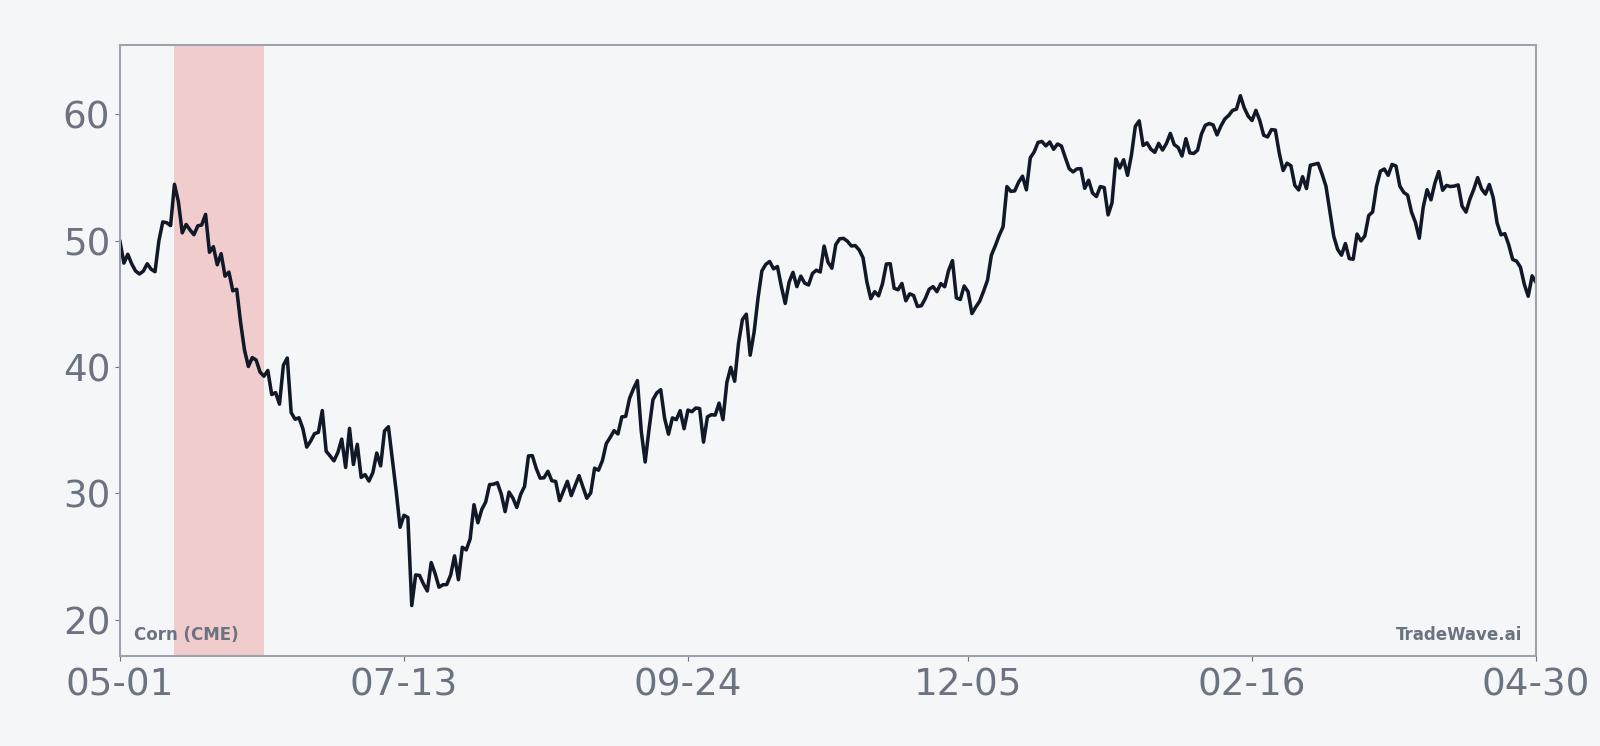
Corn futures ended Tuesday at 446.25, up 3.25 cents on the day, leaving the contract about 7.2% below its 52-week high of 480.75 and roughly 21% above its 52-week low of 368.75. The market has slipped 2.42% over the past month even as traders digest higher U.S. ending stocks and plans for larger planted acreage, a combination that keeps a lid on rallies despite occasional short-covering bursts.[1]
The chart below shows how that pullback fits into the past year’s trading range and the projected seasonal path into early summer.
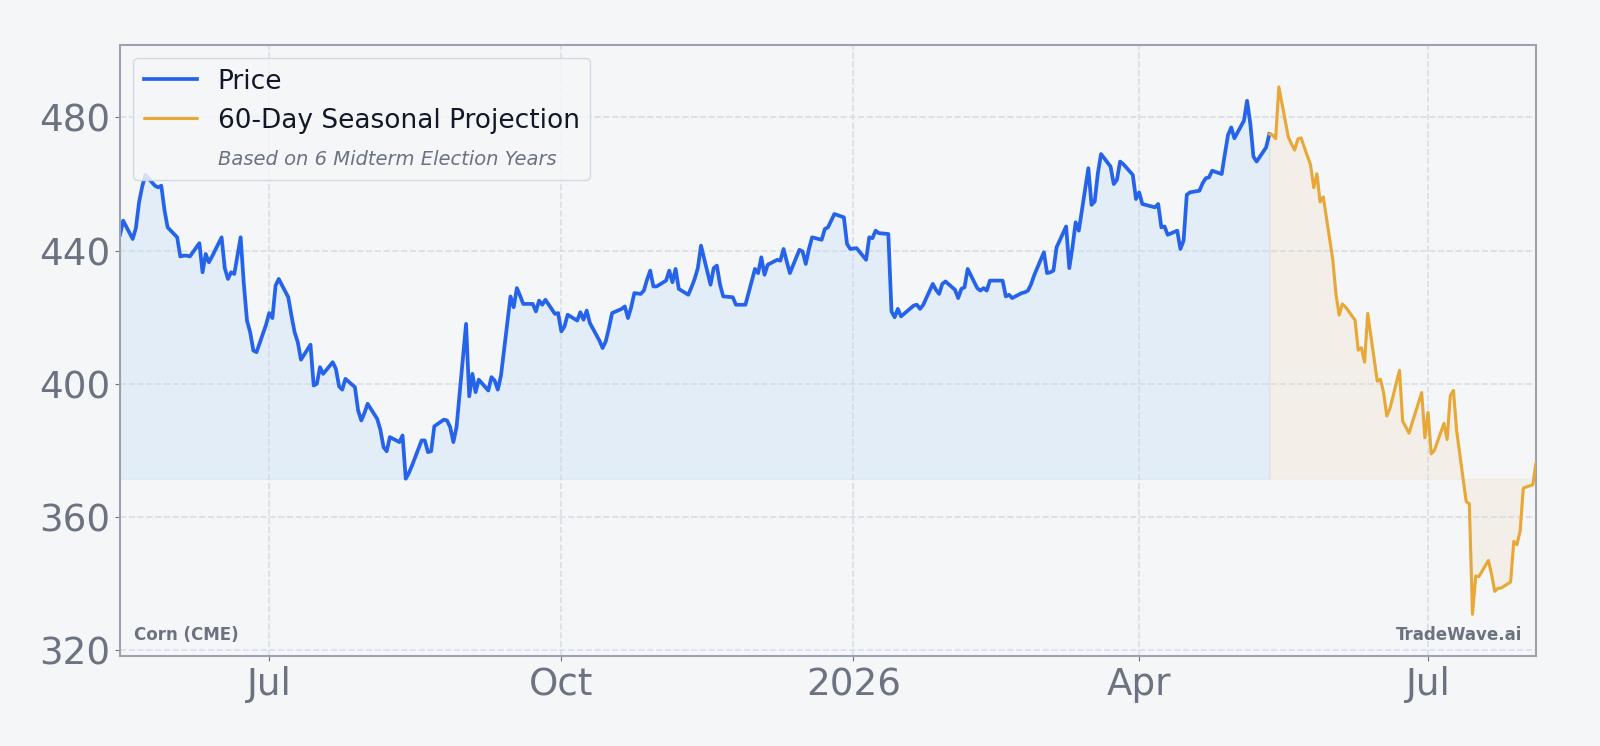
On the fundamental side, the U.S. Department of Agriculture has raised estimates for corn ending stocks, signaling more comfortable supplies and putting structural pressure on prices.[1] At the same time, U.S. farmers are planning to plant more corn acres to chase better break-even potential, even though margins remain tight after last year’s slump.[1] That combination of heavier inventories and larger intended acreage means the market will be highly sensitive to any weather or policy surprise that could tighten or loosen the balance further as the planting season progresses.
In this context, the upcoming mid-May seasonal window takes on added importance. Corn is entering a midterm election year in which debates over farm subsidies, crop insurance and renewable fuel standards can influence planting decisions and hedging behavior. If the historical pattern repeats, the period from mid-May into June has often coincided with a phase where supply confidence grows faster than demand, encouraging producers and commercial users to sell into strength and reinforcing the tendency for prices to drift lower.
What should traders watch as this seasonal window approaches?
First, watch how corn behaves as it approaches the 480.75 52-week high: a failure to retest that level before mid-May would fit the historical pattern of rallies stalling ahead of the seasonal window, while a clean breakout and hold above it would mark a clear departure from prior midterm years. Second, monitor USDA supply updates and weekly planting progress reports for signs that acreage and yield expectations are tracking above trend, which in past cycles has lined up with the soft mid-May to June stretch.[1]
Third, pay attention to intraday volatility once the window opens. The historical record shows that even in years where shorts ultimately won, corn often staged sharp countertrend bounces inside the 24-day span, so whether those spikes are quickly sold or extend into sustained squeezes will be a key tell. Finally, track how policy headlines around farm support, trade and ethanol mandates evolve through late spring; in prior midterm election years, clarity on those fronts has often coincided with producers stepping up hedging, reinforcing the seasonal tendency for prices to ease into early summer.[1]
Sources
About this seasonal analysis
Seasonal pattern data is sourced from TradeWave.ai, which analyzes historical price behavior across annual calendar windows going back up to 30 years. Read the full data methodology or the book The 100-Year Pattern by Afshin Moshrefi (2026 edition). Past performance of seasonal patterns does not guarantee future results. This article is for informational purposes only and does not constitute investment advice.