Sugar (SB) Has Dropped in 8 of 10 Midterm May Windows as a 19-Day Weak Stretch Nears
Sugar futures are pushing higher into mid-May just days before a 19-day midterm-year seasonal window that has usually leaned lower, raising near-term volatility risk for the soft commodity.
What is the seasonal pattern for Sugar (SB)?
Sugar has fallen in 8 of 10 midterm-year windows starting around May 19, with an average loss of 5.14% in winning years for the short side.
- 8 for 10 in this window, with short trades averaging 5.14% gains in winning years.
- The upcoming pattern runs 19 trading days from May 19 and is grouped across the last 10 midterm election years.
- Percent Profitable is 80%, with 8 winners and 2 losers for the short-direction setup.
- Including all years, Avg Profit - All is 4%, showing that losing years have been relatively contained.
- Maximum favorable and adverse excursions inside the window have often reached mid-single to low-double-digit moves, underscoring meaningful intraperiod swings.
- Sharpe ratio of 1.01 and a TradeWave Ratio of 1.95 point to a historically efficient short window when it works.
According to historical data from TradeWave.ai, this mid-May stretch in midterm election years has behaved differently from a typical month for Sugar, and the next iteration is about to open again.
How has Sugar (SB) traded in this mid-May midterm-year window?
Sugar has fallen in 8 of the last 10 midterm election years during the 19-day window that begins around May 19, making this one of the more reliable short-side seasonal stretches on the softs calendar. Futures settled Thursday at 15.38 cents a pound, up 2.7% on the day and trading between a 52-week low of 13.46 and a high of 18.29, a range that leaves plenty of room for a swing either way in the weeks ahead.
Grouping the data by the presidential election cycle matters here because midterm years often bring shifting policy expectations, subsidy debates and trade headlines that can hit agricultural contracts differently than in quieter political phases. This pattern isolates the last 10 midterm election years and looks only at how Sugar behaved in the same 19-session slice of the calendar, rather than blending in behavior from election or pre-election years that tend to have very different risk appetites.
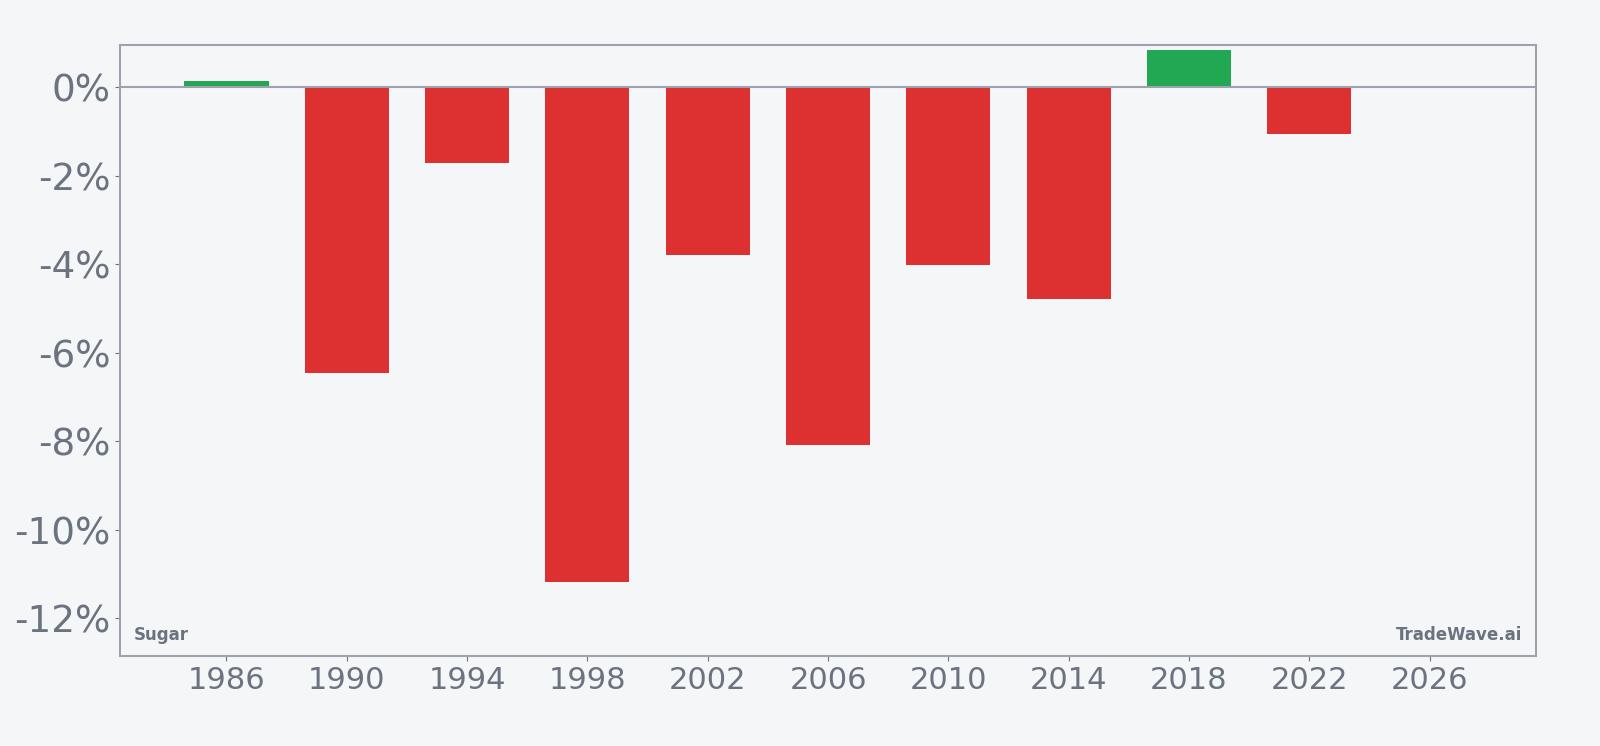
Across those 10 midterm-year samples, the short-direction setup has been profitable 80% of the time, with 8 winners and 2 losers. Average profit in the winning years is 5.14%, while the all-years average, which includes the two losing seasons, comes in at 4%. That gap tells you the down years for shorts have been relatively modest compared with the stronger stretches where prices trended lower.
The per-year table shows some of the more notable episodes. In 1998, Sugar dropped 11.19% over the window, with a best intraperiod move of 2.15% in the trade direction and a worst drawdown of 11.41% from entry. In 2006, the contract fell 8.1% across the window, with a maximum favorable move of 1.52% and a maximum adverse move of 8.71%. On the other side of the ledger, 1990 stands out as a losing year for shorts, with Sugar rising 6.47% over the period and posting a worst drawdown of 10.81% against the trade.
The historical seasonal average suggests that, in winning years for the short side, Sugar has tended to soften fairly steadily through the middle of the window rather than collapsing on day one. The cumulative return profile builds gradually, which implies that traders who have leaned with the pattern in the past have often seen the bulk of the move accrue over several sessions instead of a single shock.
A second view that layers in best and worst intraperiod swings shows how far Sugar has typically traveled inside the window, even when the final net move was smaller.
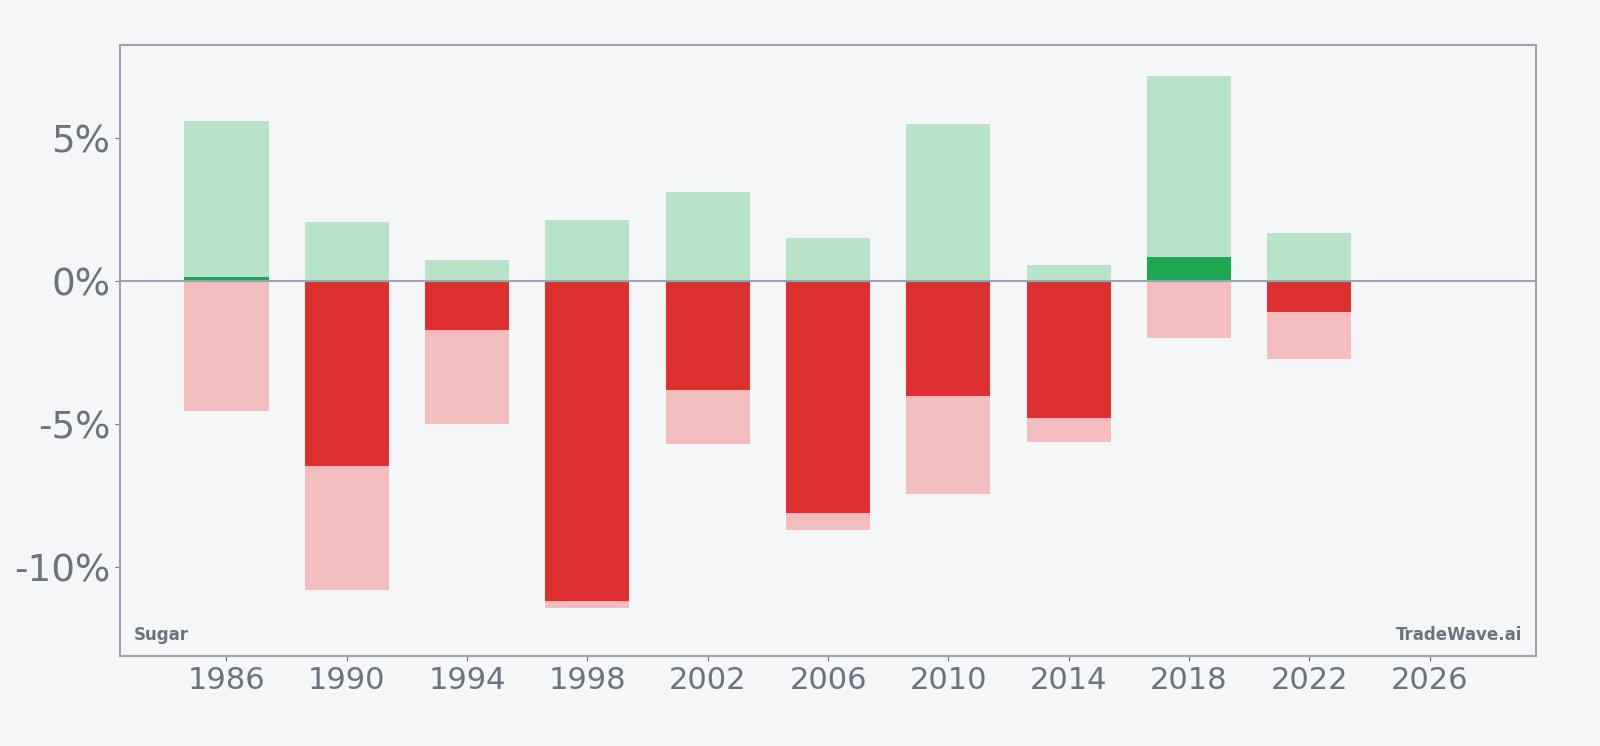
Looking across those bars, maximum favorable moves in winning years often reach the mid-single digits, while maximum adverse moves in tougher years can stretch toward or beyond 10%. That mix points to a window where the short side has historically had an edge, but where intraperiod volatility has been meaningful in both directions. For traders, the message is that this Sugar trading window has tended to reward getting the direction right, yet it has also punished loose risk management when prices squeeze against the trade.
History does not guarantee future results; adverse excursions (MAE) can be large even in winning windows.
Why does Sugar (SB) follow this seasonal pattern?
This mid-May seasonal pattern for Sugar likely reflects a mix of commodity supply and demand seasonality and the policy backdrop that comes with midterm election years. One likely driver is the way Northern Hemisphere crop expectations, weather patterns and early harvest signals start to firm up around this point on the calendar, which can shift pricing power away from earlier speculative rallies. Analysts also point to midterm-year policy debates around trade, biofuel mandates and farm support that can inject uncertainty into softs markets, encouraging hedgers and funds to trim risk into this window.
What is driving Sugar (SB) today?
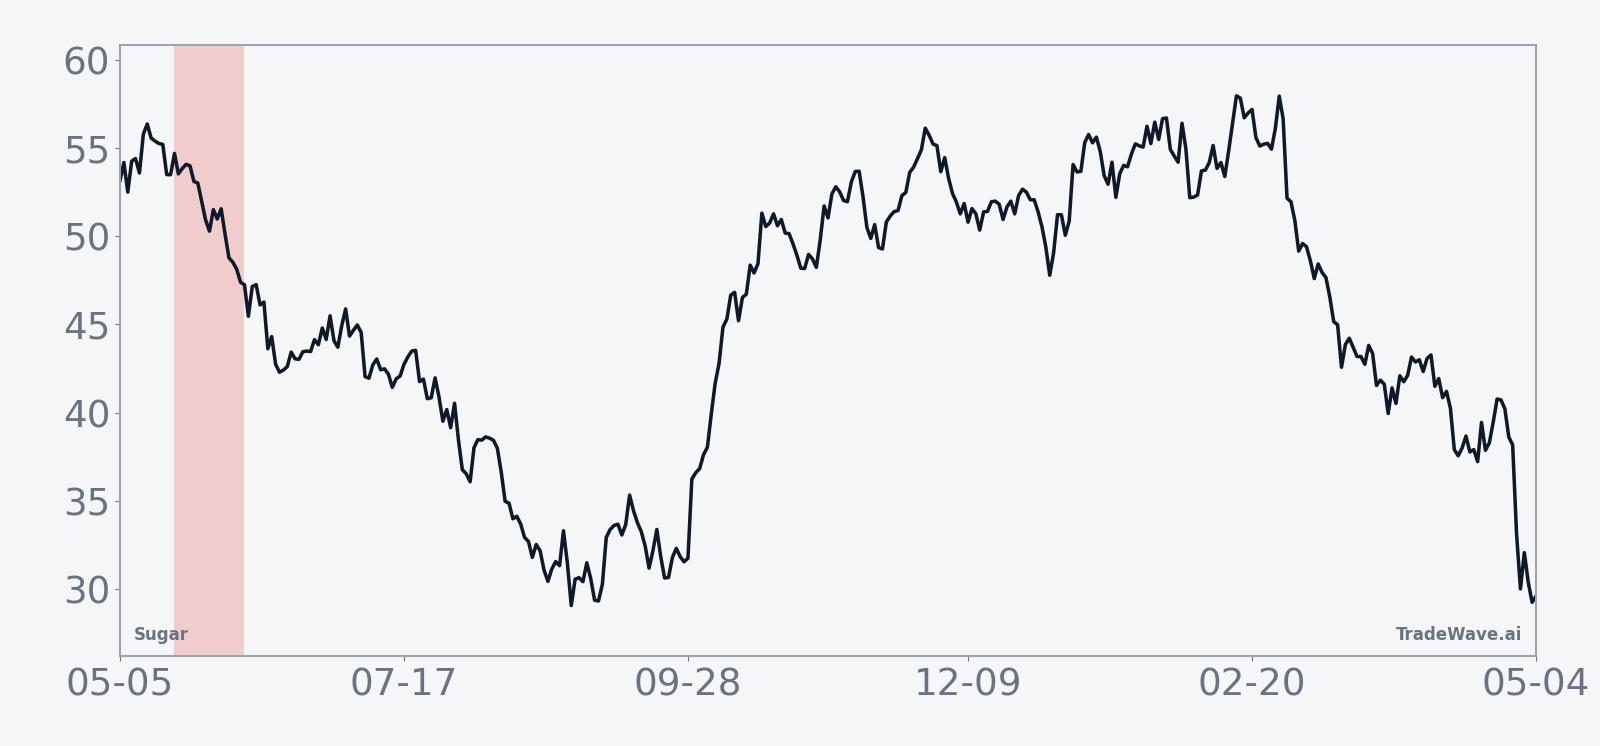
Sugar futures climbed 2.7% on Thursday to 15.38 cents, trading between an intraday low of 14.95 and a high of 15.41 as volume of about 82,857 contracts ran slightly above the recent 20-day average of 78,000. The contract sits roughly in the middle of its 52-week band between 13.46 and 18.29, with prices also holding above the 50-day moving average near 14.49, a setup that leaves bulls and bears both with room to argue their case into the upcoming seasonal window.
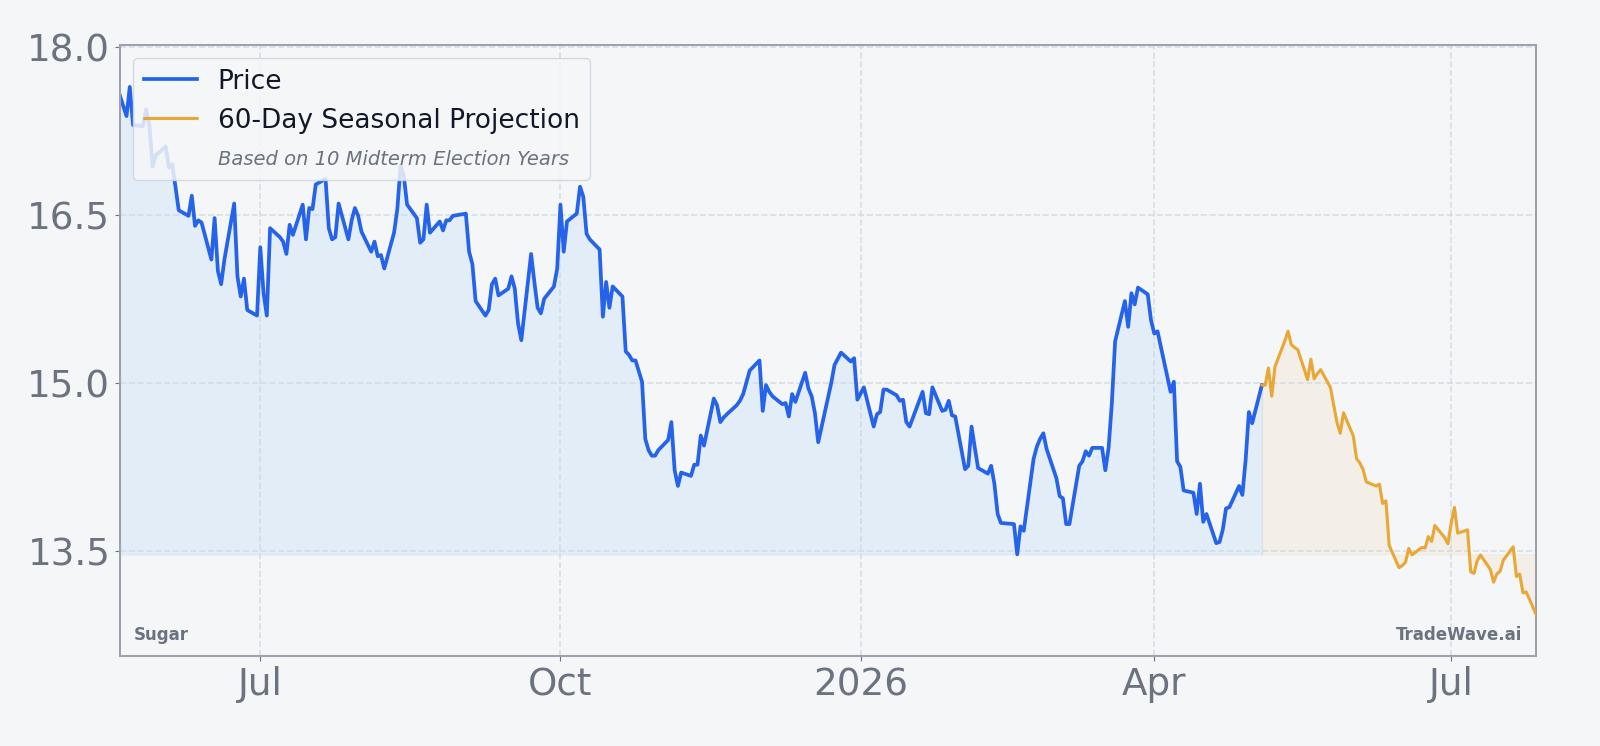
The chart below situates the latest move in its recent multi-month context and overlays a 60-day seasonal projection.
What should traders watch in this Sugar (SB) window?
With the 19-day mid-May window about to open, the first thing to watch is whether Sugar can hold above the 50-day moving average around 14.49 as the pattern kicks in. A quick break back toward the 14-cent handle would be consistent with the historical midterm-year seasonal trend, while a sustained push toward the 52-week high near 18.29 would look more like one of the rare losing years for the short side.
Second, intraday ranges and volume will matter. Past windows have seen maximum favorable and adverse excursions that run well beyond the final net move, so a pickup in daily volatility without clear direction would not be unusual. Traders will be watching whether downside follow-through develops after early weakness, or whether sharp squeezes against shorts dominate the tape instead.
Finally, the broader policy and macro calendar could color how this pattern plays out. Midterm election years often bring shifting expectations around trade policy and biofuel demand, both of which can feed directly into Sugar pricing. If headlines skew toward tighter supply or stronger demand just as the seasonal window opens, that could blunt or even flip the historical pattern, while quieter policy conditions would leave the door open for the usual midterm-year softening to reassert itself.
Sources
About this seasonal analysis
Seasonal pattern data is sourced from TradeWave.ai, which analyzes historical price behavior across annual calendar windows going back up to 30 years. Read the full data methodology or the book The 100-Year Pattern by Afshin Moshrefi (2026 edition). Past performance of seasonal patterns does not guarantee future results. This article is for informational purposes only and does not constitute investment advice.