Sugar (SB) Has Dropped in 8 of 10 Midterm May 19 Windows, Favoring Bears Again
Sugar futures are trading quietly ahead of a 19-day midterm-election seasonal window that has usually favored the short side, creating a tactical test for soft-commodity traders.
What is the seasonal pattern for Sugar (SB)?
Sugar has fallen in 8 of 10 midterm-election-year windows starting around May 19, with an average 5.14% gain in winning short years.
- 8 for 10 in this window, with winning short years averaging 5.14% moves in the trade direction.
- Seasonal setup is short from May 19 for 19 trading days across the last 10 midterm election years.
- Percent Profitable is 80%, with 8 winners and 2 losers for the short pattern.
- Including all years, the average outcome is a 4% move in favor of shorts, reflecting some smaller losing cycles.
- Maximum favorable and adverse excursions inside the window have both been sizable, pointing to meaningful intraperiod volatility.
- TradeWave Ratio of 1.95 and a Sharpe ratio of 1.01 signal a historically efficient but not risk-free short window.
According to historical data from TradeWave.ai, this mid-May stretch in midterm election years has behaved differently from a typical month for Sugar, with a clear directional bias that traders often overlook.
How has Sugar (SB) traded in the upcoming May 19 midterm-year window?
Sugar has fallen in 8 of the last 10 midterm-election-year windows that start around May 19 and run for 19 trading days, with winning short years averaging a 5.14% move in favor of the bears. Futures settled Tuesday at 15.37 cents a pound, up 0.33% on the day and sitting between a 52-week low of 13.46 and a high of 18.29, a range that leaves room for either a fresh push lower or another squeeze higher before the window opens.
Grouping the data by the presidential election cycle matters here because this window only looks at the last 10 midterm election years, a phase that often brings shifting policy expectations and position resets across commodities. Sugar sits inside that mid-cycle backdrop today, with this specific May 19 trading window capturing how producers, refiners and macro funds have historically adjusted exposure as the year moves from early uncertainty toward the stronger pre-election year that follows.
The historical seasonal average shows Sugar typically drifting lower through much of the 19-day stretch, with the bulk of the move accruing in the middle of the window rather than at the open or close. That profile fits a short setup where prices often soften gradually as hedging and macro flows build, instead of collapsing in a single air pocket.
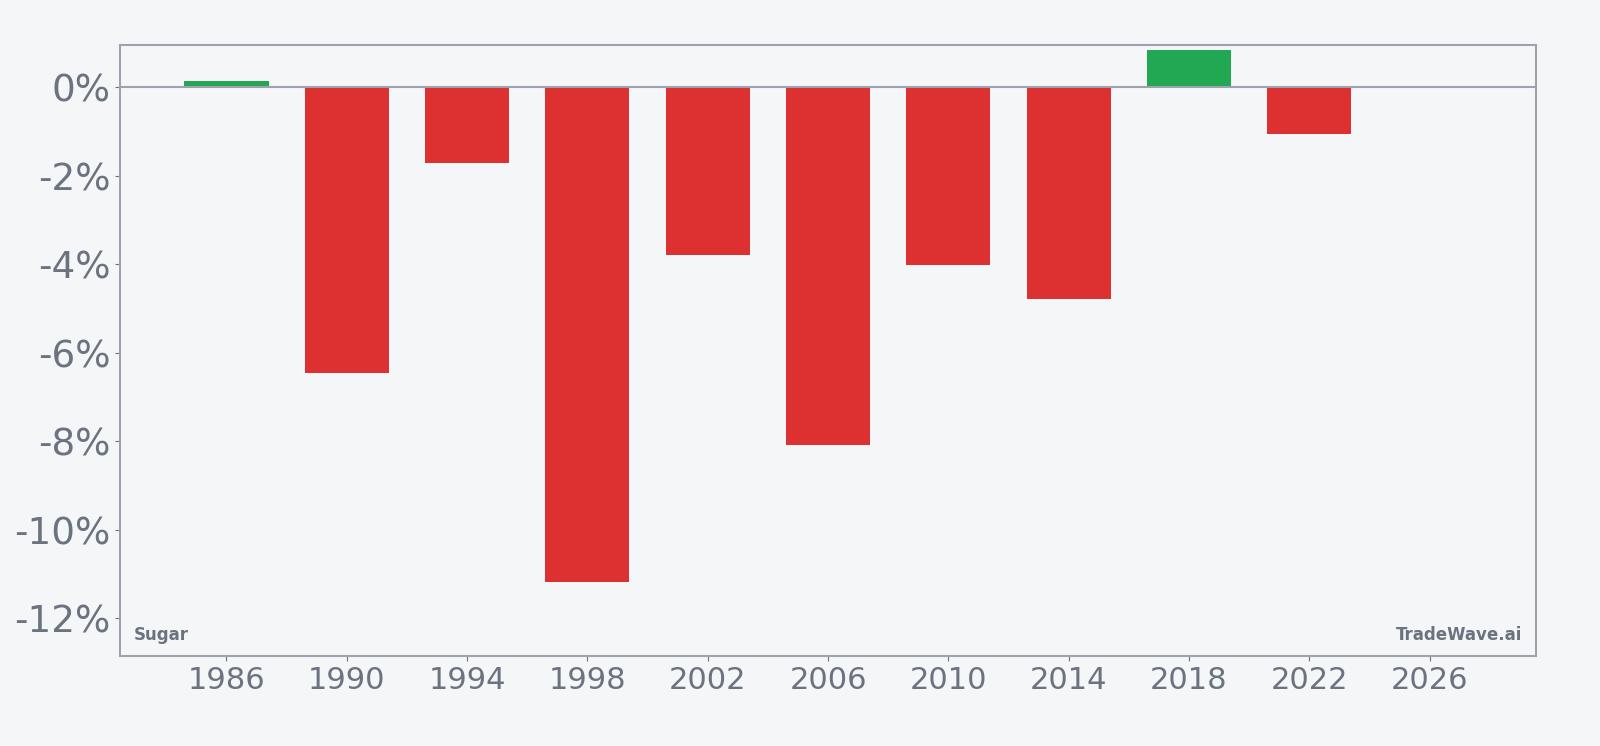
Year-by-year bars that combine net results with peak run-ups and worst drawdowns show how far Sugar has tended to swing inside this window.
Across the 10 midterm-year samples, the pattern has delivered an 80% hit rate for shorts, with 8 winners and 2 losers, and an all-years average move of 4% in favor of the short side. The strongest short year in the sample came in 1998, when Sugar fell 11.19% during the window, while 1990 also posted a sizable 6.47% decline, both aligning with the short bias. On the flip side, 2018 and 1986 were modest losing years for shorts, with Sugar edging higher by 0.83% and 0.14% respectively, reminding traders that even a strong seasonal tendency can misfire.
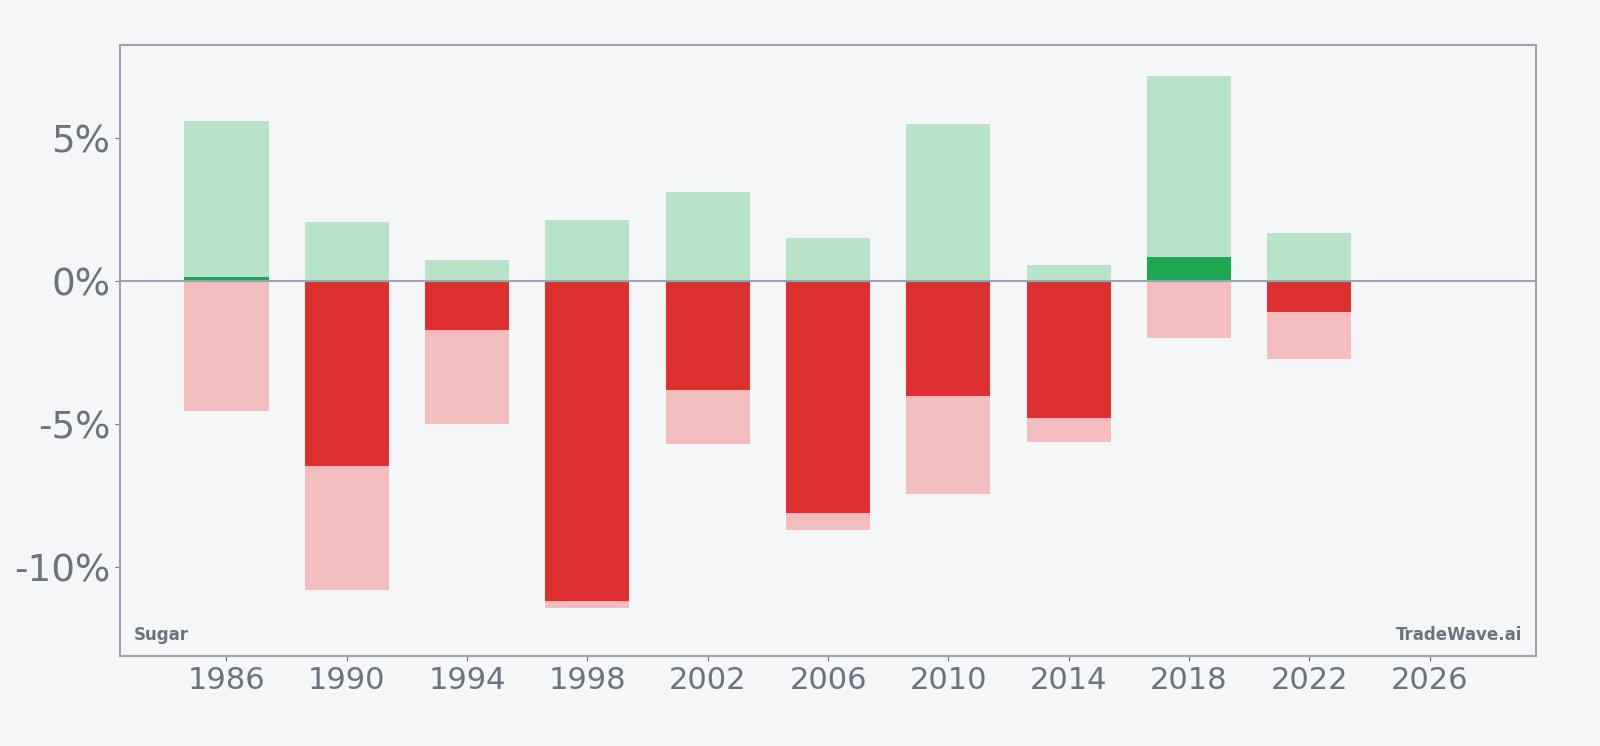
The maximum favorable excursions, which capture the best point-to-peak move in the trade direction, have often been larger than the final net results, underscoring how intraperiod swings can overshoot before partial reversals. At the same time, maximum adverse excursions show that even in winning short years, Sugar has sometimes squeezed several percentage points higher before rolling over, a pattern that can stress risk limits for traders who size too aggressively.
The TradeWave Ratio of 1.95 suggests that, on average, Sugar has traveled meaningfully in the short direction inside the window relative to its typical noise, while a Sharpe ratio of 1.01 points to a historically favorable but not extreme risk-adjusted profile. Add it up and this mid-May seasonal window has been a consistent, short-biased stretch for Sugar in midterm election years, with enough volatility on both sides to reward disciplined risk management more than blind pattern-following.
History does not guarantee future results, and maximum adverse excursions inside this window have at times been large enough to challenge even profitable short setups.
Why does Sugar (SB) follow this seasonal pattern?
This pattern may reflect commodity supply and demand seasonality as the Northern Hemisphere growing season ramps up and crop expectations firm. Analysts often point to hedging flows from producers and refiners, along with macro funds adjusting soft-commodity exposure as they reassess inflation and policy risks in the middle of the presidential cycle. In midterm election years, that mix of physical hedging and macro repositioning can cluster in late May, creating a repeatable short bias in Sugar even when the broader trend is mixed.
What is driving Sugar (SB) today?
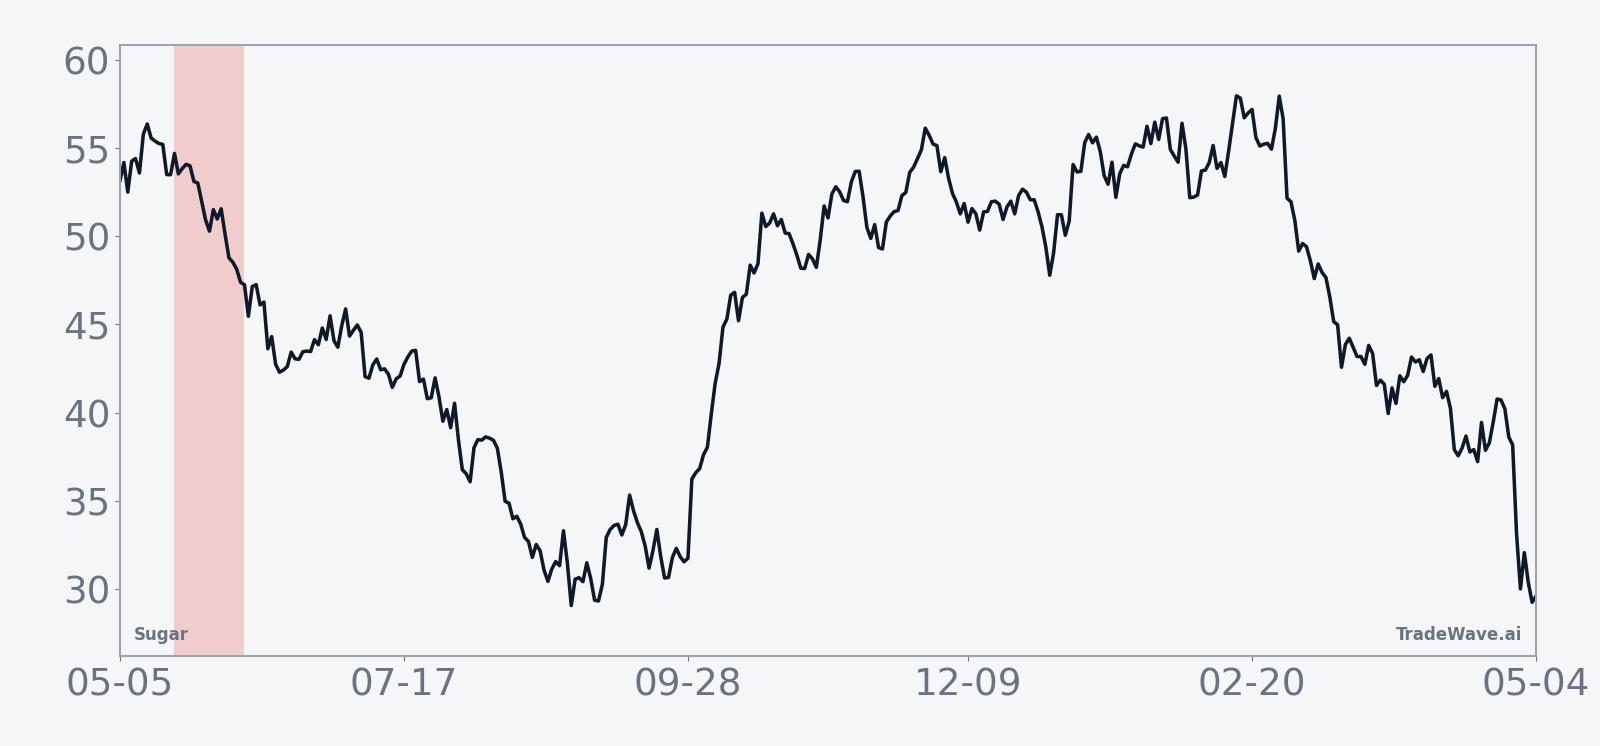
Sugar futures on the ICE exchange closed at 15.37 cents a pound on May 6, up 0.05 cents or 0.33% on the session, with intraday trade contained between 15.21 and 15.49 as roughly 108,900 contracts changed hands. That leaves SB about 16.0% below its 52-week high of 18.29 and roughly 14.2% above the 52-week low of 13.46, a middle-of-the-range posture that gives the upcoming seasonal window room to matter either way.
The chart below situates the latest move in its recent multi-month context alongside a 60-day seasonal projection.
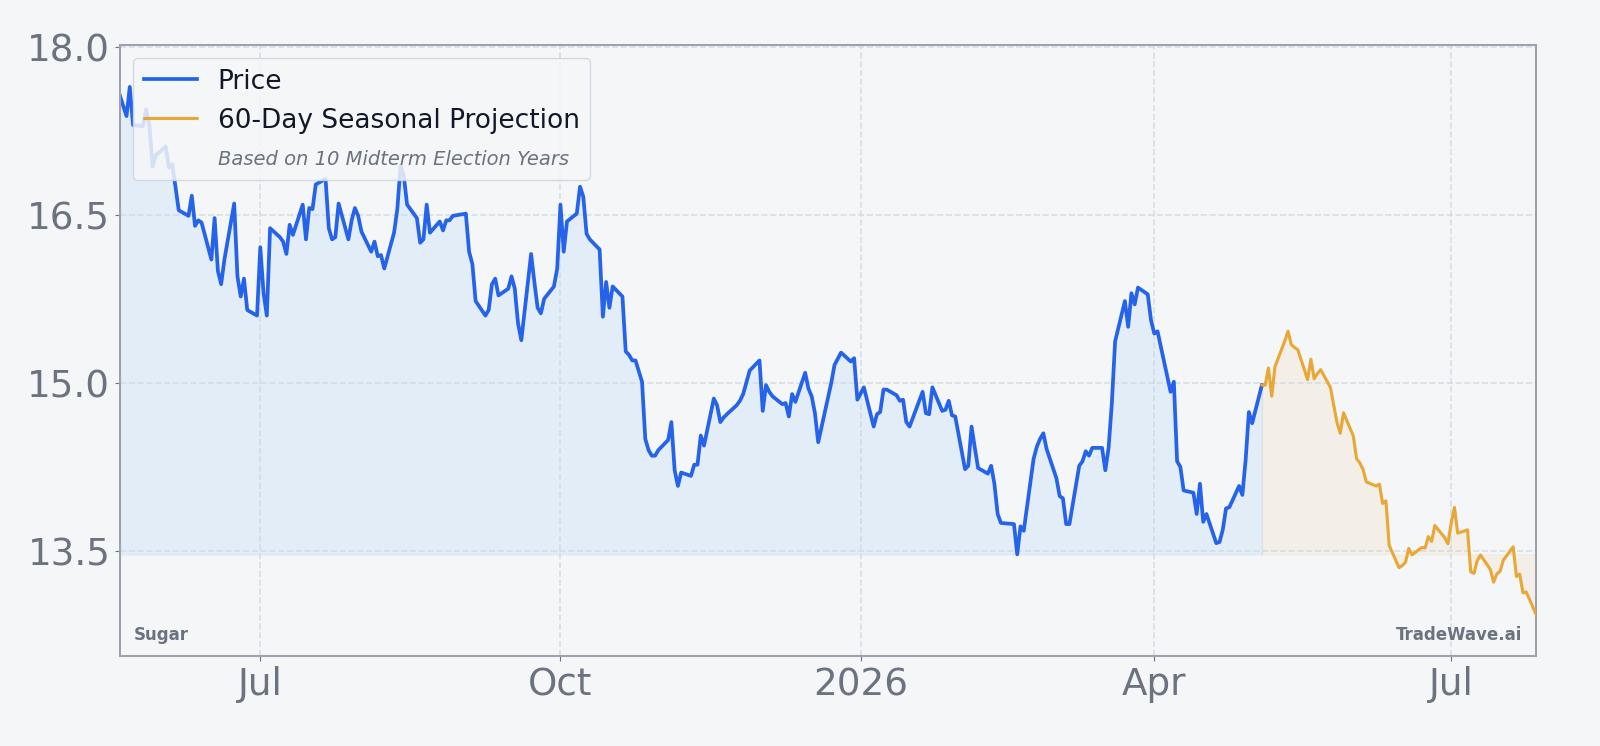
Average 20-day volume near 78,000 contracts and a 50-day simple moving average around 14.49 cents show that current prices are modestly above trend but not stretched, which can make short-biased seasonal windows more relevant as traders look for mean reversion. With no single macro or policy headline dominating the tape, the focus into mid-May is likely to fall on how Sugar behaves as it approaches this historically weak midterm-year stretch and whether price respects or rejects the pattern.
What should traders watch as the May 19 Sugar window approaches?
First, watch how SB trades as it nears the 15-cent area and the 50-day moving average; a decisive break back toward that band during the window would line up with the historical short bias, while a sustained push toward 17 to 18 cents would look more like one of the rare losing years for the pattern. Second, monitor intraday volatility and the size of early squeezes: in prior cycles, some of the best short entries came after Sugar first popped higher inside the window before rolling over.
Third, keep an eye on the broader policy and macro backdrop typical of midterm election years, where shifting expectations around fiscal spending, trade policy and inflation can ripple through soft commodities. Finally, track whether realized moves inside the window resemble the historical maximum favorable and adverse excursions; if Sugar starts to swing several percentage points in either direction, that behavior would confirm that this 19-day stretch remains a high-impact trading window even if the final net result diverges from the past.
Sources
About this seasonal analysis
Seasonal pattern data is sourced from TradeWave.ai, which analyzes historical price behavior across annual calendar windows going back up to 30 years. Read the full data methodology or the book The 100-Year Pattern by Afshin Moshrefi (2026 edition). Past performance of seasonal patterns does not guarantee future results. This article is for informational purposes only and does not constitute investment advice.