Natural Gas (CME) (NG) Has Fallen in Every Midterm Summer Window, Shorts Averaged 7.92%
Natural Gas (CME) is heading into a midterm-year seasonal window that has rewarded shorts every time in the past three decades, even as prices sit far below last year’s peak.
What is the seasonal pattern for Natural Gas (CME) (NG)?
Natural Gas (CME) has fallen in 8 of 8 midterm-year summer windows during this 111-day pattern, with an average gain of 7.92% for short positions in winning years.
- 8 for 8 in this window, with short trades averaging 7.92% gains across winning years.
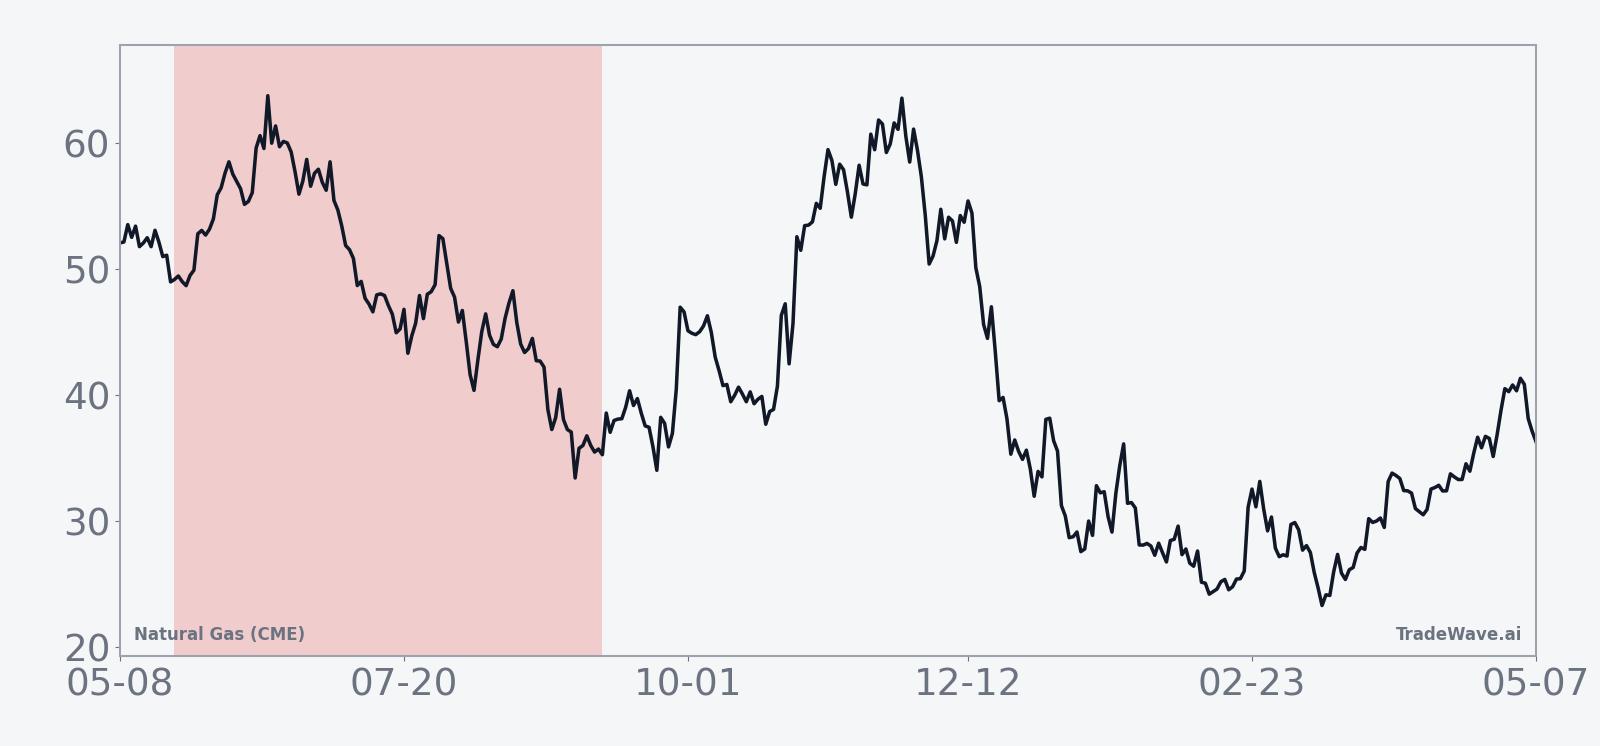
- The upcoming 111-day Natural Gas (CME) trading window starts on May 22 and runs deep into late summer.
- Percent Profitable is 100%, with 8 winners and 0 losers for the short-side pattern.
- Median profit for shorts in this NG seasonal trend is 8.74%, pointing to consistent downside follow-through.
- The TradeWave Ratio of 1.86 suggests price often travels meaningfully in the trade direction within the window before settling.
- A Sharpe ratio of 1.85 indicates historically strong risk-adjusted returns for this specific short window.
According to historical data from TradeWave.ai, this midterm-year stretch has behaved very differently from an average summer for natural gas, and the next iteration is about to begin.
How has Natural Gas (CME) (NG) traded in past midterm-year summer windows?
Natural Gas (CME) has delivered profitable short-side moves in every one of the last eight midterm election years during this 111-day window, with an average profit of 7.92% for shorts. Today the front-month NG contract trades around 2.833, well below the 52-week high of 7.827 and only modestly above the 52-week low of 2.561, leaving plenty of room on the chart in either direction.
Because this pattern is grouped by the presidential election cycle, it reflects how natural gas has behaved specifically in the midterm election year, not just any random summer. That matters for energy markets, since policy debates around regulation, LNG export approvals and power-sector emissions standards often intensify in mid-cycle years, shaping both demand expectations and producer hedging behavior.
Across the eight midterm-year samples, every single window ended with NG lower than where it started, which is what makes this Natural Gas (CME) trading window stand out. The median profit of 8.74% for shorts sits slightly above the average, a sign that the distribution of outcomes has been tight rather than driven by one outlier year.
Individual years show how that plays out. In 1998, NG dropped 12.46% from entry to exit, while in 2010 it fell 6.2% over the same calendar slice. Even the softest outcome in the set, 2002, still produced a 1.73% decline for the contract by the end of the window.
The next chart layers yearly net results with the best and worst intraperiod swings to show how far NG has tended to move inside the window.
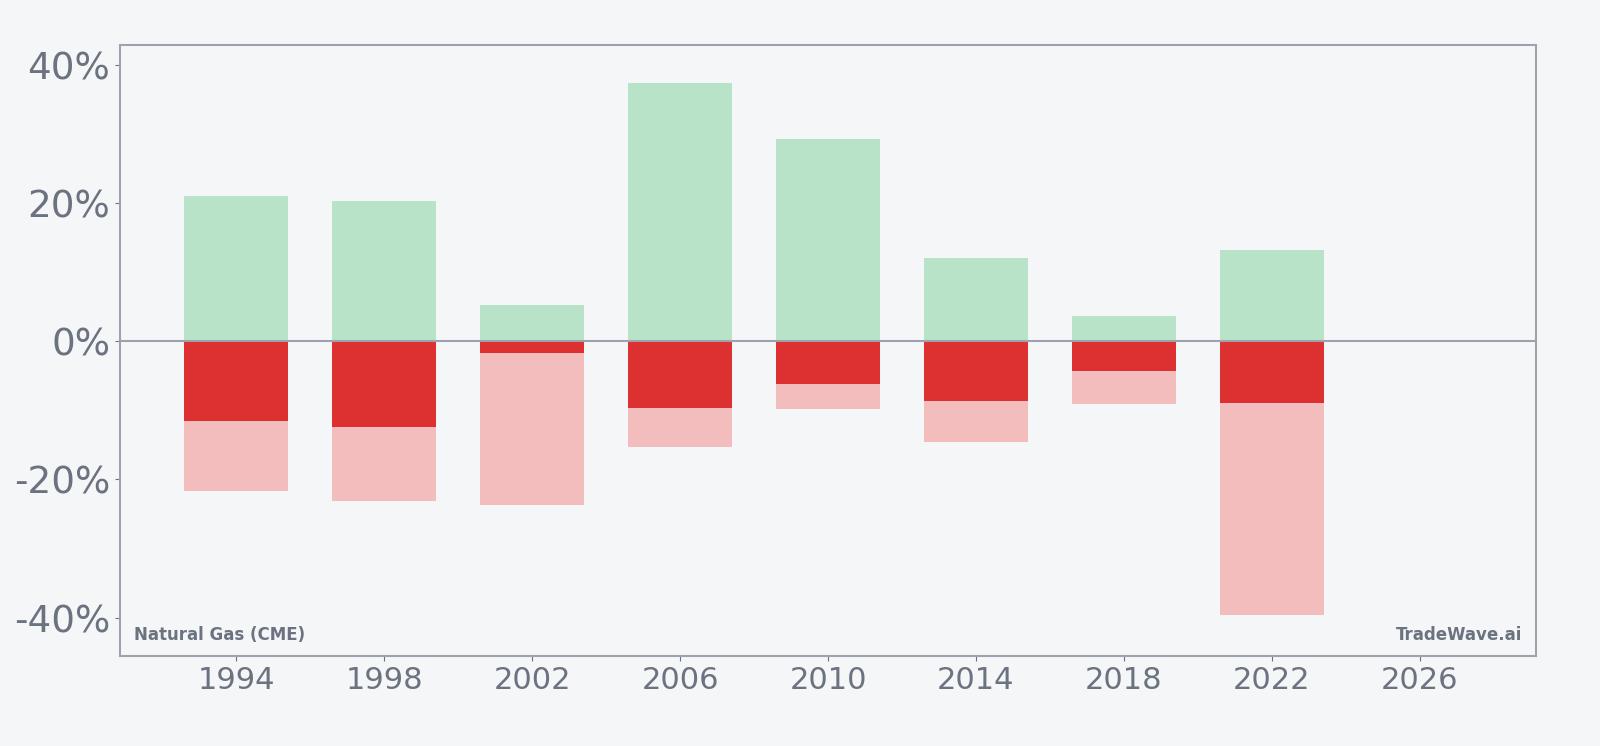
The maximum favorable move in several years has been large for shorts, with NG dropping as much as 37.33% from entry at the best point in 2006 before bouncing, while the worst intraperiod drawdown against the trade reached 39.69% in 2022 as prices briefly squeezed higher before rolling over. That mix of big maximum favorable and big maximum adverse excursions shows this is not a quiet drift lower but a high-variance window where rallies and selloffs can both be violent.
Trend metrics back that up. The pattern’s TradeWave Ratio of 1.86 suggests that, on average, NG has tended to travel materially in the trade direction inside the window, while a Sharpe ratio of 1.85 indicates that, based on end-of-window outcomes, the risk-adjusted profile has been unusually strong for a short setup. Add it up: eight for eight, with meaningful swings along the way.
History does not guarantee future results; adverse excursions can be large even in winning windows, and traders using this NG seasonal pattern have historically faced sharp squeezes before the trend reasserted.
Why does Natural Gas (CME) (NG) follow this seasonal pattern?
One likely driver is commodity supply and demand seasonality, as this window runs from late May through the heart of injection season when storage builds often weigh on prices. Analysts have also pointed to weather-driven demand, since early-summer shoulder months can see softer heating and only gradually rising cooling loads, muting consumption compared with winter peaks.[2] In midterm election years, policy debates around energy regulation and export infrastructure may further dampen risk appetite for aggressive long exposure, reinforcing the tendency for NG to sag during this stretch.[6]
What is driving Natural Gas (CME) (NG) today?
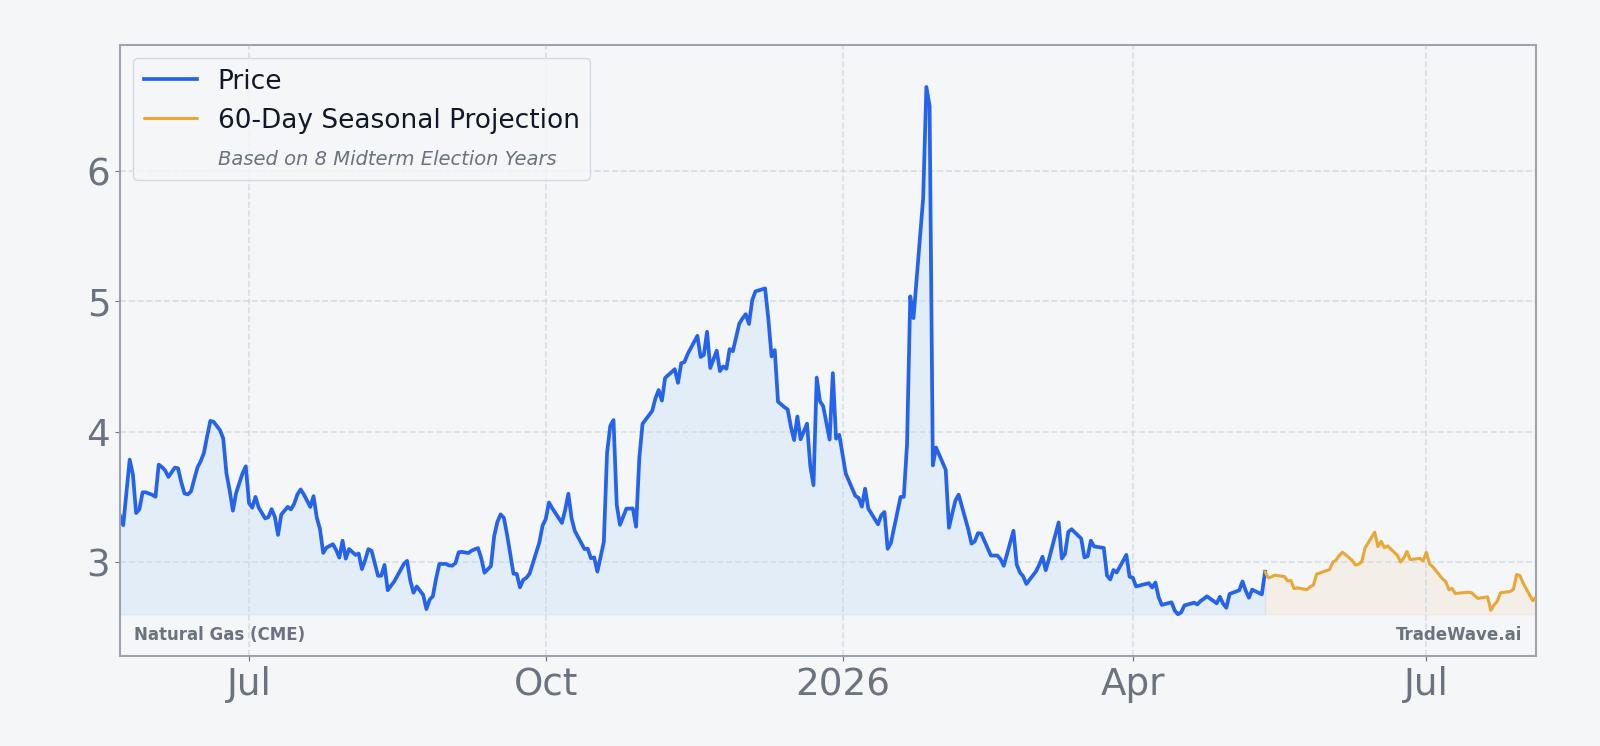
Front-month Natural Gas (CME) futures last traded at 2.833, down 0.35% on the day, after a 9.25% gain over the past month pulled prices off 52-week lows but left them far below last year’s spike above 7.8. The contract has spent much of the past year reacting to shifting weather patterns and storage expectations, with cold snaps in early 2026 briefly lifting prices before choppy trade returned as forecasts normalized.[2][5]
Weather-driven demand remains the dominant macro theme for NG, with temperature swings directly affecting heating and cooling loads and, by extension, power-sector gas burn.[2] Storage and inventory levels are the other key lever, as delayed or surprising storage data have repeatedly jolted futures in prior seasons when traders were leaning too far one way.[3] On the structural side, expectations for rising LNG exports and power demand into the back half of the decade continue to underpin the longer-term energy demand trend, even as near-term prices chop around these macro narratives.[6]
The chart below situates the latest move in its recent multi-month context alongside a 60-day seasonal projection.
What should traders watch as this NG seasonal window approaches?
With the midterm-year window set to open on May 22, the first watchpoint is how NG behaves around the 2.80 to 3.00 band that has recently acted as a pivot. A firm break higher through the 50-day moving average near 2.86 that holds into June would run counter to the historical pattern, while a failure to sustain rallies in that zone would be more in line with prior midterm-year summers.
Second, weekly U.S. storage reports and updated summer weather forecasts will be critical tells. Larger-than-expected injections or a shift toward milder temperatures could revive the classic injection-season pressure that has often coincided with this NG seasonal trend in past cycles.[3][4] Conversely, persistent heat waves or supply disruptions could blunt or even overwhelm the historical downside bias.
Finally, traders should keep an eye on policy and export headlines that touch LNG capacity, pipeline approvals and power-sector emissions rules, since these have shaped sentiment around natural gas demand in prior years.[6] If those stories line up with softer demand signals and NG once again struggles to hold rallies during the 111-day window, it would mark a clean continuation of the eight-for-eight midterm-year pattern; if instead prices grind higher through the summer, it would be the first real break in this particular slice of the calendar.
Sources
- [1] Reuters, "US natgas prices gain over 2% on mid-July heat forecasts, more cooling demand," Jul 2, 2025.
- [2] MarketWatch, "Natural-gas prices soar as temperatures drop," Jan 20, 2026.
- [3] The Wall Street Journal, "U.S. Natural Gas Futures Gain Ahead of Delayed Storage Data," Dec 29, 2025.
- [4] The Wall Street Journal, "U.S. Natural Gas Futures Extend Decline," Dec 12, 2025.
- [5] The Wall Street Journal, "U.S. Natural Gas Futures Slip in Choppy Trade," Feb 19, 2026.
- [7] The Wall Street Journal, "U.S. Natural Gas Futures Post Daily Gain, Weekly Loss," Dec 19, 2025.
About this seasonal analysis
Seasonal pattern data is sourced from TradeWave.ai, which analyzes historical price behavior across annual calendar windows going back up to 30 years. Read the full data methodology or the book The 100-Year Pattern by Afshin Moshrefi (2026 edition). Past performance of seasonal patterns does not guarantee future results. This article is for informational purposes only and does not constitute investment advice.