9 of 10 Midterm Summers End Lower for Lumber (CME) (LBR) as July Window Nears
Lumber futures are flat near $629 as traders head toward a midterm-year summer window that has usually rewarded shorts and added volatility to an already tight market.

What is the seasonal pattern for Lumber (CME) (LBR)?
Lumber (CME) has fallen in 9 of the last 10 midterm-year summer windows starting around Jul 2, with average winning short trades gaining 7.93%.
- 9 for 10 in this window, with winning short years averaging 7.93% gains and a 7% average across all years.
- The 25-day trading window begins on Jul 2 and has historically favored downside moves for Lumber (CME) in midterm election years.
- Percent Profitable is 90%, with 9 winners and just 1 loser across the last 10 qualifying cycles.
- Avg Profit reflects winners only at 7.93%, while Avg Profit - All, which includes the lone losing year, still comes in at 7%.
- The TradeWave Ratio of 2.04 suggests price often travels meaningfully in the short direction within the window before final settlement.
- Intraperiod swings have been sizable, with both strong favorable moves for shorts and occasional deep adverse excursions in individual years.
According to historical data from TradeWave.ai, this midterm-year summer stretch in lumber behaves very differently from an average month on the calendar, and the next iteration is just weeks away.
How has Lumber (CME) (LBR) traded in past midterm-year summer windows?
The upcoming 25-day window starting Jul 2 has been a remarkably consistent bearish stretch for Lumber (CME), with short positions winning in 9 of the last 10 midterm election years and average gains of 7.93% in those winning years. Today the front-month contract is pinned at $629, unchanged on the session and sitting about 10% below its 52-week high of $698.50, after a 3.3% gain over the past month that leaves prices still well above the 50-day moving average around $588.46.
Grouping the data by the presidential election cycle matters here because lumber demand is tightly linked to housing, construction and fiscal policy, all of which tend to follow a four-year rhythm as Washington shifts priorities between stimulus, regulation and infrastructure. The current calendar year is the midterm election year in that cycle, and this pattern specifically looks at how lumber has behaved in the last 10 midterm years during this early-July slice.
Historically this window has favored shorts. Percent Profitable sits at 90%, with 9 winning short years against just 1 losing year, and the all-years average return is still a solid 7% in favor of the short side. Avg Profit reflects only the winning years at 7.93%, while Avg Profit - All folds in the lone loss and still lands at 7%, which is unusually strong for a 25-day futures window.
The per-year breakdown shows how that plays out in practice. In 2018, a short entered around 575.52 and exited near 478.24, a net move of about 16.9% in favor of the short, with the worst intraperiod drawdown from entry (the maximum adverse excursion) reaching roughly 18.31% before the trade finished deep in the money. In 2022, a similar pattern unfolded, with a short from about 656.91 to 556.52 producing a 15.28% gain while enduring a maximum adverse move of 19.15% along the way.
Those two years anchor the pattern, but even the more modest cycles have leaned bearish. The smallest net win for shorts came in 2010, when the contract slipped just 0.97% from entry to exit, yet still delivered a positive result for the trade direction after a maximum favorable move of 4.51% and a maximum adverse move of 5.34%. The only losing year in the sample is 1994, when lumber rallied enough to leave shorts down 1.14% at exit despite an 8.81% intraperiod drop that briefly favored the trade.
Viewed through the lens of risk-adjusted returns, the Sharpe ratio of 1.15 for this window is high for a short-duration commodity pattern, especially given a standard deviation of 5.9% across end-of-window outcomes. The TradeWave Ratio (TWR) of 2.04 captures how far price typically travels in the trade direction within the window, independent of the final close, and it reinforces the idea that when this pattern works, it often moves with conviction.
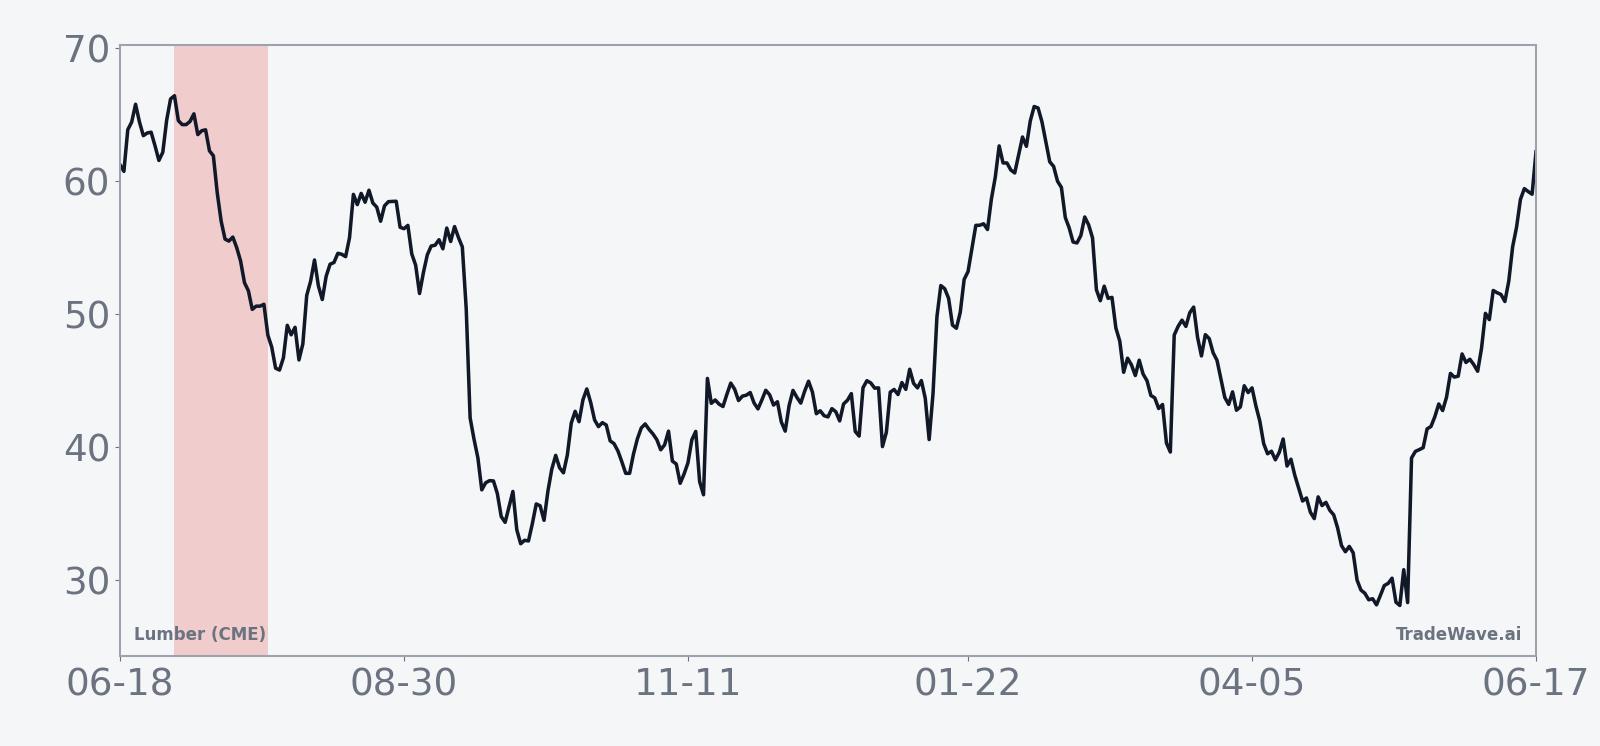
The historical seasonal trend chart for this window shows that most of the downside for lumber tends to accrue in the middle of the 25-day stretch rather than in a straight line from day one. Early days often see choppy price action with both favorable and adverse swings, followed by a more persistent drift lower into the back half of the window before stabilizing near the exit date.
The cumulative return profile across the last 10 midterm years backs that up. When you stack the windows on top of each other, the average path slopes steadily in favor of shorts, with only brief pauses where prior years saw countertrend bounces. Add it up and the cumulative return across the sample is 94% in the trade direction, which is a big number for a pattern that only runs for about five trading weeks each cycle.
Year-by-year bars with maximum favorable and adverse moves show how often shorts have worked and how deep the swings have run.
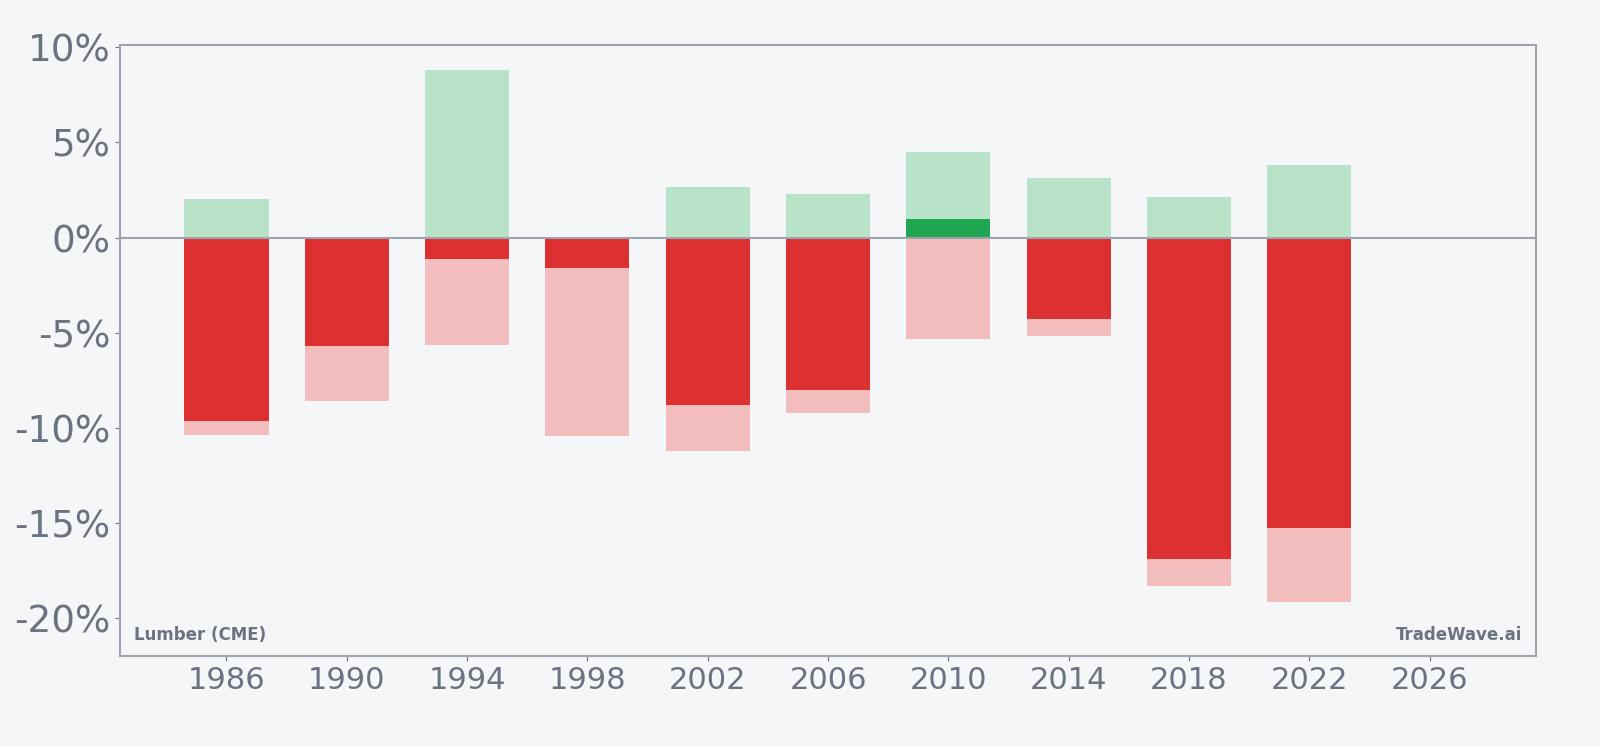
History does not guarantee future results, and maximum adverse excursions have at times been large even in years that ultimately finished as winning shorts.
Why does Lumber (CME) (LBR) follow this seasonal pattern?
This midterm-year summer pattern in lumber likely reflects a mix of commodity supply and demand seasonality and the policy calendar. One likely driver is that early summer often coincides with a lull between spring building activity and late-summer project starts, which can soften demand just as mills keep output steady. At the same time, midterm-year budget wrangling and uncertainty around housing incentives or infrastructure spending may encourage builders and wholesalers to run leaner inventories, amplifying downside pressure in this specific slice of the calendar.
What is driving Lumber (CME) (LBR) today?
Lumber (CME) futures are treading water at $629, unchanged on the day after a quiet session that saw prices trade between $628 and $632 on light volume of 755 contracts. The contract is about 10% below its 52-week high of $698.50 and comfortably above its 52-week low of $496, with a 3.3% gain over the past month and spot levels sitting roughly $40 above the 50-day moving average near $588.46.
The chart below situates the latest move in its recent multi-month context alongside a 60-day seasonal projection.
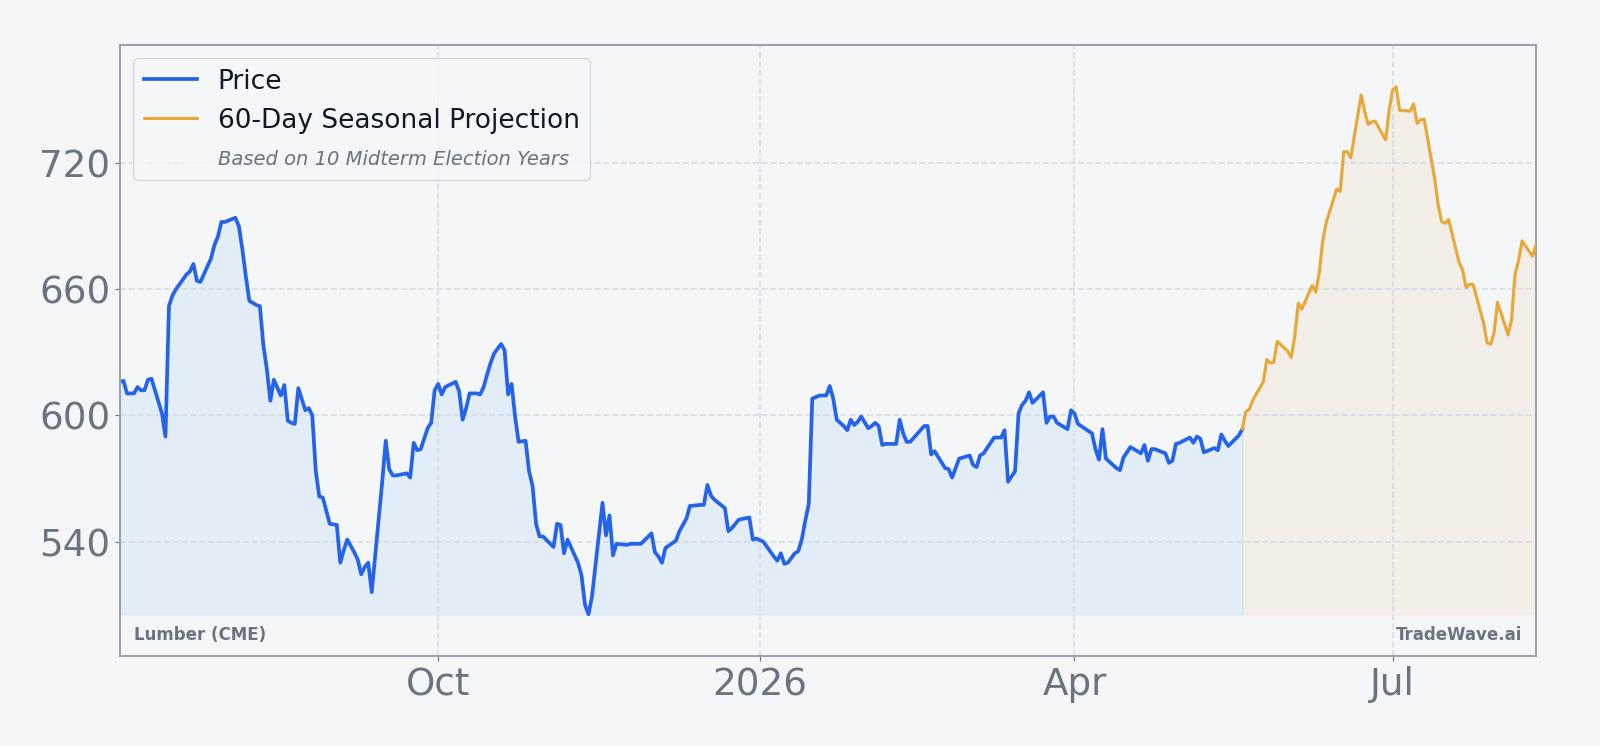
With no major macro or policy headlines specific to lumber on the tape, the market tone looks more like position-squaring ahead of the July seasonal window than a reaction to fresh news. Open interest and volume remain modest, suggesting many participants are waiting for clearer signals from housing data, mortgage rates and construction spending before leaning harder into directional bets.
What should traders watch as this seasonal window approaches?
For this midterm-year cycle, the key watchpoint is how lumber behaves as the Jul 2 window opens relative to its current perch near the upper half of the 12-month range. If prices start to roll over while staying below the 52-week high and drift back toward the 50-day moving average, that would line up with the historical pattern of mid-window weakness. A sustained break above the recent high band, by contrast, would look more like the rare 1994-style outlier where shorts struggled despite an early dip.
Macro-wise, the most important catalysts are upcoming housing starts, building permits and any policy chatter around infrastructure or housing support that could alter demand expectations. Stronger-than-expected construction data could blunt the usual seasonal downside, while softer prints or tighter financing conditions would fit the historical script of a softer early-summer stretch for lumber.
Traders should also keep an eye on intraday volatility once the window opens. Past cycles show that even winning short years often saw sharp countertrend rallies before the trade direction reasserted itself, with maximum adverse excursions in the mid-teens in some cases. If early July brings wide ranges and fast reversals rather than a smooth drift, that would not contradict the pattern; it would echo how this window has typically played out.
Finally, watch how positioning and spreads evolve between nearby and deferred contracts as the window progresses. A build-up of short interest alongside weakening nearby prices and softer cash-market demand would be consistent with the historical seasonal trend. On the other hand, if basis firms and deferred contracts hold up while the front month chops sideways, it could signal that structural demand is strong enough to mute what has usually been a bearish midterm-year summer for lumber.
Sources
About this seasonal analysis
Seasonal pattern data is sourced from TradeWave.ai, which analyzes historical price behavior across annual calendar windows going back up to 30 years. Read the full data methodology or the book The 100-Year Pattern by Afshin Moshrefi (2026 edition). Past performance of seasonal patterns does not guarantee future results. This article is for informational purposes only and does not constitute investment advice.