10-for-10 Late-June Slide: Lean Hogs (LH) Has Delivered Nearly 15% Average Short-Side Gains
Lean Hogs futures are heading into a late-June trading window that has delivered double-digit downside for shorts in every year of the past decade, creating a focused volatility pocket for livestock traders.
What is the seasonal pattern for Lean Hogs (LH)?
Lean Hogs has fallen in 10 of 10 years during this late-June 27-day window, with an average 14.97% gain for short positions in winning years.
- 10 for 10 in this window, with short positions averaging 14.97% gains across the past decade.
- The upcoming seasonal window starts on Jun 18, 2026 and runs for 27 trading days, historically favoring downside in Lean Hogs.
- Percent Profitable sits at 100%, with 10 winners and 0 losers for the short-side pattern.
- Average annualized return for the setup is 14.68%, with a cumulative 293% gain for shorts over the 10-year sample.
- The TradeWave Ratio of 1.89 signals that price has typically traveled meaningfully in the trade direction within the window, even before final settlement.
- Intraperiod swings have been sharp, with years like 2018 and 2024 showing deep adverse moves for longs as prices slid hard during the window.
According to historical data from TradeWave.ai, this late-June stretch in Lean Hogs has behaved very differently from an average month on the calendar, and the next iteration is only days away.
How has Lean Hogs (LH) traded in this late-June seasonal window?
Lean Hogs has fallen in every single late-June 27-day window for the past 10 years, with short positions averaging nearly 15% gains. The next iteration of that pattern begins on Jun 18, 2026, catching the market just a few days after the most recent close around 96 cents per pound and within a band that has seen prices swing between roughly 77 and 113 over the past year.
Across the 10-year sample, the pattern is unambiguously short-biased. Percent Profitable is 100%, with 10 winners and no losing years for traders positioned for downside. Average profit for those winning short trades is 14.97%, while the cumulative return across all windows reaches 293%, a hefty payoff for a relatively tight 27-day slice of the calendar.
The distribution of outcomes is not just about frequency but also magnitude. Median profit sits at 12.64%, which means half of the years delivered at least low double-digit gains for shorts. The annualized return of 14.68% and a Sharpe ratio of 1.7 point to a pattern that has historically combined strong returns with a relatively consistent payoff profile for this specific Lean Hogs trading window.
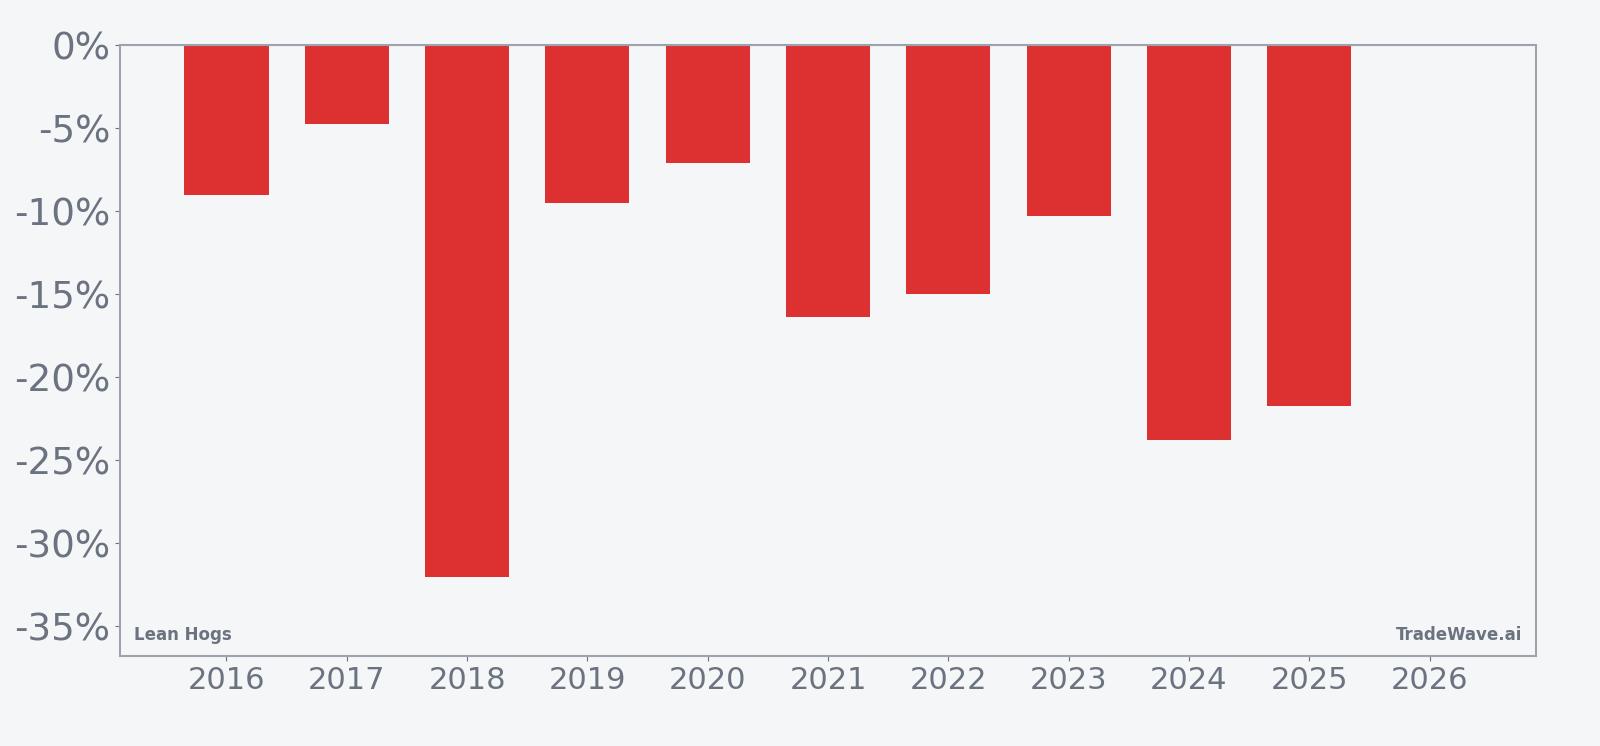
Intraperiod behavior has been volatile. In 2018, for example, Lean Hogs dropped 32.01% from entry to exit during the window, with the worst drawdown from the entry level reaching 34.75% as prices slid from 79.425 to 54.0. In 2024, the contract fell 23.81% over the window, with the worst adverse move from entry at 24.43% as prices broke from 91.575 to 69.775. Those years show how quickly downside can compound when the seasonal pattern lines up with broader selling pressure.
Even in milder years, the short-side edge has been clear. The smallest net decline in the sample came in 2017, when Lean Hogs fell 4.77% from 83.9 to 79.9 during the window, yet the maximum favorable move for shorts still reached 8.55% at the intraperiod low. In 2020, the contract slipped 7.11% from 53.475 to 49.675, with a worst drawdown from entry of 11.13% before the move stabilized.
The 10-year seasonal trend chart shows that weakness in Lean Hogs has tended to build as the window progresses rather than arriving in a single shock. The average path slopes lower through most of the 27 days, suggesting that in prior years rallies during this stretch have often been sold into rather than marking durable turning points.
Year-by-year bars that combine net results with peak favorable and adverse moves highlight how consistently this window has rewarded shorts while still delivering sizable swings.
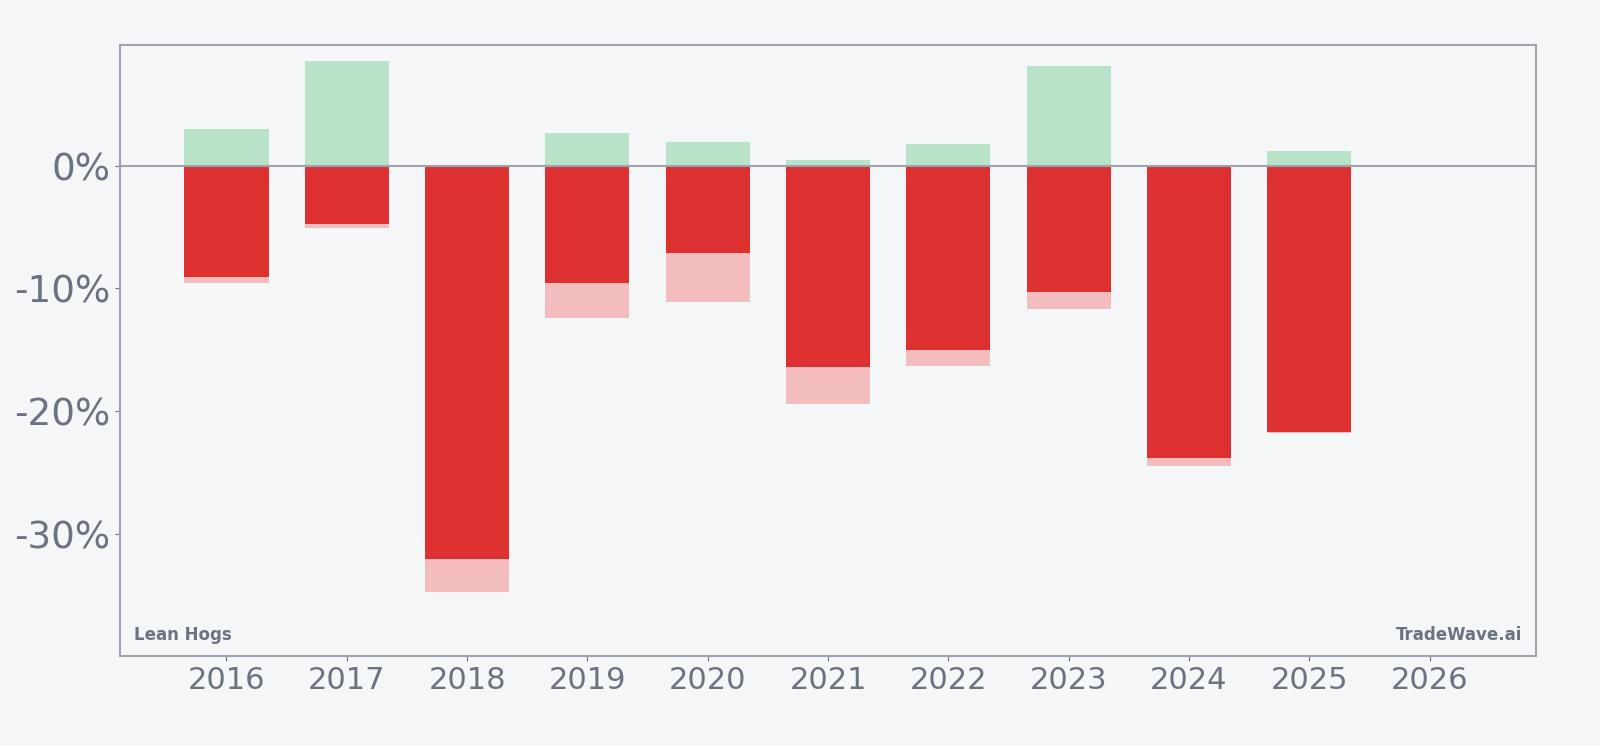
The combined net, maximum favorable excursion and maximum adverse excursion bars show a window that has historically offered shorts both meaningful follow-through and real risk. Maximum favorable moves for shorts have often pushed into double digits, while maximum adverse moves have at times approached or exceeded those levels, underscoring that rallies against the trade can be sharp even when the final outcome favors the seasonal pattern.
History does not guarantee future results; adverse excursions can be large even in winning windows, and traders can still lose money if timing or risk management is off.
Why does Lean Hogs (LH) follow this seasonal pattern?
This late-June Lean Hogs seasonal pattern likely reflects commodity supply and demand seasonality more than technical quirks. Analysts often point to summer hog market dynamics, including heavier slaughter weights, shifting grilling demand and evolving feed costs, as drivers of mid-year price pressure. The repeated downside in this specific window may capture a period when supply tends to outpace demand, leaving futures vulnerable to air pockets once hedging flows and speculative positioning line up.
What is driving Lean Hogs (LH) today?
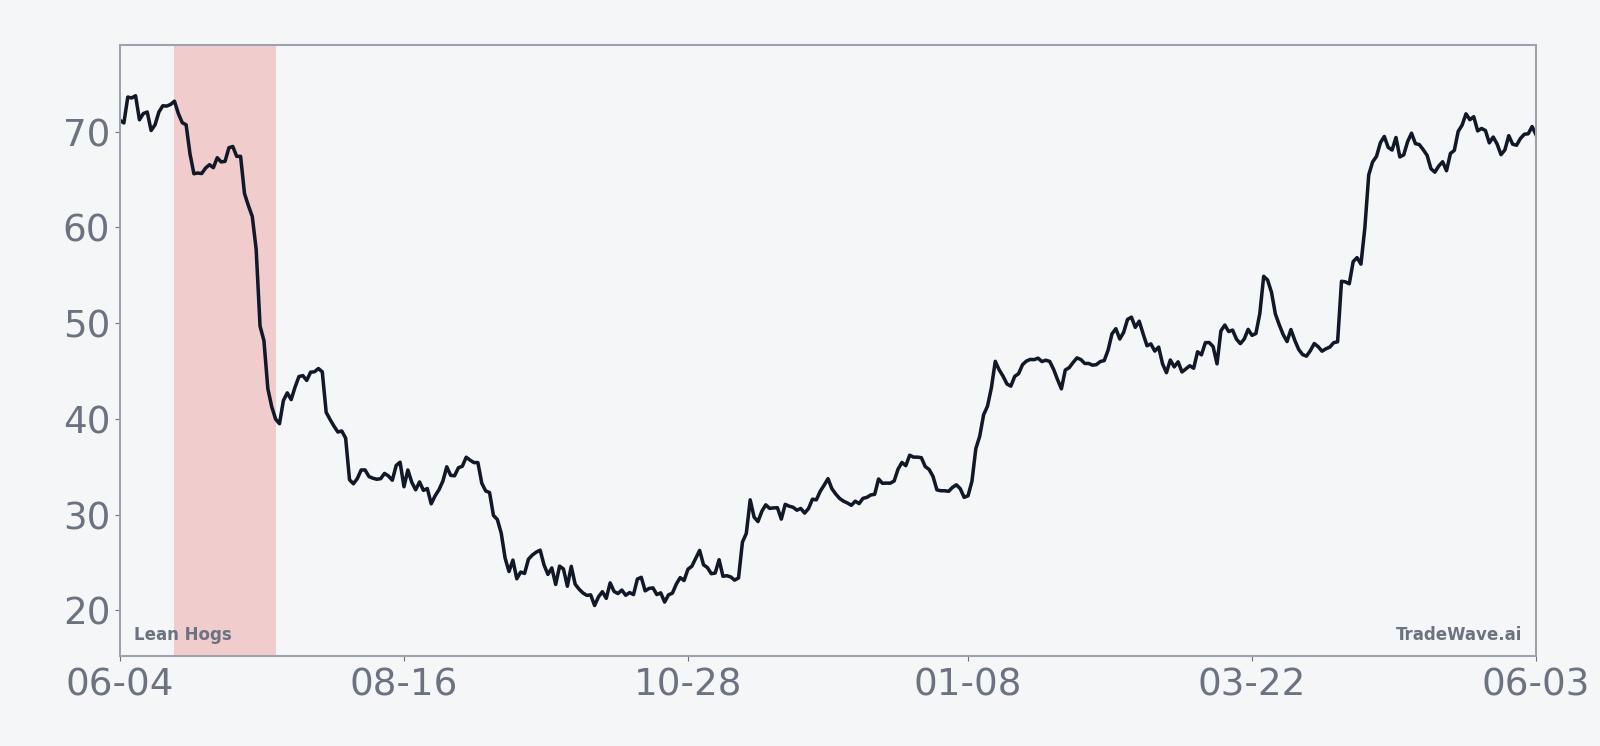
Lean Hogs futures are trading without a fresh fundamental catalyst on Jun 15, 2026, but the contract has already pulled back about 7.84% over the past month from recent highs, leaving prices below the 50-day moving average near 97.79 and well off the 52-week peak around 113.375. That slide has unfolded as traders weigh softer livestock demand signals against still-tight margins for producers, with volumes over the past 20 sessions averaging just over 23,000 contracts a day, a moderate pace for the complex.
The chart below situates the latest pullback against the past year of trading and a 60-day seasonal projection.
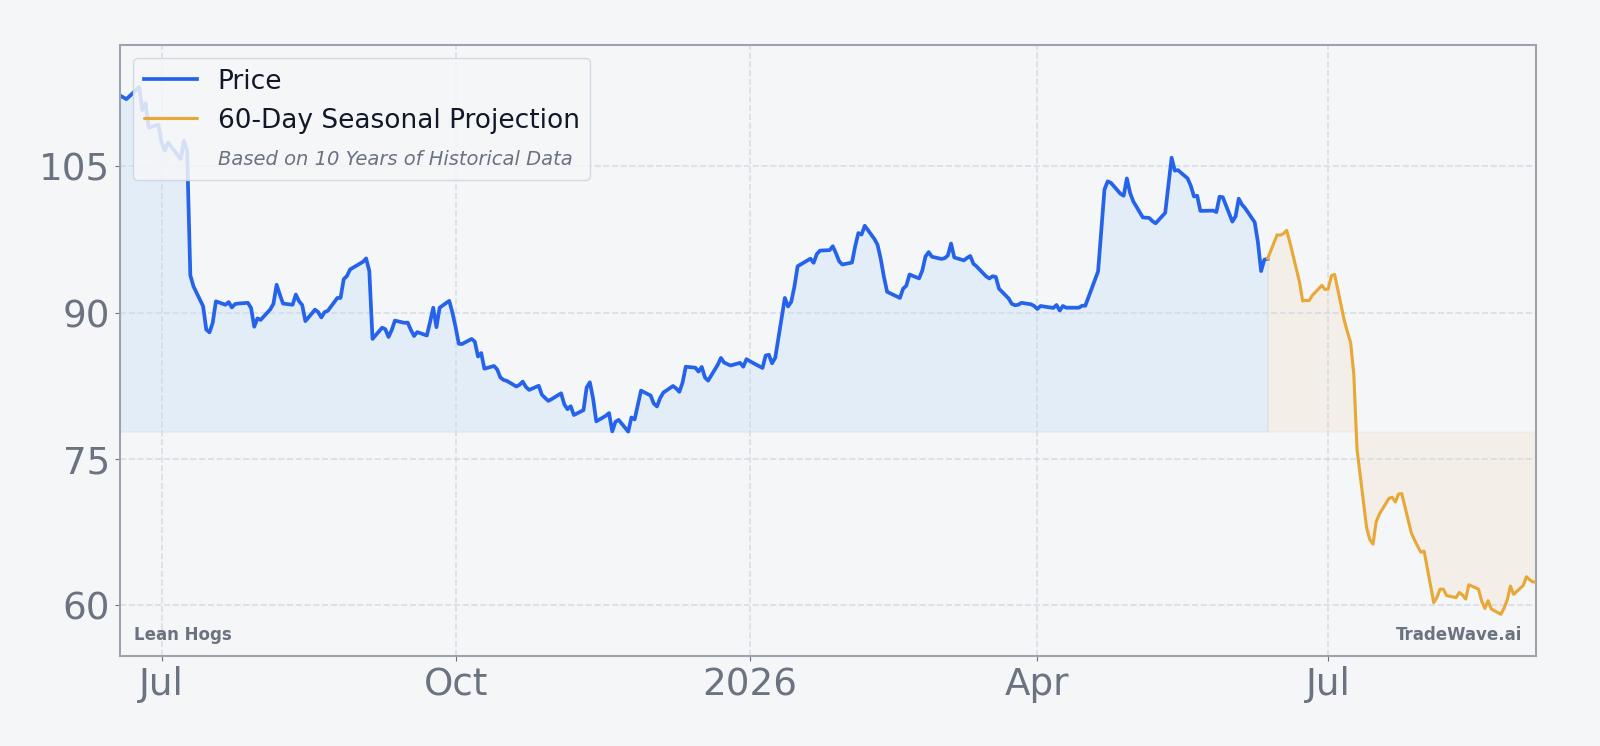
From a macro standpoint, Lean Hogs sits at the intersection of consumer demand, feed costs and broader protein trade flows. Shifts in grain prices can quickly alter producer economics, while changes in export demand or domestic consumption can swing packer margins and futures sentiment. With the contract already backing away from its 52-week high and the historically weak late-June window about to open, traders are watching whether any bounce into the start of the window is sold, as it has been in prior years, or whether a different macro mix finally breaks the 10-year pattern.
What should traders watch in this Lean Hogs seasonal window?
The first watchpoint is price behavior as the window opens on Jun 18. In prior years, rallies early in the window have often faded, so a sustained push back toward the 50-day moving average or above would be an early sign that this year may diverge from the historical script. Conversely, a quick break toward the lower end of the recent range would fit the established late-June seasonal trend.
Second, watch livestock and feed market headlines for clues on supply and demand. Reports of heavier hog weights, softer export bookings or cheaper feed could reinforce the historical downside bias, while evidence of tighter supply or stronger demand could blunt it. Inventory data and slaughter pace numbers will be especially important as they filter into expectations for packer margins and producer hedging.
Finally, monitor intraday volatility and liquidity. The historical pattern shows that maximum adverse moves against shorts have at times been large, even in years that ultimately finished in the green for the seasonal setup. If spreads widen or volume thins out during sharp moves, that would raise execution risk and make risk management more important than the clean 10-for-10 track record might suggest.
Sources
About this seasonal analysis
Seasonal pattern data is sourced from TradeWave.ai, which analyzes historical price behavior across annual calendar windows going back up to 30 years. Read the full data methodology or the book The 100-Year Pattern by Afshin Moshrefi (2026 edition). Past performance of seasonal patterns does not guarantee future results. This article is for informational purposes only and does not constitute investment advice.