Double-Digit Spike Leaves HP Inc. (HPQ) Exposed to Its Midterm June Sell-Off Streak
HP Inc. is heading into a historically weak 13-day June trading window just weeks after a sharp post-earnings surge, raising the stakes for short-term volatility.

What is the seasonal pattern for HP Inc. (HPQ)?
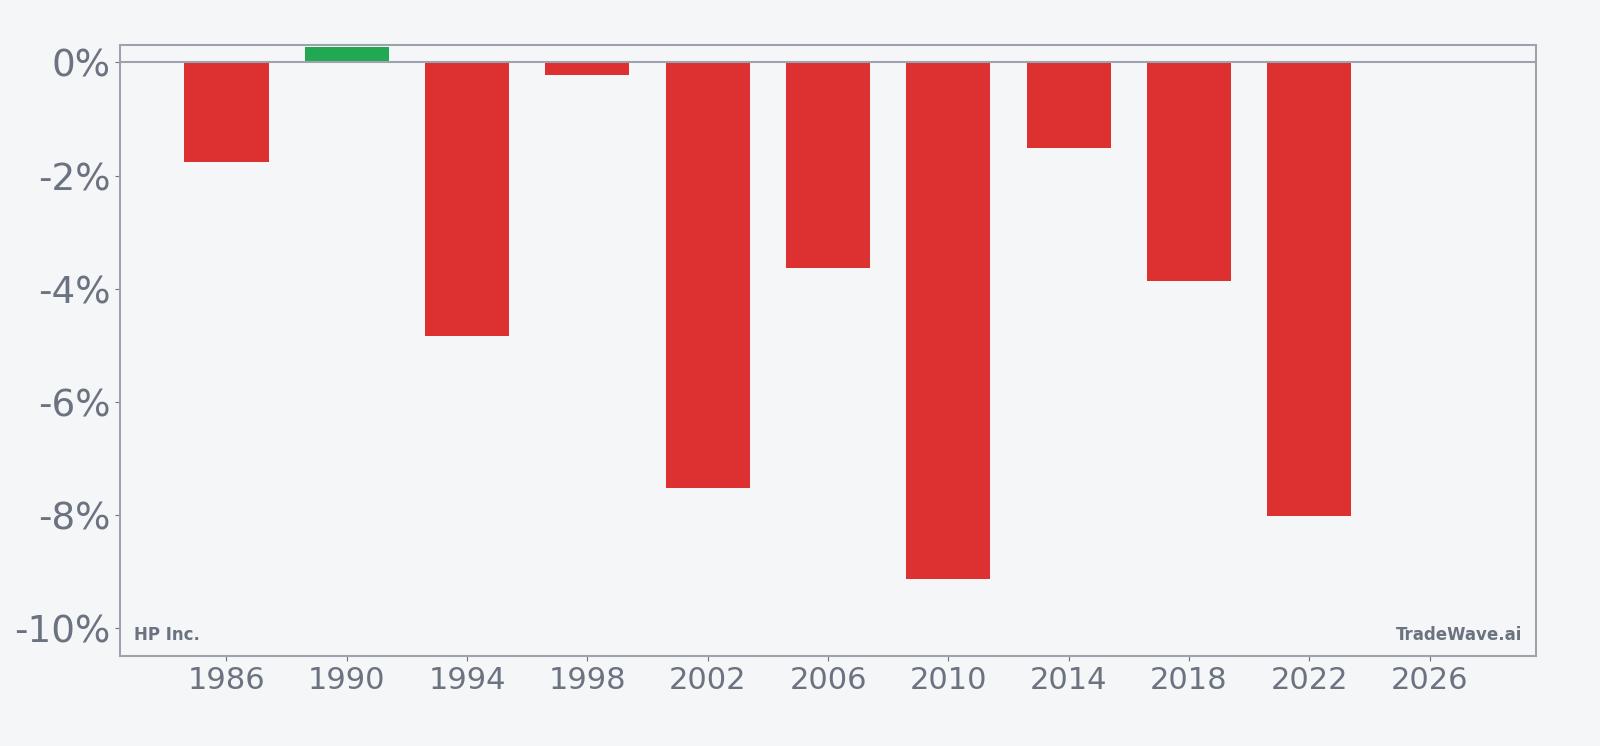
HP Inc. has fallen in 9 of 10 midterm-year June windows during this 13-day stretch, with an average 4.5% gain for the short side in winning years.
- 9 for 10 in this window, with short trades averaging 4.5% gains in winning years across the last 10 midterm election cycles.
- The upcoming 13-day trading window starts Jun 21, 2026 and has historically favored downside moves in HPQ during midterm election years.
- Percent Profitable is 90%, with 9 winning short years and just 1 losing year in the sample.
- Including all years, the average outcome is a 4% decline for HPQ, showing that losses in the lone up year did not erase the pattern.
- Intraperiod swings have been meaningful, with several years showing double-digit peak drawdowns from entry before the window closed.
- The pattern aligns with a short trade direction, suggesting this midterm June stretch has historically been a soft spot for the stock rather than a launchpad.
According to historical data from TradeWave.ai, HP Inc. shows a distinct midterm-year June pattern that diverges from a typical month on the calendar. The next section walks through how that election-cycle seasonality has played out in prior years and what it means for the upcoming 13-day window.
How has HP Inc. (HPQ) traded in this midterm June window?
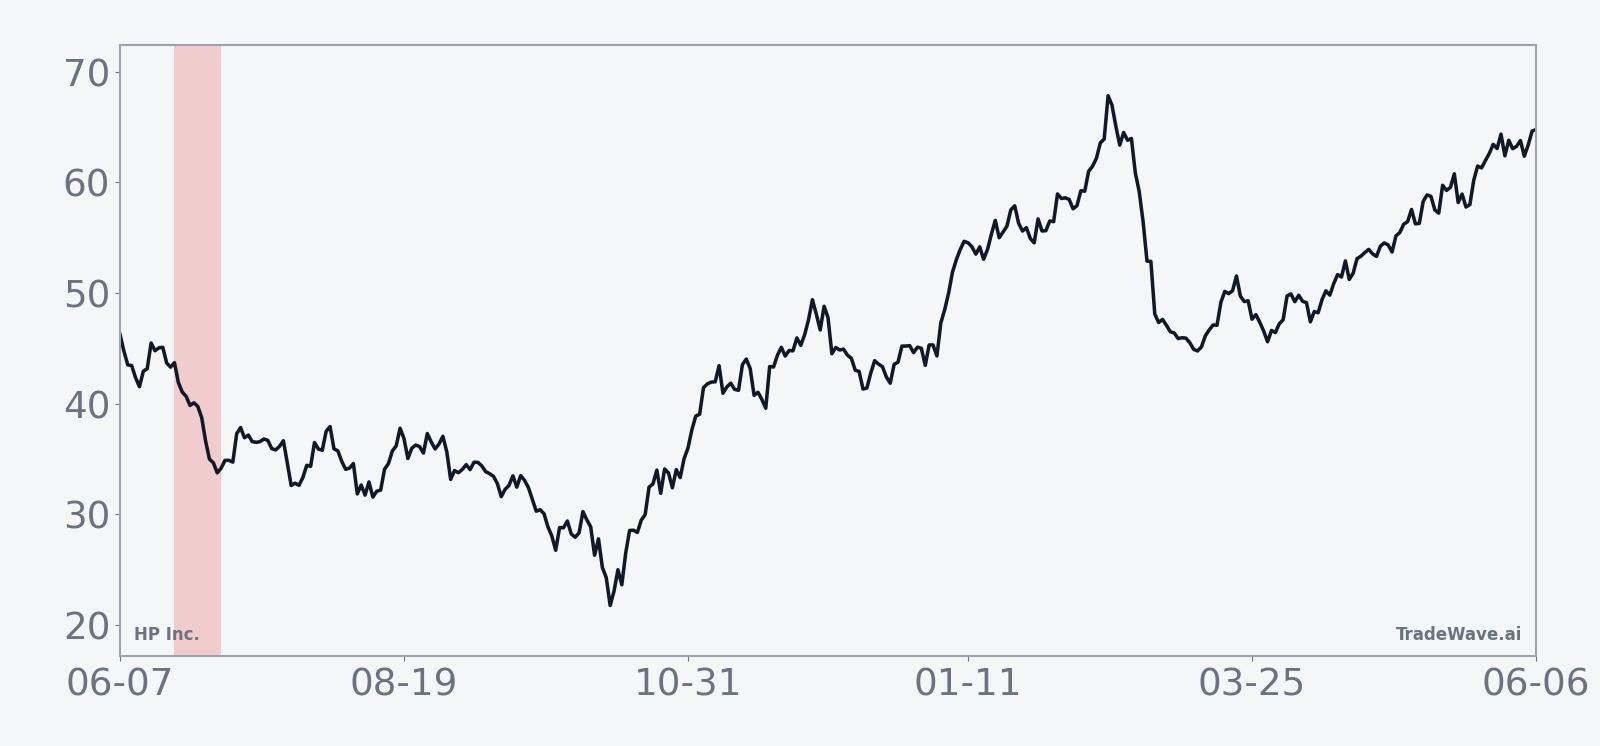
HP Inc. has delivered profitable short-side moves in 9 of the last 10 midterm election years during this late-June 13-day window, with winning years averaging a 4.5% drop in the stock. Today HPQ closed at 25.10, up 1.7% on the session and sitting about 13.3% below its 52-week high of 28.94.[1]
Because this pattern is grouped by the presidential election cycle, it only looks at midterm election years, which often feature policy uncertainty, budget wrangling and choppy risk appetite. HPQ’s window sits in the mid part of the midterm year, just before markets typically start to look ahead to the stronger pre-election phase, so the behavior here can mark a transition from digestion to renewed positioning.
Across the 10 midterm-year samples, the short trade direction has been the clear winner. Nine years, including 1994, 2002, 2010, 2018 and 2022, saw HPQ finish the window lower, while only one year produced a net loss for shorts. The 4% average decline across all years shows that even after accounting for that lone losing year, the pattern has remained meaningfully negative for the stock.
The per-year table shows several standout episodes. In 2010, HPQ dropped 9.13% from entry to exit during the window, with a worst intraperiod drawdown of 10.94% from the starting price. In 2022, the stock fell 8.02% over the window, with the worst point-to-trough move reaching 12.48% below entry, underscoring how quickly downside can build when the pattern is working.
Maximum favorable excursion, which tracks the best move in the trade direction during the window, has often been sizable for shorts. Years like 1998 and 2022 show that even when the final net move is moderate, intraperiod swings can be much larger, giving the pattern room to work before any late bounce. Maximum adverse excursion, the worst move against the short, has generally been smaller than the favorable side in winning years, but episodes such as 2002 and 2010 remind traders that double-digit squeezes against entry have occurred.
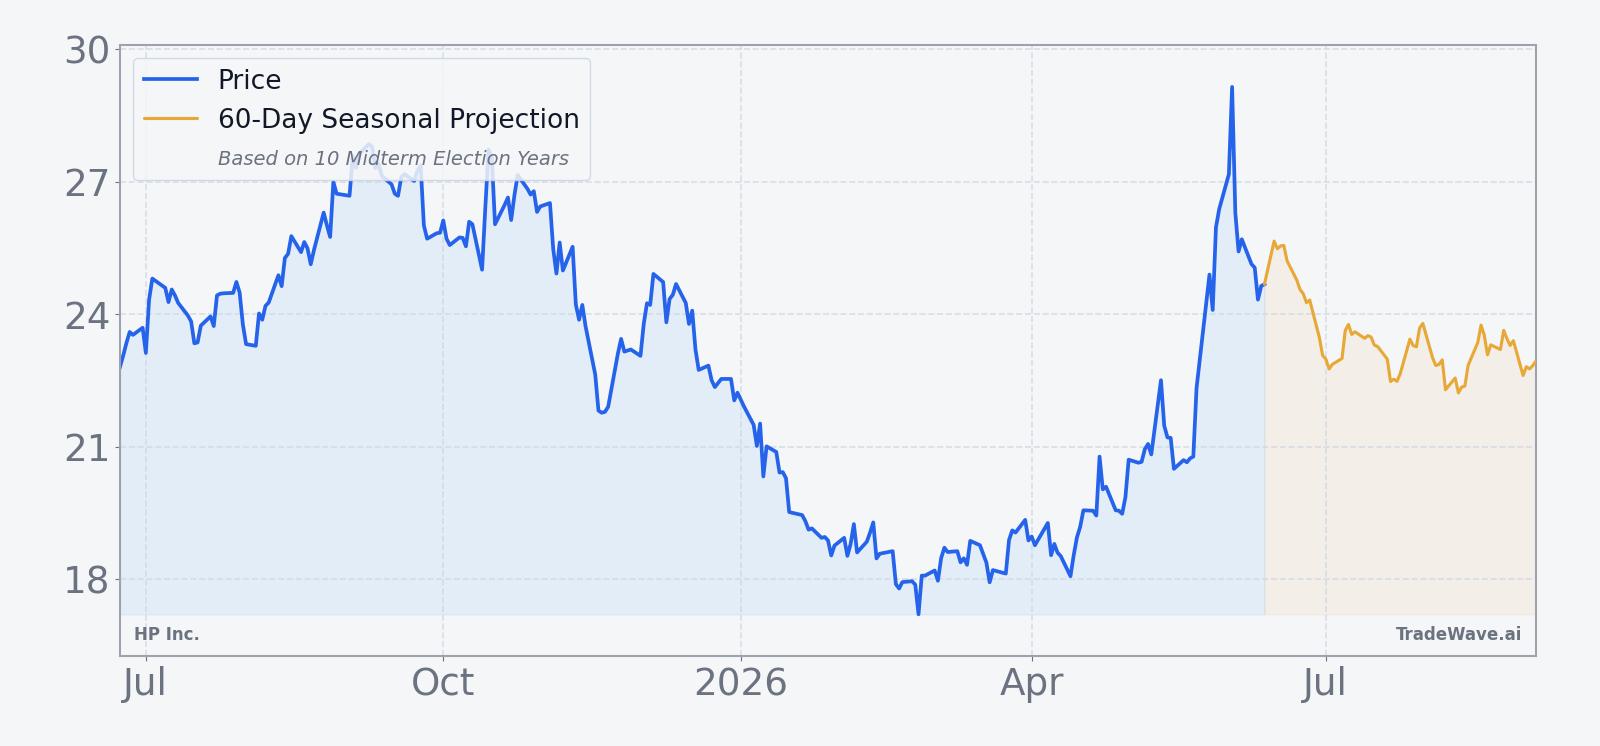
The historical seasonal average trend line slopes lower through most of the 13-day span, with the bulk of the decline front-loaded in the first half of the window. Later days tend to flatten out, suggesting that when the pattern has worked, much of the short-side payoff has come early rather than in a slow grind lower.
The combined net, peak favorable and worst adverse moves by year show how consistently this window has leaned bearish for HPQ.
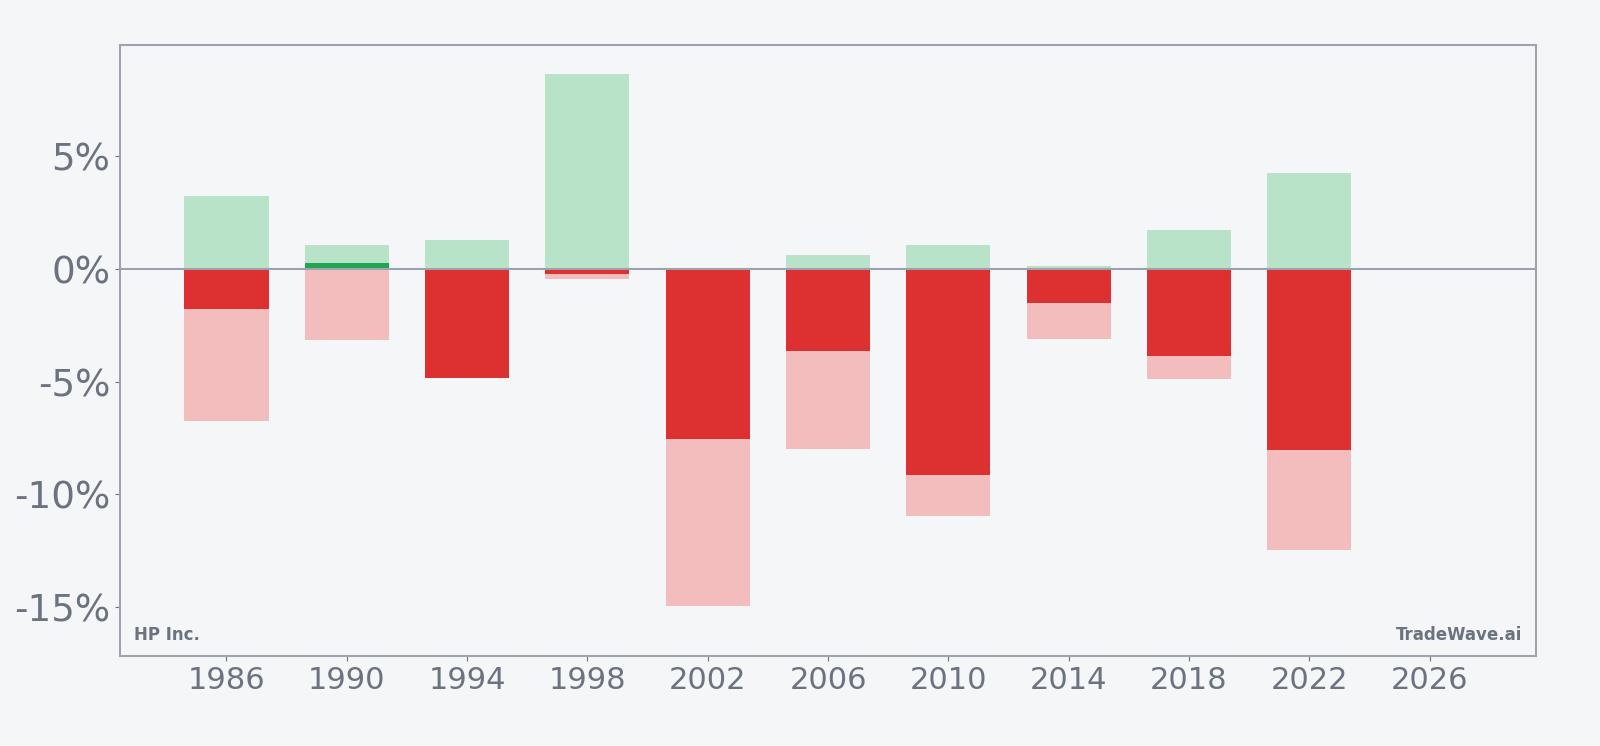
Viewed together, the net, maximum favorable and maximum adverse bars show a pattern that has rewarded shorts more often than not, but with enough volatility to punish late entries or poor risk control. Nine for ten is a strong record, yet the size of some adverse spikes means this is a window where timing and sizing have mattered as much as direction.
History does not guarantee future results; adverse excursions (MAE) can be large even in winning windows.
Why does HP Inc. (HPQ) follow this seasonal pattern?
One likely driver is the way HP’s fiscal calendar and PC demand cycles intersect with the midterm election year. Late June often falls between major product refreshes and ahead of back-to-school orders, a softer spot for hardware demand. At the same time, institutional investors may rebalance tech exposure around midyear in response to policy debates and budget headlines, which can leave stocks like HPQ vulnerable to short-term profit-taking in this specific slice of the calendar.
What is driving HP Inc. (HPQ) today?
HPQ added 1.7% on Monday to close at 25.10, trading in a wide intraday band between 24.02 and 25.31 as roughly 7.9 million shares changed hands, below its 20-day average volume of about 24.3 million.[1] The stock has climbed 24.5% over the past month, helped by a strong reaction to its late-May earnings report, and now sits comfortably above its 50-day moving average near 21.44.[1][2]
On May 27, 2026, CNBC reported that HP shares jumped by double digits after the company delivered an earnings and revenue beat, with investors rewarding both the headline numbers and management’s tone on demand.[2] That surge reset expectations around the PC and printing giant, shifting the conversation from cost-cutting and sluggish hardware cycles to whether the company can sustain margin and cash-flow improvements into the back half of the year.
In the weeks since that report, HPQ has consolidated those gains rather than giving them back, a constructive sign for bulls who see the stock as a value play in large-cap tech hardware. The move has also pulled the shares further away from their 52-week low near 16.60, reinforcing the sense that the worst of the last downcycle is behind the company for now.[1]
The chart below situates the latest move against HPQ’s past year of trading and a 60-day seasonal projection.
What should traders watch as this HPQ seasonal window approaches?
First, the calendar. The 13-day midterm-year June window begins on Jun 21, 2026, so any shift from the current bullish tone into heavier selling or failed rallies during that stretch would be consistent with the historical pattern. If HPQ instead grinds higher through the window without meaningful downside, that would mark a rare break from the past decade of behavior.
Second, price levels. The 52-week high near 28.94 is the obvious upside reference, while the rising 50-day moving average around 21.44 is the key support line that has underpinned the recent advance.[1] A test of that moving average during the window would fit the historical tendency toward short-term weakness, whereas a clean hold above it would signal that buyers remain in control despite the seasonal headwind.
Third, catalysts. With the latest earnings report already out and no near-term company-specific events flagged, macro headlines and sector flows are likely to drive day-to-day moves.[2] Any signs of slowing PC demand, cautious enterprise spending or renewed risk-off sentiment in broader tech could amplify the downside bias that has often shown up in this midterm June stretch.
Finally, volatility. The historical record shows that when HPQ has moved during this window, it has often moved quickly, with several years posting double-digit peak drawdowns from entry before the 13 days were over. Traders watching this HP Inc. trading window will be looking for whether early weakness appears in the first week of the pattern, in line with the average seasonal trend, or whether the stock shrugs off the historical seasonality and extends its post-earnings run instead.
Sources
- EODHD, HPQ daily quote and 52-week statistics (accessed Jun 15, 2026).
- CNBC, "HP shares jump double-digits on earnings and revenue beat" (May 27, 2026).
About this seasonal analysis
Seasonal pattern data is sourced from TradeWave.ai, which analyzes historical price behavior across annual calendar windows going back up to 30 years. Read the full data methodology or the book The 100-Year Pattern by Afshin Moshrefi (2026 edition). Past performance of seasonal patterns does not guarantee future results. This article is for informational purposes only and does not constitute investment advice.