Lean Hogs (HE) Has Dropped in 10 of 10 Midterm Summers, Averaging 18.91% Short-Side Profit
Lean Hogs futures are drifting below their spring highs just as a midterm-year summer window that has never produced a gain comes into view.
What is the seasonal pattern for Lean Hogs (HE)?
Lean Hogs has fallen in 10 of 10 midterm-year summer windows starting around Jun 26, with an average 18.91% gain for short positions in winning years.
- 10 for 10 in this window, with short trades averaging 18.91% profit in winning years across the last 10 midterm election cycles.
- The 60-day Lean Hogs trading window begins on Jun 26 and has historically favored downside moves in prices.
- Percent Profitable is 100%, with 10 winners and 0 losers for the short-side seasonal pattern.
- Average annualized return for the pattern is 18.27%, with a cumulative 435% gain for the short direction across all sampled years.
- Intraperiod swings have been large, with best-case rallies for shorts often paired with deep temporary drawdowns before the move completes.
- The pattern aligns with midterm election years, when policy uncertainty and demand shifts have often coincided with weaker summer hog prices.
According to historical data from TradeWave.ai, this midterm-year summer stretch in Lean Hogs behaves very differently from an average month on the calendar, and the next iteration is about to start.
How has Lean Hogs (HE) traded in past midterm-year summer windows?
Lean Hogs has declined in every one of the last 10 midterm election years during the 60-day window that starts on Jun 26, with short positions averaging 18.91% profit. That is a rare clean sweep for a commodity contract and turns a quiet part of the calendar into a focal point for livestock traders. The pattern is defined on the short side, so weaker futures prices are the “winning” outcome in this historical seasonality.
Grouping the data by the presidential election cycle matters here because this window only looks at the last 10 midterm election years, not every single year on record. Midterm years often bring a mix of policy uncertainty, shifting farm support expectations and trade rhetoric that can hit protein demand and producer sentiment at the same time, which is exactly the backdrop this Lean Hogs seasonal trend is capturing.
This seasonal window begins on Jun 26 and spans 60 trading days. Historically, during this period, Lean Hogs has shown a strong bearish tendency that has rewarded traders positioned for lower prices rather than summer rallies. The trade direction is explicitly short, so each of the 10 “wins” reflects a net decline in futures prices from entry to exit.
The win–loss record is stark. Percent Profitable is 100%, with 10 winners and 0 losers, which means there has not been a single midterm-year summer in this sample where Lean Hogs finished the window higher than it started. Average profit for those winning short trades is 18.91%, and because there are no losing years in the sample, the all-years average lines up almost exactly with that figure.
Individual years show how that plays out. In 1998, Lean Hogs dropped 31.07% over the window, while 2014 and 2018 saw declines of 28.03% and 34.57% respectively, all favorable outcomes for the short-side pattern. Even the “milder” years like 1994 and 2010 still delivered net returns of roughly 3% for shorts, which is small by this window’s standards but still on the profitable side of the ledger.
Intraperiod swings have been meaningful. Maximum favorable moves for shorts, the best point-to-peak declines within the window, have reached double digits in several years, including 10.14% in 2002 and 11.22% in 2022. At the same time, maximum adverse moves, the worst drawdowns against the short before the trade worked, have also been large, with years like 1998 and 2018 seeing temporary rallies of more than 30% from the entry level before prices ultimately rolled over.
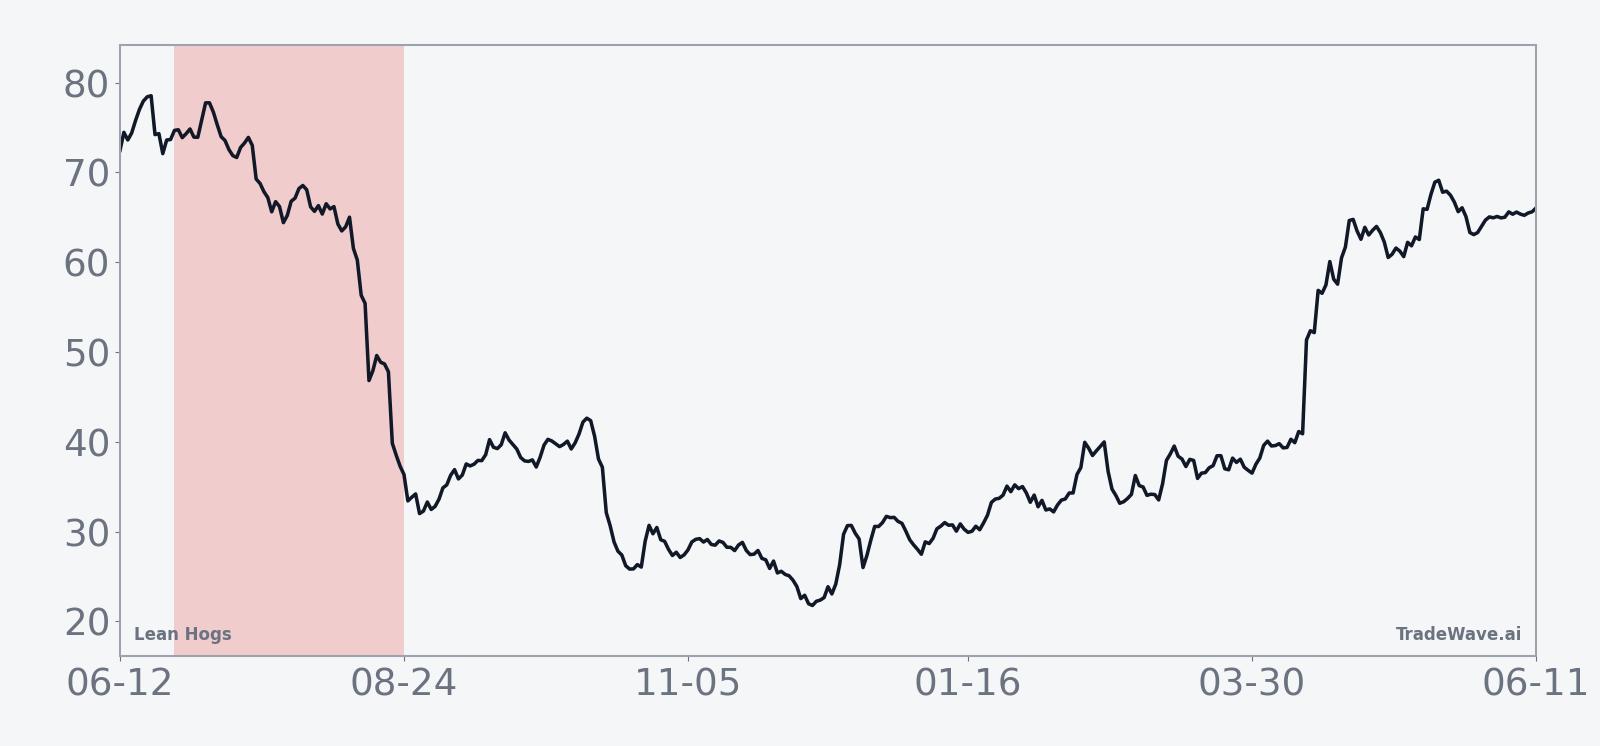
The historical seasonal trend chart for this window shows that the typical path is not a straight line. On average, Lean Hogs tends to chop early in the window, with some years seeing brief squeezes higher, before the bulk of the downside for shorts accrues in the back half of the 60 days. That late-window acceleration is consistent with the largest winning years, where prices broke sharply once the initial noise cleared.
The cumulative return profile across the last 10 midterm election years reinforces how persistent this pattern has been. When you stack the results year after year, the short-side seasonal strategy has produced a 435% cumulative gain, with relatively few flat stretches and no multi-year giveback of prior profits. Add it up and you get a window that has not just worked often, but has compounded meaningfully over multiple election cycles.
Year-by-year bars with intraperiod swings show how often shorts have faced sharp rallies before the seasonal decline took hold.
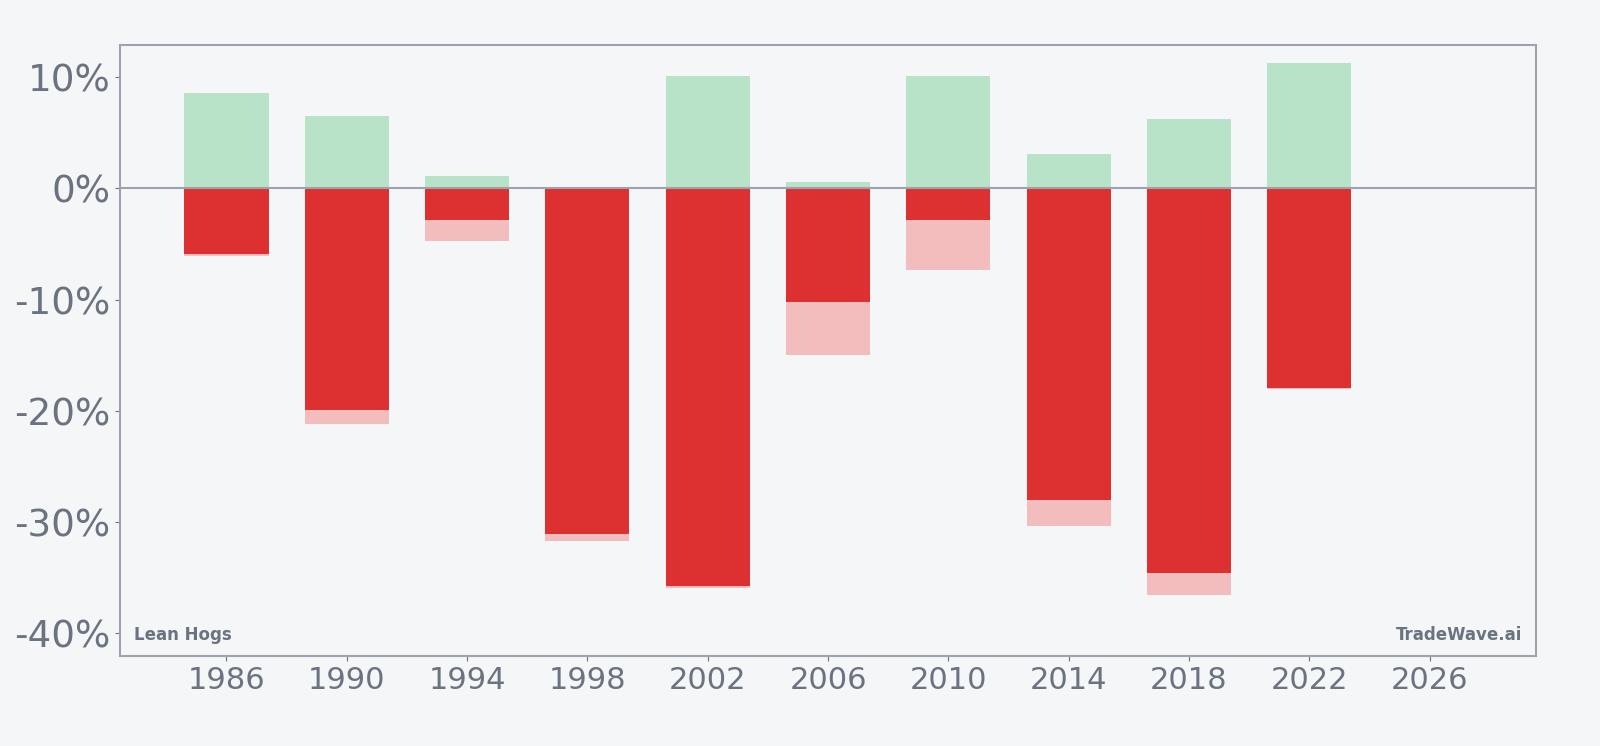
History does not guarantee future results, and the worst intraperiod drawdowns in this window have been large even in years that ultimately finished as winners for the short side.
Why does Lean Hogs (HE) follow this seasonal pattern?
One likely driver is commodity supply and demand seasonality, as summer often brings heavier hog marketings and shifting consumer demand after the early grilling season peak. Analysts have also pointed to midterm-year policy uncertainty around trade, biofuel mandates and farm support programs, which can weigh on producer sentiment and futures prices in this part of the cycle. The combination of physical supply pressure and a noisier policy backdrop may help explain why this specific midterm-year summer window has leaned so consistently in favor of lower Lean Hogs prices.
What is driving Lean Hogs (HE) today?
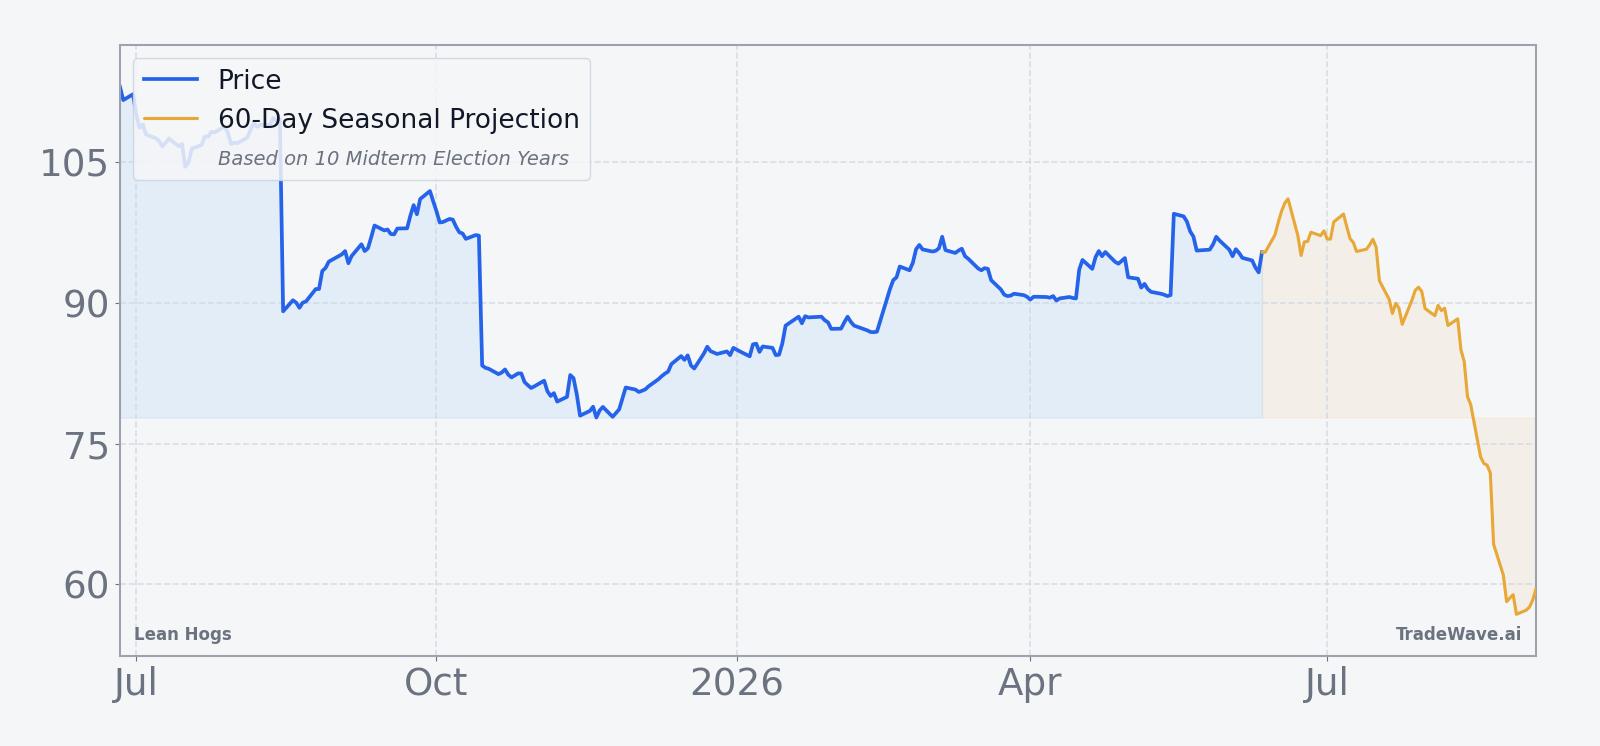
Lean Hogs futures are trading below their recent highs, with the most recent settlement at 95.725 compared with a 52-week peak of 113.7 and a low of 77.35. That leaves the contract about 15.8% under its 52-week high and modestly above its 50-day moving average of 93.725, after a one-month slide of 3.06% that has cooled the strong gains seen earlier in the year. Volumes over the past 20 sessions have averaged 9,496 contracts, a relatively light tape that suggests many traders are still on the sidelines ahead of the midterm-year summer window.
The chart below shows how that pullback fits into the past year of trading, along with a 60-day seasonal projection overlay.
What should traders watch as this Lean Hogs seasonal window approaches?
With the 60-day midterm-year summer window set to begin on Jun 26, the key question is whether Lean Hogs follows its historical pattern of weakening into late summer or breaks the streak. Traders will be watching how prices behave around the 95 to 100 band, which has acted as a pivot area in recent months, and whether any rallies toward the 52-week high near 113.7 are quickly sold or gain traction. A familiar pattern would see early choppiness or even a brief squeeze higher, followed by heavier selling pressure later in the window that pushes prices back toward the lower end of the past year’s range.
Fundamentally, upcoming hog inventory data, export demand updates and any fresh headlines on trade policy or animal disease could all act as catalysts inside this seasonal window. If those catalysts line up with the historical pattern, traders may see another year where short positions benefit from a late-summer slide in Lean Hogs. A clear break from history would look like sustained strength through July and August, with prices holding above the 50-day moving average and pressing closer to the 52-week high without the kind of deep intraperiod drawdowns that have defined prior midterm-year summers.
Sources
About this seasonal analysis
Seasonal pattern data is sourced from TradeWave.ai, which analyzes historical price behavior across annual calendar windows going back up to 30 years. Read the full data methodology or the book The 100-Year Pattern by Afshin Moshrefi (2026 edition). Past performance of seasonal patterns does not guarantee future results. This article is for informational purposes only and does not constitute investment advice.