RBOB Gasoline (RB) Has Fallen 10 of 10 Years in This Late-August Window for Shorts Averaging 9.04%
RBOB Gasoline is up more than 85% this year, but a late-August seasonal window that has seen prices fall in every year of the past decade is approaching just as supply risks and crack spreads keep volatility high.
Price as of Aug 13, 2026: $2.87 (last close).

What is the seasonal pattern for RBOB Gasoline (RB)?
RBOB Gasoline has fallen in 10 of 10 years during the Aug 27 to Sep 5 window, with an average gain of 9.04% in winning years for short positions.
- 10 for 10 in this window: RBOB has closed lower in every Aug 27 to Sep 5 stretch over the past decade, favoring shorts.
- Percent Profitable is 100%, with 10 winners and 0 losers for the short-side pattern across the 10-year lookback.
- Average profit for winning short trades is 9.04%, compounding to a 135% cumulative return when the window is stacked year after year.
- The TradeWave Ratio of 2.34 signals that price typically travels meaningfully in the trade direction within the 10-day window, not just at the close.
- A Sharpe ratio of 1.9 for this slice of the calendar points to unusually strong risk-adjusted returns for the short pattern.
- Intraperiod swings have still been sizable, with some years showing double-digit adverse moves before the window ultimately finished lower.
According to historical data from TradeWave.ai, this late-August stretch in RBOB has behaved very differently from an average summer week, and the next iteration is now less than two weeks away.
How has RBOB Gasoline (RB) traded in the late-August window?
RBOB Gasoline has dropped in 10 of the past 10 years during the Aug 27 to Sep 5 window, with short positions averaging a 9.04% gain and no losing years across the sample. That pattern is set to kick in again on Aug 27, with front-month futures recently around $3.17 per gallon and the continuous contract near $2.87, more than 85% above where it started 2026.[1][3] For a contract that anchors U.S. pump prices and inflation expectations, a window this consistent on the downside is hard for energy desks to ignore.
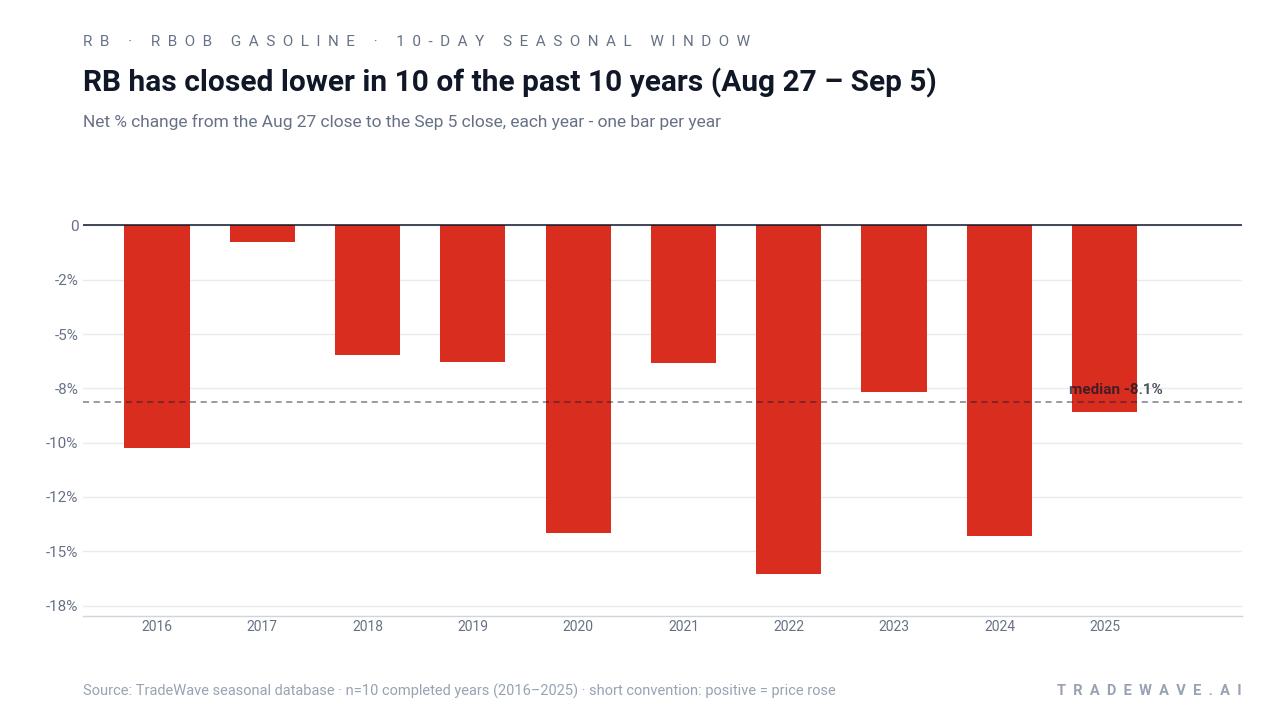
Trade direction for this pattern is explicitly short, so years where RBOB fell sharply are the “good” outcomes. The strongest year in the sample was 2022, when a short held from Aug 27 to Sep 5 would have captured a 16.04% decline, while the softest year was 2017, which still delivered a 0.77% gain for shorts over the 10 days. Even the more modest years such as 2018 and 2019 saw net drops of 5.97% and 6.3% respectively, reinforcing the bearish seasonal tilt.
The annualized return of 8.95% and cumulative gain of 135% come from repeatedly applying this same 10-day short window over the past decade. In other words, stacking just this late-August slice has historically produced more than a doubling of capital, even though it represents less than 3% of the trading year. A Sharpe ratio of 1.9 for such a short horizon is unusual in commodity space, where weather, refinery outages and geopolitics often swamp calendar effects.
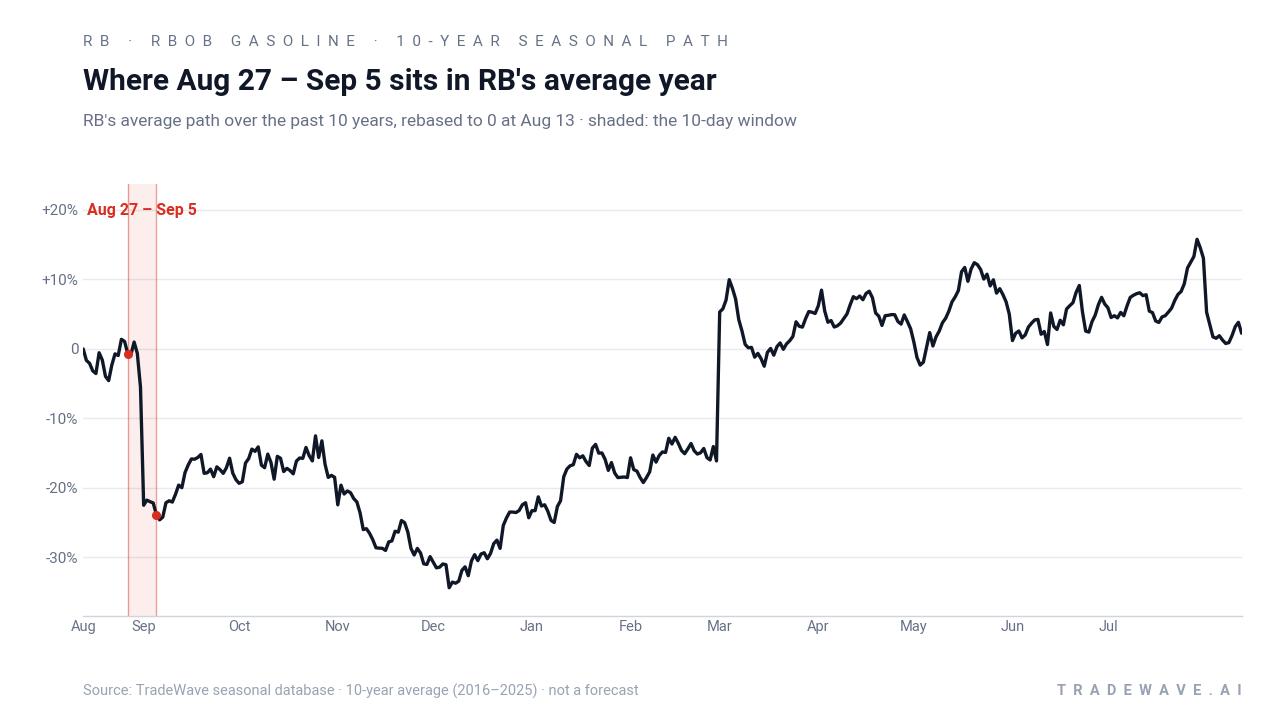
Year-by-year ranges highlight how far RBOB has tended to swing inside the window before settling lower.
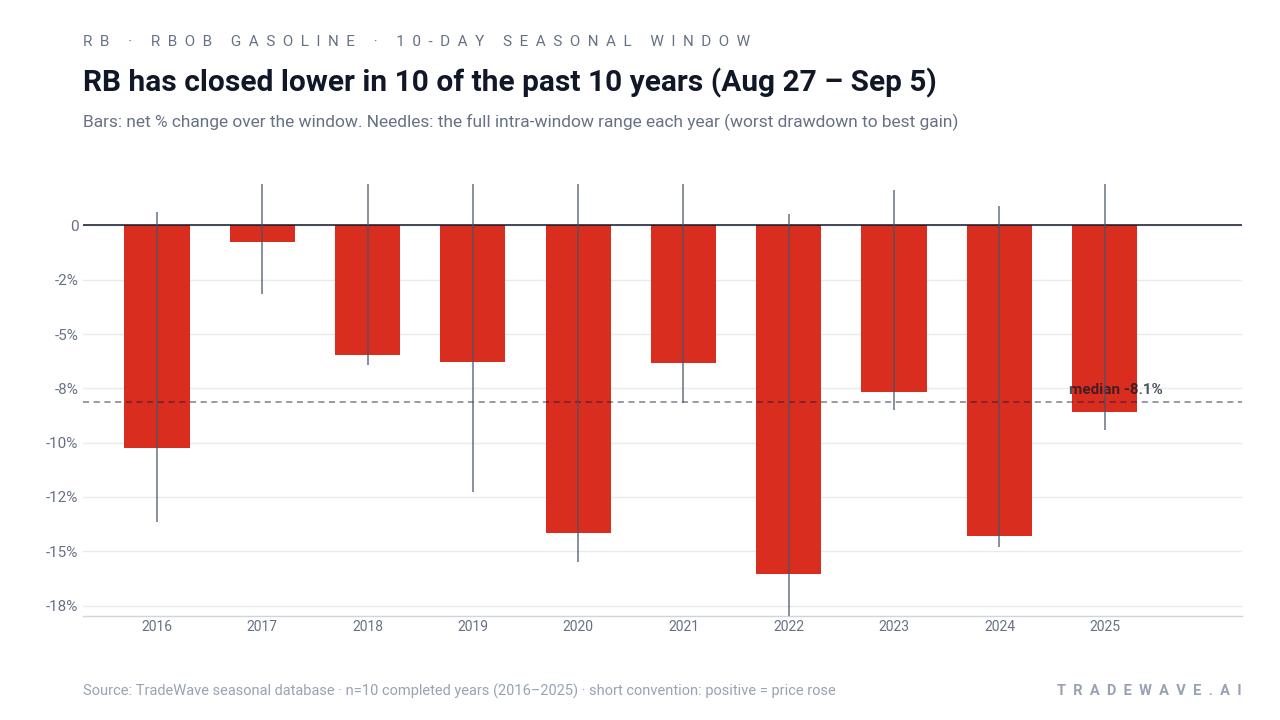
The bar-and-needle profile shows that maximum favorable moves for shorts have often been in the high single to mid-teens, but maximum adverse moves have also reached into double digits in several years. In 2020, for example, the short pattern finished up 14.15%, yet the worst intraperiod move against the position was a 15.52% rally before prices rolled back over. That mix of large maximum favorable excursion and sizable maximum adverse excursion is what the 2.34 TradeWave Ratio is capturing: this is a window where RBOB tends to move a lot in both directions, even though it has ultimately finished lower every time in the sample.
History does not guarantee future results; adverse excursions (MAE) can be large even in winning windows.
Why does RBOB Gasoline (RB) follow this seasonal pattern?
One likely driver is the transition from peak U.S. summer driving demand toward shoulder season, when refiners begin shifting yields and gasoline cracks can compress. Analysts have also pointed to refinery maintenance schedules and inventory rebuilding after the driving season, which can ease spot tightness and pressure prices. This late-August to early-September window may therefore reflect a recurring handoff from demand-led strength to supply-led normalization in the refined products complex.
What is driving RBOB Gasoline (RB) today?
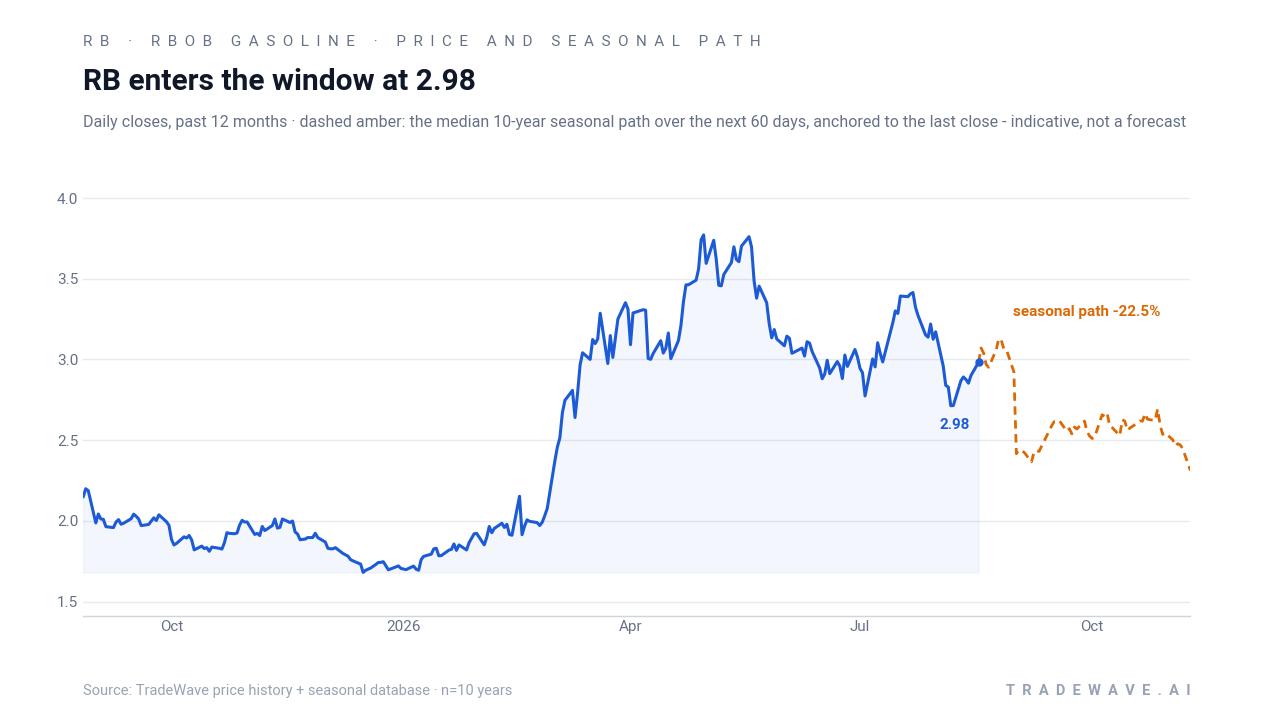
RBOB’s continuous contract ended the prior session at about $2.87 per gallon, down 0.17% on the day, even as it holds an 85.21% gain year to date.[1][2] The front-month September contract is richer at roughly $3.17, with the curve stepping down through late 2026 and into early 2027, a structure consistent with tight near-term supply and softer expectations further out.[1]
That tightness has been a recurring theme in 2026. In March, Iranian attacks on LNG infrastructure in Qatar helped push RBOB futures toward $3.13 as traders priced in broader energy supply risk and a higher floor for fuel costs.[6][7] By June, CME commentary was flagging widening gasoline crack spreads, with margins moving from roughly $27 into the high $30s, a sign that refiners were being paid more for turning crude into gasoline even when crude itself was not surging.[4]
Sector analysts have tied part of this strength to refined products seasonality and refinery throughput decisions heading into the 2026 driving season, which kept gasoline prices elevated even before the latest geopolitical shocks.[11] With the curve still backwardated and front-month prices well above deferred contracts, the market is signaling that near-term barrels remain scarce relative to demand, a backdrop that can amplify any seasonal soft spots once demand begins to roll over.
The chart below situates the latest move in its recent multi-month context and overlays the median seasonal path.
Liquidity has been solid into this move. CME data for the RBU6 contract recently showed volume of 4,167 lots, a healthy clip for a single session in a shoulder month.[3] While that print alone does not qualify as a major volume shock, it underscores that speculative and hedging interest remains active as traders weigh geopolitical risk, refinery margins and the looming seasonal window.
For refiners, retailers and macro desks, the tension is clear. On one side sits a powerful year-to-date rally built on tight supply, strong crack spreads and geopolitical risk. On the other sits a 10-for-10 late-August seasonal pattern that has historically rewarded short exposure, often with double-digit swings inside just 10 days. How RBOB behaves as Aug 27 approaches will tell traders whether 2026 is tracking another typical post-driving-season fade or breaking the pattern.
What should traders watch as the late-August window approaches?
First, watch front-month RBOB relative to the rest of the curve. If backwardation persists or deepens into the window, it would signal that physical tightness is still in control, which in past years has not prevented prices from rolling over but has sometimes made intraperiod rallies sharper.[1][4] A flattening curve or emerging contango would instead hint that supply is catching up, which would align more cleanly with the historical seasonal drift lower.
Second, keep an eye on crack spreads and refinery commentary. If margins stay in the high $30s or push higher, refiners have every incentive to keep gasoline output elevated, which could accelerate inventory builds once demand eases after Labor Day.[4][11] Any sign of unplanned refinery outages or hurricane-related disruptions along the Gulf Coast would cut the other way, potentially muting or delaying the usual late-August softness.
Third, monitor volumes and open interest around the RBU6 and RBV6 contracts. A pickup in volume similar to or above the 4,167-lot print seen on CME’s overview page would suggest that more players are leaning into the move rather than fading it.[3] Rising open interest into price weakness would be consistent with fresh short positioning, while a drop in open interest could indicate profit-taking or hedges being lifted instead of new bearish bets.
Finally, the seasonal pattern itself offers a simple scoreboard. If RBOB enters the Aug 27 to Sep 5 window near current levels and then starts to trade lower with intraday rallies that fail quickly, behavior would be tracking the 10-year historical script. A decisive break higher through the window, especially if accompanied by stronger backwardation and fresh supply shocks, would be a clear departure from the pattern and a sign that 2026’s gasoline story is being written by fundamentals rather than the calendar.
Sources
- MarketWatch: RBOB Gasoline Continuous Contract Overview (Aug 12, 2026).
- MarketWatch: RBOB Gasoline (NYM $/gal) Front Month Advanced Charts (Aug 11, 2026).
- CME Group: RBOB Gasoline Futures Overview (Aug 12, 2026).
About this seasonal analysis
Seasonal pattern data is sourced from TradeWave.ai, which analyzes historical price behavior across annual calendar windows going back up to 30 years. Read the full data methodology or the book The 100-Year Pattern by Afshin Moshrefi (2026 edition). Past performance of seasonal patterns does not guarantee future results. This article is for informational purposes only and does not constitute investment advice.