Natural Gas (CME) (NG) Has Dropped in 8 of 8 Late-August Midterm Windows for Shorts Averaging 5.07%
Natural Gas (CME) is hovering near $2.76 as it heads toward a late-August window that has delivered eight straight midterm-year declines, a seasonal pattern traders cannot ignore.
Price as of Aug 12, 2026: $2.76 (intraday).
What is the seasonal pattern for Natural Gas (CME) (NG)?
Natural Gas (CME) has fallen in 8 of 8 midterm-year late-August windows from Aug 19 to Sep 3, with an average gain of 5.07% in winning short trades.
- 8 for 8 in this window, with short trades averaging 5.07% profit across the last eight midterm election years.
- Seasonal bias is bearish for price from Aug 19 to Sep 3, aligning with a short trade direction in Natural Gas (CME).
- Percent Profitable is 100%, with 8 winners and 0 losers across the historical sample.
- Average winner profit of 5.07% compounds to a 48% cumulative gain when the window is repeated over the eight midterm years.
- Intraperiod swings have been meaningful, with best-case rallies and worst-case drawdowns both showing that volatility inside the window can be sharp.
- The TradeWave Ratio of 1.71 and Sharpe ratio of 1.49 point to a historically efficient short window relative to its risk profile.
According to historical data from TradeWave.ai, this late-August slice of the calendar has behaved very differently from an average month for Natural Gas (CME). The next section walks through how that pattern has played out across the last eight midterm election years without making any prediction about what comes next.
How has Natural Gas (CME) (NG) traded in the late-August midterm-year window?
Natural Gas (CME) has closed lower in every single Aug 19 to Sep 3 window across the last eight midterm election years, with short trades averaging 5.07% profit and a 100% win rate. The upcoming 16-day window begins on Aug 19, with front-month futures last changing hands around $2.762 and sitting in the lower end of their recent range after a roughly 5.37% slide over the past month. That combination of a soft tape and a historically bearish NG seasonal trend gives late-August positioning extra weight for energy desks this year.
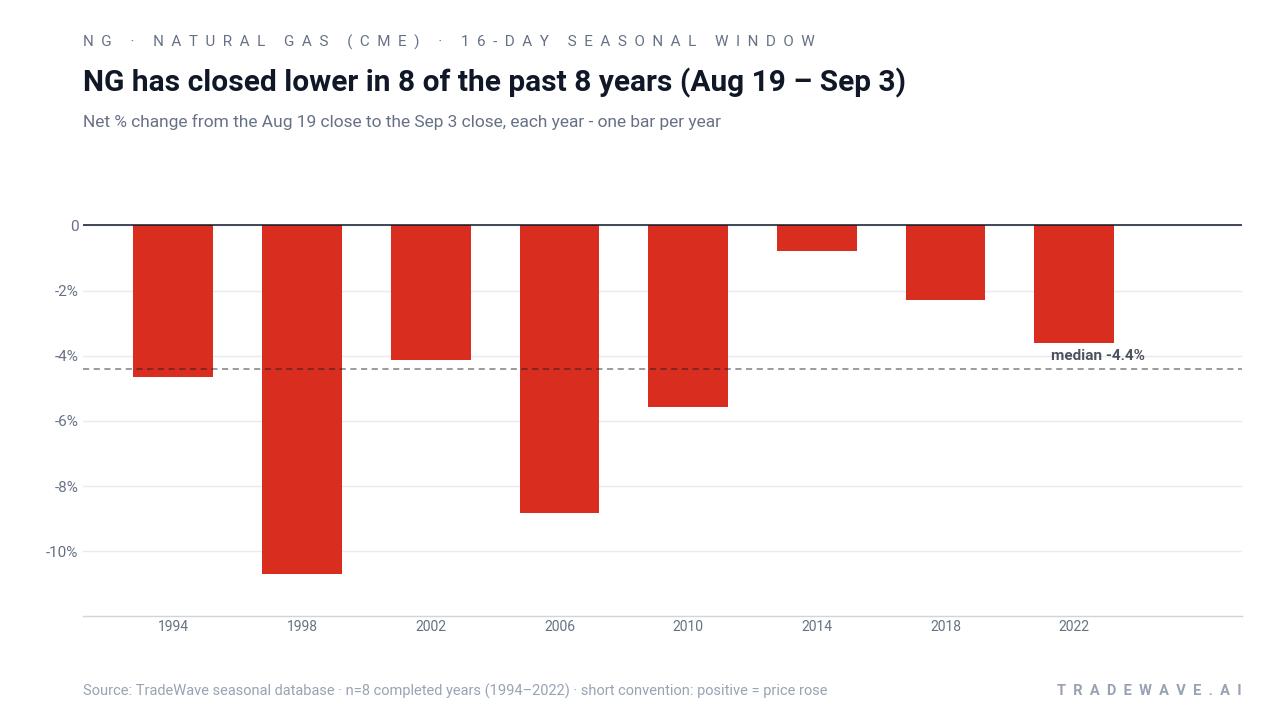
The pattern is grouped by the presidential election cycle, focusing only on the last eight midterm election years rather than consecutive calendar years. That matters because midterm years often feature shifting policy expectations, budget debates and regulatory noise that can distort energy demand expectations and hedging behavior in ways that do not show up in a simple year-by-year average.
Across those eight midterm-year samples from 1994 through 2022, every Aug 19 to Sep 3 window delivered a negative net return for price, which is a positive outcome for the short trade direction. Individual years ranged from a modest 0.77% price drop in 2014 to a 10.69% slide in 1998, but the direction was consistent. Add it up and repeating this 16-day Natural Gas (CME) trading window across the sample compounds to a 48% cumulative gain for the short side.
The per-year path shows that these are not quiet drifts lower. In 2006, for example, the contract’s best intraperiod rally reached 13.83% above the entry before finishing the window down 8.83%, while the worst drawdown from entry hit 13.8%. In 2002, the best point-to-peak move was an 11.51% rally even though the final result was a 4.13% price decline. That mix of strong intraday or intra-window rallies and lower closes is exactly what the short-focused NG seasonal pattern has captured.
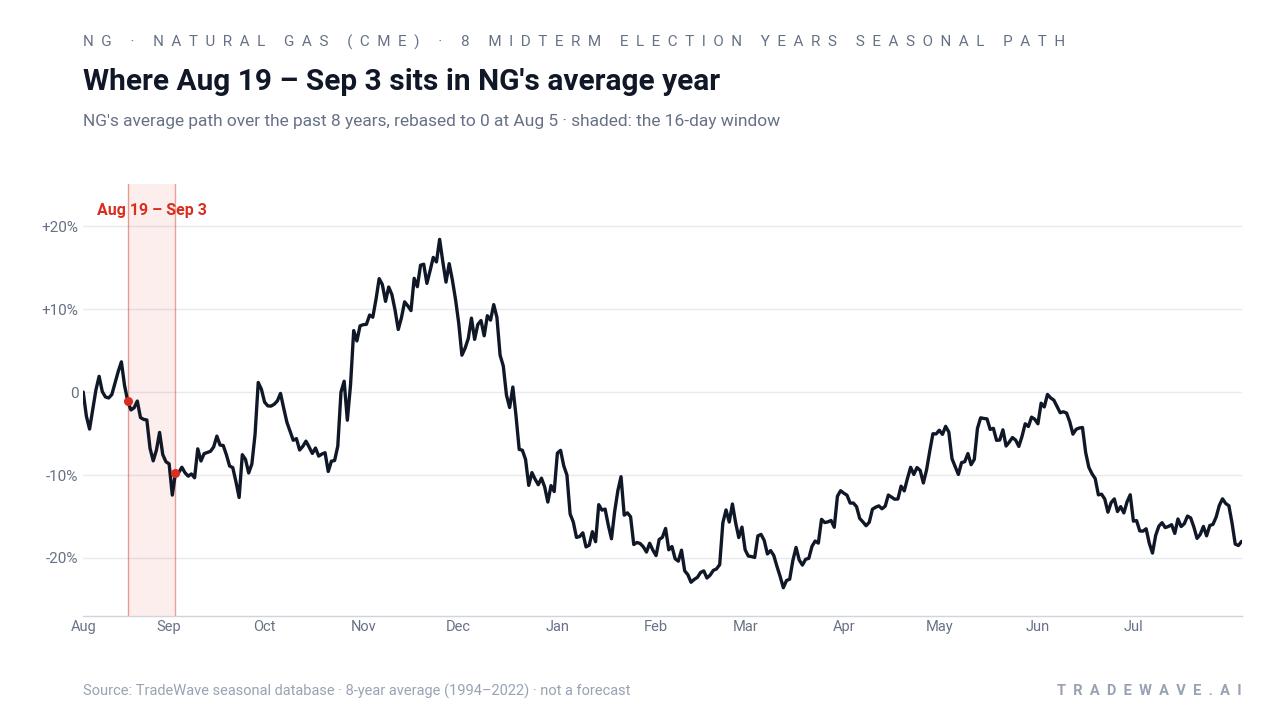
A second view stacks net results with the full intraperiod range, highlighting how far price has swung inside this window before settling lower.
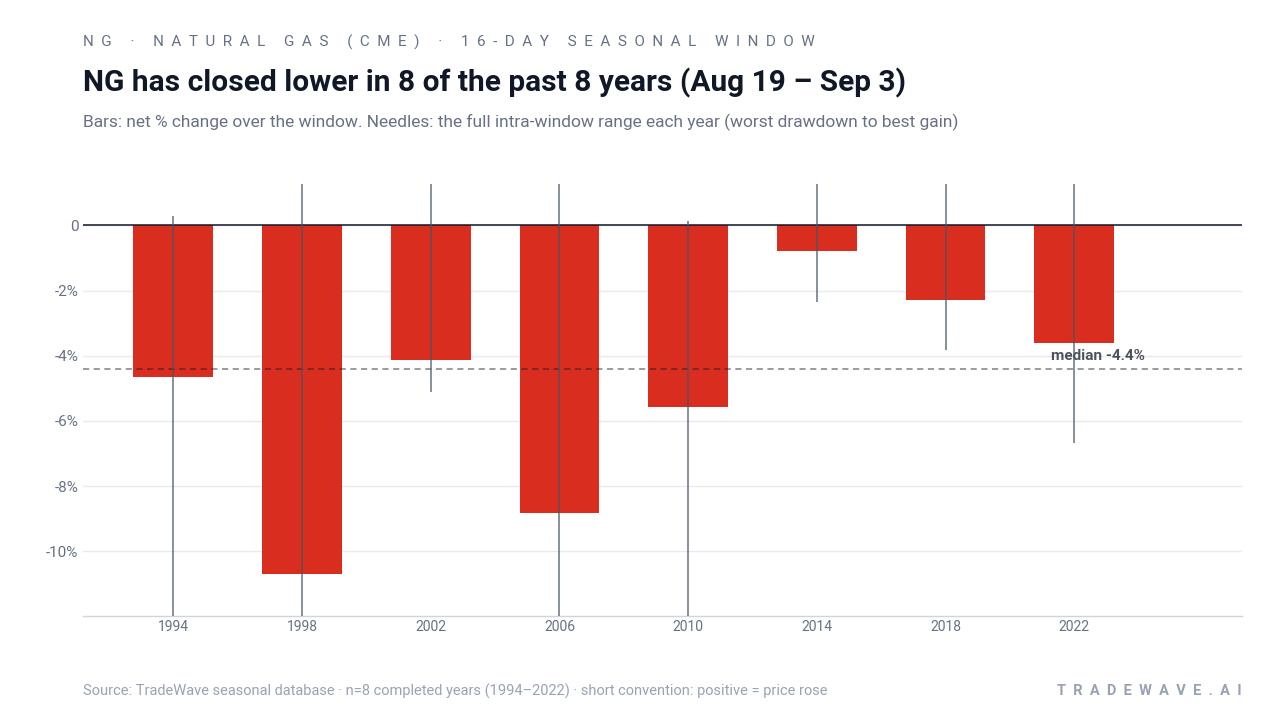
The stacked net, best-case and worst-case excursions underline that this is a high-variance stretch rather than a gentle grind. Large maximum favorable moves for shorts have often come alongside sizeable maximum adverse moves, meaning traders who lean into the historical pattern have historically had to tolerate meaningful squeezes before the window resolves lower. The key takeaway is simple: eight for eight, with a clear bearish seasonal bias for price, but plenty of noise inside the 16 days.
History does not guarantee future results, and adverse excursions can be large even in windows that ultimately finish in the trade direction.
Why does Natural Gas (CME) (NG) follow this seasonal pattern?
This late-August NG seasonal trend likely reflects a mix of commodity supply and demand seasonality and election-cycle positioning. One likely driver is the shoulder-season pivot between peak summer cooling demand and the build-up to winter heating, when storage data, weather models and producer hedging can all shift at once. In midterm election years, analysts have also pointed to policy uncertainty around energy regulation and fiscal priorities, which can amplify repositioning in Henry Hub futures as traders square risk ahead of the heavier autumn macro and policy calendar.
What is driving Natural Gas (CME) (NG) today?
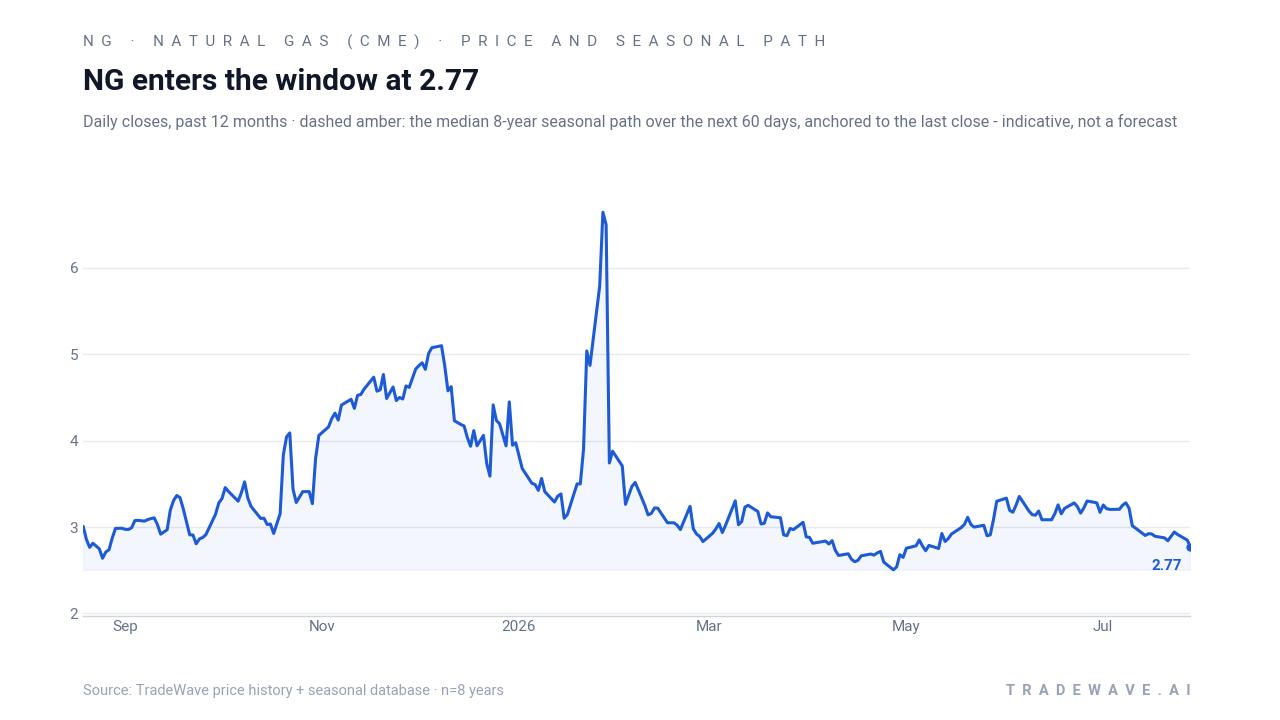
Front-month Natural Gas (CME) futures settled at $2.762 in the prior session, up about 0.51% on the day, but still down roughly 5.37% over the past month as the market digests a volatile winter and a softer shoulder-season demand backdrop. The contract is trading not far above its recent lows and well below last year’s extremes, leaving NG in a relatively subdued price zone compared with the spikes seen during the early-2026 cold snap that sent Henry Hub spot prices surging before they collapsed in February.[7]
On the structural side, CME has been working to deepen liquidity in the Henry Hub complex. On Jul 13, 2026, the exchange announced an expansion of the listing cycle for Henry Hub natural gas average price strip spreads on CME Globex, increasing the number of listed winter and summer strips and giving hedgers more tools to fine-tune seasonal exposure.[4] That move follows a broader push to internationalize U.S. energy benchmarks and attract more overseas participants, which has already helped lift trading volume and open interest in contracts like NG.[3]
The operational backdrop has also been in focus this year. In February 2026, a high-profile Globex outage hit natural gas futures and options during a contract expiry, forcing order cancellations and disrupting rolls for some clients.[1][2] While that episode is months in the past, it sharpened attention on execution risk around key calendar dates, including seasonal windows like the upcoming late-August stretch when many commercial players adjust hedges ahead of the winter strip.
The chart below puts the latest bounce and the upcoming seasonal window in the context of NG’s past year of trading and its historical 60-day seasonal projection.
What should traders watch in this late-August NG window?
The first marker is timing. The 16-day Natural Gas (CME) trading window opens on Aug 19 and runs through Sep 3, overlapping the tail end of summer cooling demand and the early build-up to winter storage debates. Historically, this has been a period when NG has tended to drift lower even as intraperiod rallies tested short conviction, so traders will be watching whether price respects that pattern or breaks it with a sustained move higher.
Second, watch the $2.50 to $3.00 band. That zone has framed much of NG’s recent trading, and how the contract behaves inside it during the window will say a lot about whether the historical seasonality still has bite. A quick rejection of moves above $3.00 during the window would rhyme with prior midterm-year behavior, while a decisive break and hold above that level would mark a clear departure from the eight-for-eight record.
Third, the policy and macro calendar matters. As the midterm election year moves toward its back half, Washington’s budget negotiations, energy policy headlines and any shifts in LNG export rhetoric can all feed into Henry Hub expectations. Traders will be tracking weekly storage reports, updated weather models and any sign that producer hedging in the winter strip is accelerating or slowing, since those flows often intersect with the Aug 19 to Sep 3 window.
Finally, volatility itself is a signal. In prior cycles, the window has featured large maximum favorable and adverse excursions, meaning both squeezes and flushes have been common before the final close. If this year’s window delivers a quieter tape with smaller intraperiod swings, it would suggest that the NG seasonal pattern is moderating as the market structure evolves. If instead the contract again whipsaws sharply but still finishes lower, it would reinforce the idea that late August in midterm years remains a uniquely tricky stretch for natural gas futures.
Sources
- Simply Wall St, "The Bull Case For CME Group (CME) Could Change Following High-Profile Globex Outage On Expiry Day" (Feb 27, 2026).
- Simply Wall St, "CME Outage Tests Trading Reliability As Valuation Premium Faces Fresh Scrutiny" (Feb 27, 2026).
- Simply Wall St, discussion of internationalization of U.S. benchmarks and energy hedging activity (Feb 27, 2026).
- CME Group, "CME Globex Notice: July 13, 2026 - Listing Cycle Expansion for Henry Hub Natural Gas Average Price Strip Spreads" (Jul 13, 2026).
- Simply Wall St, commentary on record open interest in U.S. Treasury contracts and CME volumes (Feb 27, 2026).
- Simply Wall St, additional analysis of Globex outage impacts on natural gas futures (Feb 27, 2026).
- Simply Wall St, note on extreme winter weather and Henry Hub price swings in early 2026 (Feb 27, 2026).
About this seasonal analysis
Seasonal pattern data is sourced from TradeWave.ai, which analyzes historical price behavior across annual calendar windows going back up to 30 years. Read the full data methodology or the book The 100-Year Pattern by Afshin Moshrefi (2026 edition). Past performance of seasonal patterns does not guarantee future results. This article is for informational purposes only and does not constitute investment advice.