ATI Inc. (ATI) Has Dropped in 6 of 7 Midterm Late-Summer Windows for Shorts
ATI Inc. is trading just below a fresh 52-week high after a big earnings beat and guidance hike, even as it approaches a late-August seasonal window that has usually meant downside or volatility for the stock.
Price as of Aug 12, 2026: $230.43 (last close).

What is the seasonal pattern for ATI Inc. (ATI)?
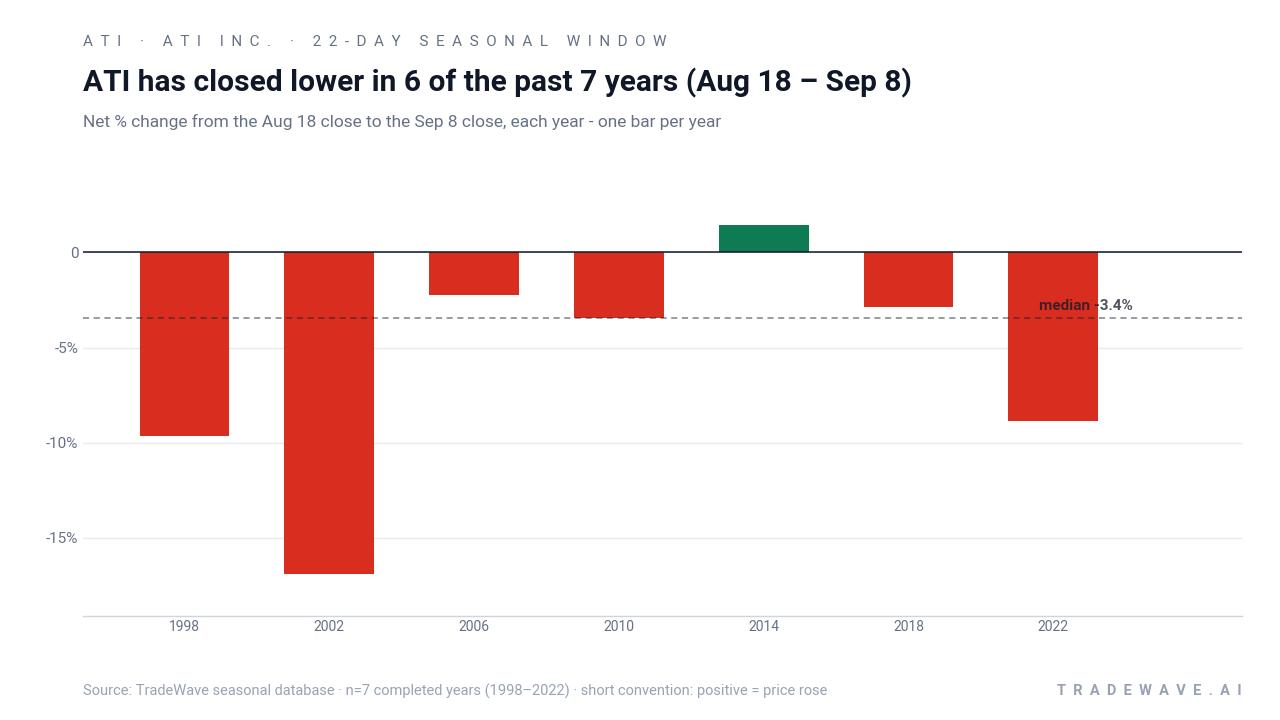
ATI Inc. has fallen in 6 of 7 midterm-year late-August to early-September windows, with an average gain of 7.32% in winning years for the short setup.
- 6 for 7 in this window for the short side, with an average winner gain of 7.32% and a 49% cumulative return across the sample.
- The 22-day trading window runs from Aug 18 to Sep 8 in midterm election years and has historically favored downside in ATI.
- Percent Profitable is 86%, with 6 winning short years and 1 losing year in the last 7 midterm election cycles.
- Including all years, Avg Profit - All is 6%, showing that the single losing year has not erased the broader seasonal edge.
- Intraperiod swings have been meaningful, with sizable worst drawdowns in some years even when the short ultimately worked.
- The TradeWave Ratio of 1.38 points to price often traveling materially in the trade direction within the window before it closes.
According to historical data from TradeWave.ai, this late-August stretch in midterm election years has behaved very differently from an average month for ATI, and the next iteration is just days away.
How has ATI Inc. (ATI) traded in the late-August midterm-year window?
ATI Inc. has closed lower in 6 of the last 7 midterm election years during the Aug 18 to Sep 8 window, a short-biased seasonal pattern that has quietly compounded to a 49% cumulative gain for the short side. Shares finished Thursday at $230.43, leaving the stock about 5.4% below its 52-week high of $243.57 and up roughly 217.53% year-to-date. That combination of a powerful uptrend and a historically weak late-summer window is what makes this setup stand out for traders watching ATI’s seasonal trend.
Because this pattern is grouped by the presidential election cycle, it only looks at ATI’s behavior in the last seven midterm election years, not in every calendar year. That matters in 2026 because the market is in a midterm election year today, with policy uncertainty, budget debates and defense spending decisions all clustering into the back half of the year for an aerospace and materials name like ATI.
This seasonal window begins on Aug 18 and spans 22 days. Historically, during this period, ATI Inc. has tended to drift lower, which is favorable for the short trade direction that the pattern tracks. Percent Profitable sits at 86%, with 6 winning short years and just 1 losing year, so the bias has been clear even across different macro backdrops.
Average profit in the winning short years is 7.32%, meaning that when the pattern has worked, ATI has typically delivered a mid-single to high-single-digit decline from entry to exit. When every year is included, including the one losing year, Avg Profit - All is still 6%, which shows that the outlier did not fully offset the broader seasonal tendency.
The per-year table shows 2002 as one of the strongest years for the short side, with a net return of -16.89% for ATI over the window, while 2014 stands out as the lone losing year for shorts, with a 1.42% gain in the stock over the same stretch. In both cases, the maximum favorable move and maximum adverse move within the window highlight how choppy the path can be even when the final result lines up with the pattern.
Yearly net and intraperiod swings show how far ATI has tended to travel in both directions during this late-summer window.
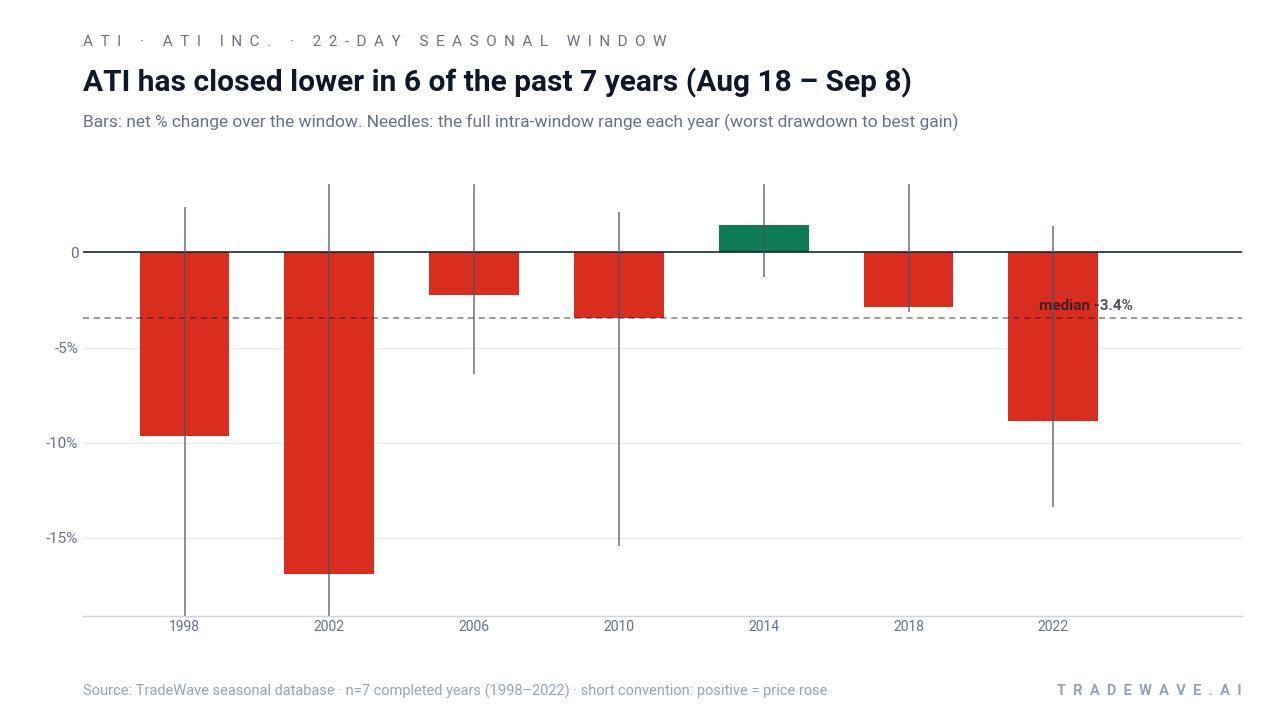
The maximum favorable move within the window has often been sizable for the short side, which lines up with the 1.38 TradeWave Ratio that measures how far price typically travels in the trade direction inside the window. At the same time, maximum adverse moves have also been large in several years, with worst drawdowns in the double digits in 1998, 2002 and 2010, underscoring that shorts have had to sit through sharp countertrend rallies even in ultimately profitable seasons.
Stacking the window year after year compounds to a 49% cumulative return for the short side across the seven midterm election years in the sample. Add it up and the message is straightforward: this has been a consistently negative late-summer stretch for ATI in midterm years, even as the broader presidential cycle often turns more supportive as markets transition into the pre-election year.
History does not guarantee future results; adverse excursions (MAE) can be large even in winning windows.
Why does ATI Inc. (ATI) follow this seasonal pattern?
One likely driver is the way aerospace and defense order flows and production schedules line up with the fiscal and policy calendar in midterm election years, which can make late summer a period of uncertainty for a specialty materials supplier like ATI.[3] Analysts have also pointed to institutional portfolio repositioning around this time, as investors digest first-half results and adjust exposure ahead of budget negotiations and year-end defense spending decisions.[3] This pattern may reflect that mix of policy risk, sector rotation and earnings-season fatigue more than anything specific to ATI’s fundamentals in any single year.
What is driving ATI Inc. (ATI) today?
ATI closed Thursday at $230.43, up 0.15% on the day, after a run that has left the stock more than tripling year-to-date and trading just below its 52-week high of $243.57.[1][2] The move caps a strong stretch following ATI’s Aug 6 second-quarter report, where the company delivered EPS of $1.23 versus a $1.03 consensus and revenue of $1.261 billion, beating on both lines and helping push the stock to a fresh high.[4] Management followed up on Aug 9 by raising full-year 2026 adjusted EPS guidance to a range of $4.90 to $5.18 and guiding third-quarter EPS to $1.31 to $1.37, citing a record $4.4 billion backlog and a stronger ramp in its High Performance Materials & Components segment.[3]
On the fundamental side, ATI sits at the intersection of aerospace and defense demand and specialty materials, two areas that have enjoyed a favorable macro backdrop as engine production and defense programs scale up.[6][11] That has helped underpin a “Buy” consensus rating and a MarketBeat-tracked consensus price target of $226.12, which now sits slightly below the current share price and reflects how quickly the stock has outrun earlier expectations.[1][3] In early August, coverage from Zacks and others highlighted the combination of earnings momentum, valuation and sector tailwinds as reasons ATI had been “crushing it” over the past year, even before the latest breakout.[2][4][6]
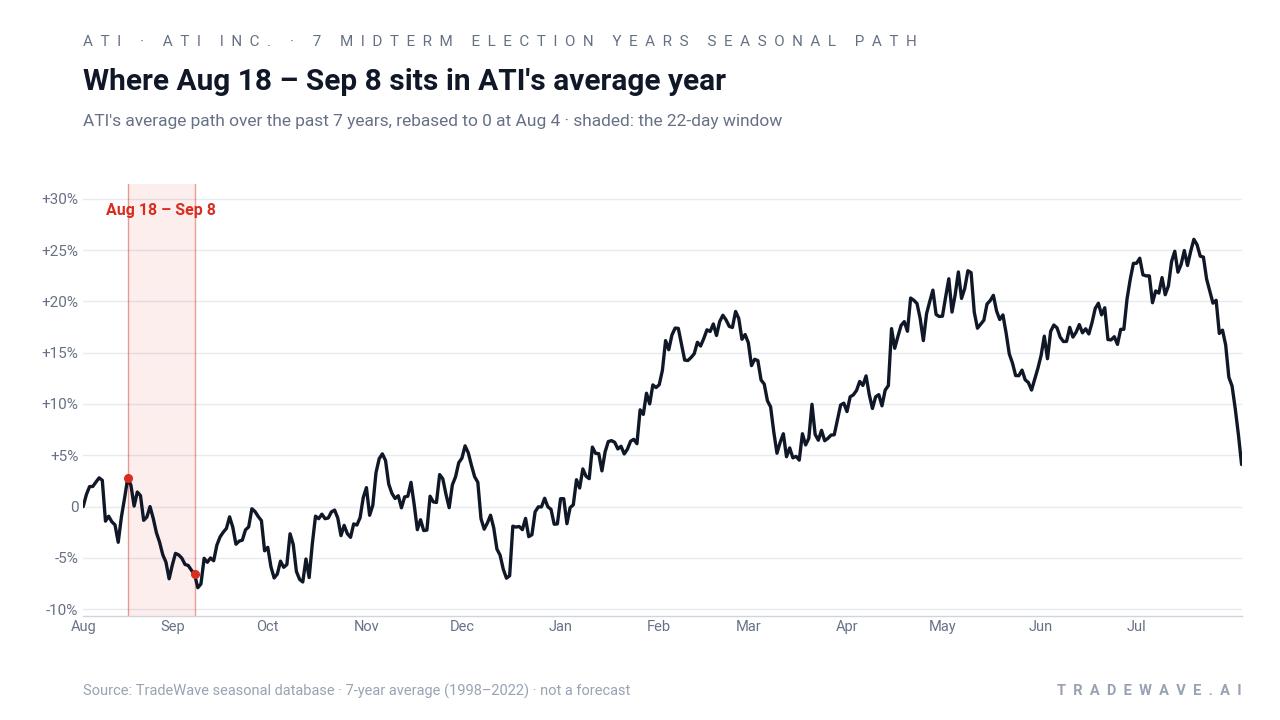
The chart below situates the latest move against ATI’s past year of trading and a historical seasonal projection for the next two months.
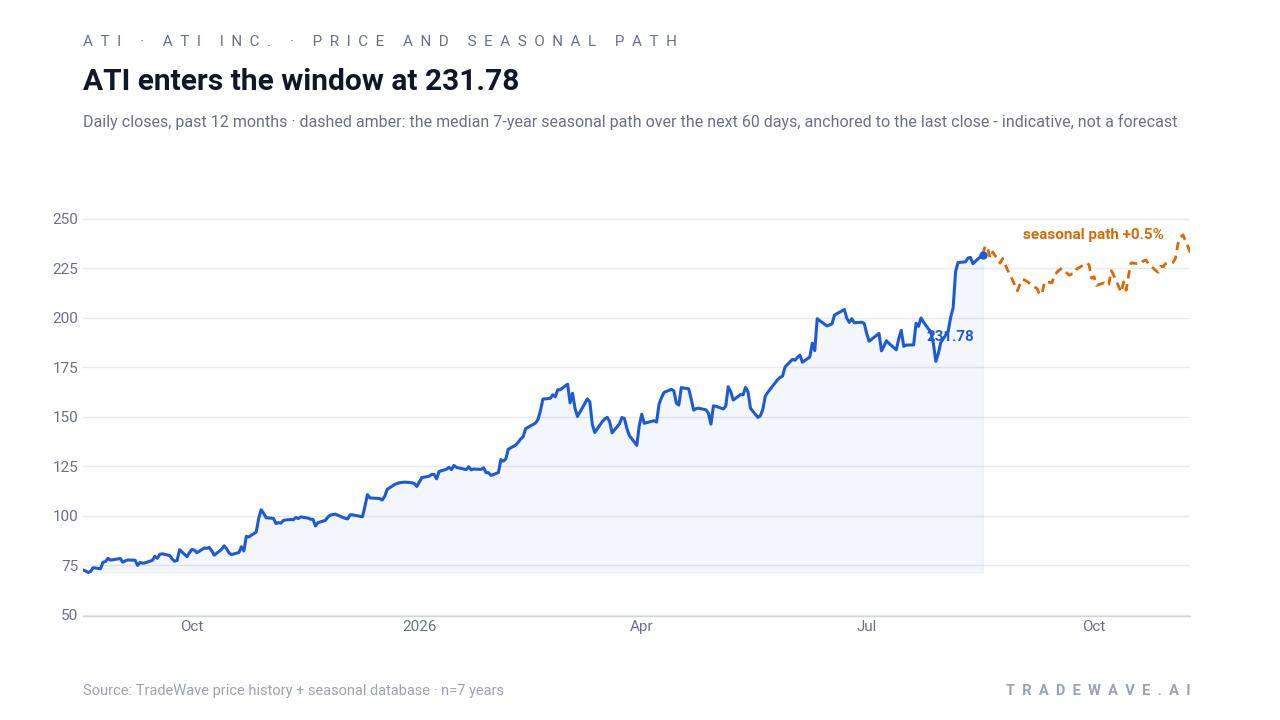
In the near term, the next scheduled catalyst is ATI’s third-quarter earnings report, currently expected around Oct 26, which falls after the Aug 18 to Sep 8 seasonal window.[2][4] That leaves the late-summer stretch dominated more by macro and sector flows than by company-specific news, a setup that has historically coincided with the weaker seasonal pattern highlighted above. For a stock that has already delivered a huge year-to-date move, that timing nuance is what many traders will be watching as the calendar flips into this midterm-year trading window.
What should traders watch in this upcoming ATI seasonal window?
First, watch how ATI behaves as Aug 18 approaches relative to its recent highs. A failure to retest or break above the $243 area during the window would be more in line with the historical pattern, while a decisive breakout and sustained strength would contradict it.
Second, keep an eye on sector and policy headlines tied to aerospace and defense budgets, engine production and materials demand, since those have historically shaped sentiment for ATI around this point in the midterm election year.[3][6][11] Any signs that the record backlog or HPMC ramp are slowing ahead of the October earnings report could add fuel to a seasonal soft patch, while continued order strength could blunt it.[3][4]
Third, monitor trading volume and intraday ranges during the window. Past years have seen sizable maximum adverse moves even in winning short seasons, so sharp rallies inside the window would not automatically negate the pattern but would signal that volatility is tracking the historical playbook.
Finally, the key tell will be where ATI stands by early September. If the stock has drifted lower or chopped sideways off its highs by Sep 8, that would fit the historical midterm-year script. A clean hold near the top of the range or a fresh leg higher through resistance would signal that this cycle is breaking from the usual ATI seasonal trend.
Sources
- MarketBeat (instant-alerts) — Tema ETFs LLC Sells 9,216 Shares of ATI Inc. $ATI (Aug 12, 2026)
- ChartMill — ATI Stock Price, Quote & Chart (Aug 8, 2026)
- MarketBeat (instant-alerts) — Hennion & Walsh Asset Management Inc. Has $7.26 Million Position in ATI Inc. $ATI (Aug 9, 2026)
- Zacks — ATI Inc. (ATI) Hit a 52 Week High, Can the Run Continue? (Aug 6, 2026)
- ChartMill (news) — ATI Inc. (NYSE:ATI) Q1 Earnings Beat and Raised Guidance Drive Pre-Market Rally (Apr 30, 2026)
- The Motley Fool — Why ATI Stock Was Crushing It This Week (Oct 31, 2025)
About this seasonal analysis
Seasonal pattern data is sourced from TradeWave.ai, which analyzes historical price behavior across annual calendar windows going back up to 30 years. Read the full data methodology or the book The 100-Year Pattern by Afshin Moshrefi (2026 edition). Past performance of seasonal patterns does not guarantee future results. This article is for informational purposes only and does not constitute investment advice.