Gold (COMEX) (GC) Has Rallied in 6 of 6 Midterm Fall Windows, Averaging 8.09% Gains
Gold (COMEX) is hovering near record levels as it approaches a midterm-year Sep 9–Jan 16 seasonal window that has never produced a losing year in the past six cycles, sharpening the focus on Fed policy, the dollar and volatility.
Price as of Aug 10, 2026: $4,383.30 (intraday).

What is the seasonal pattern for Gold (COMEX) (GC)?
Gold (COMEX) has risen in 6 of 6 midterm-year Sep 9–Jan 16 windows, with an average gain of 8.09% in winning years.
- 6 for 6 in this window, with Gold (COMEX) averaging 8.09% gains across all six midterm-year Sep 9–Jan 16 runs.
- Percent Profitable is 100%, with 6 winners and 0 losers in the historical sample of midterm election years.
- The window spans 130 calendar days starting Sep 9, clustering around late-year midterm election dynamics and early pre-election positioning.
- Average winner gains of 8.09% stack to a 59% cumulative return when the window is repeated across the six historical cycles.
- Intraperiod swings have been meaningful, with individual years showing double-digit peak run-ups and mid-single-digit drawdowns before finishing higher.
- Trade Direction is long, with a TradeWave Ratio of 2.07 and a Sharpe ratio of 1.94, pointing to a historically favorable risk-adjusted profile for this specific window.
According to historical data from TradeWave.ai, this midterm-year Sep 9–Jan 16 stretch has behaved very differently from an average month on the gold calendar. The next section walks through how that pattern has played out in prior cycles and what it means for the coming quarter.
How has Gold (COMEX) (GC) traded in the Sep 9–Jan 16 midterm-year window?
Gold (COMEX) has finished higher in 6 of the last 6 midterm election years during the Sep 9–Jan 16 window, averaging gains just over 8%. The next iteration of that 130-day stretch begins on Sep 9, with futures recently settling at 4,384.0 and trading in the upper half of their 52-week range between 3,310.1001 and 5,586.2002.[1]
Grouping the data by the presidential election cycle matters here because midterm years often bring a distinct mix of policy uncertainty, fiscal wrangling and shifting expectations for the following pre-election year. For a macro hedge like gold, that combination has historically lined up with a late-year bid as investors reposition around Fed policy, the dollar and potential volatility in risk assets.[2]
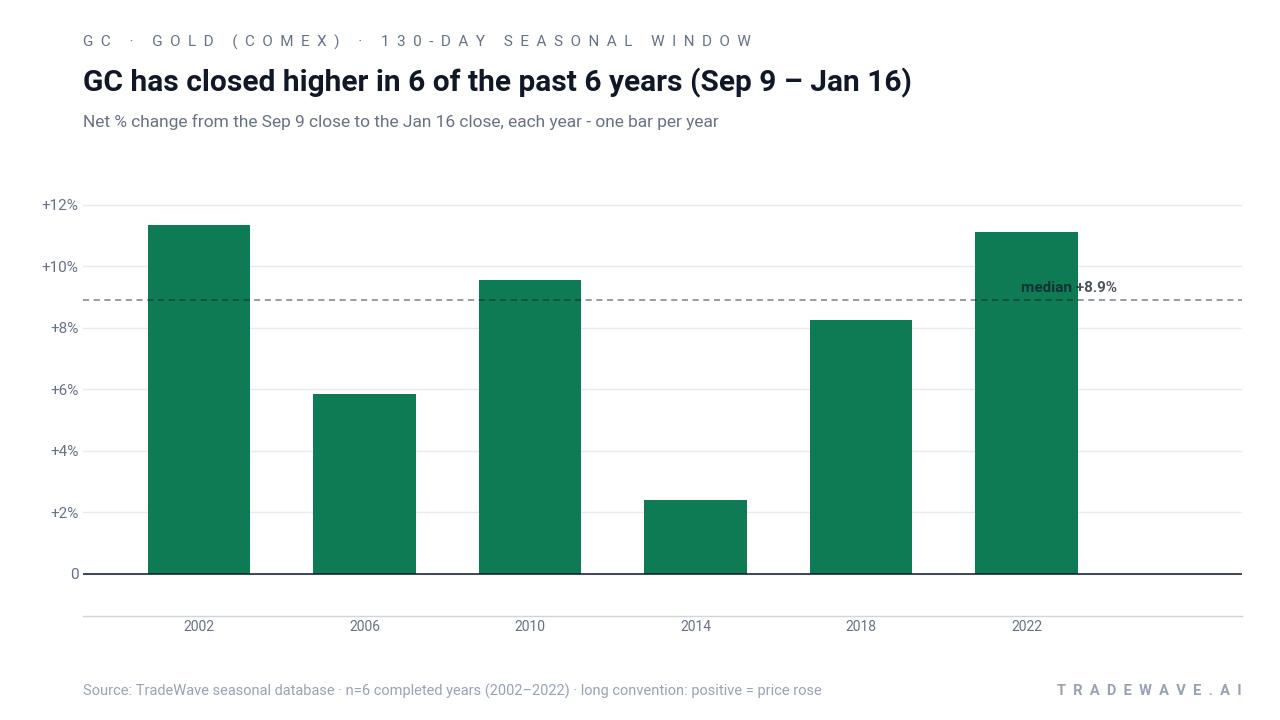
Across the six midterm-year samples from 2002 through 2022, every Sep 9–Jan 16 window delivered a positive close, with net returns ranging from 2.41% in 2014 to 11.33% in 2002. The strongest recent run came in 2022, when gold rallied 11.13% over the window after entering around 1,716.2 and exiting near 1,907.2. Even the softer years still finished green, which is why the Percent Profitable metric sits at 100% with 6 winners and 0 losers.
Average profit across all years is 8.09%, and because there are no losing years in the sample, that figure also represents the typical gain in winning years. The median outcome of 8.9% is slightly higher than the mean, suggesting that most cycles clustered around mid-to-high single-digit returns rather than relying on a single outlier. Stacking the window repeatedly across the six midterm years compounds to a 59% cumulative gain, which is a meaningful contribution for a contract that many investors treat as a portfolio hedge rather than a growth engine.
A second view shows how far gold has typically swung inside the window before settling at those positive closes.
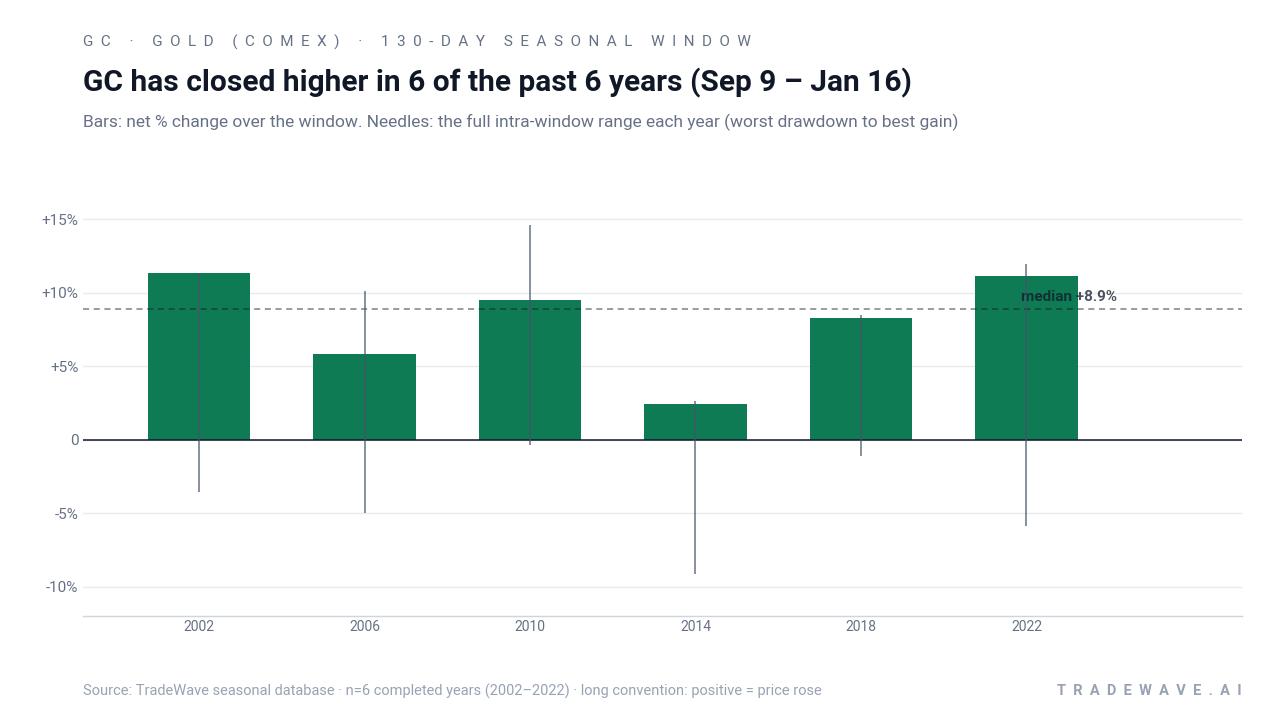
The intraperiod profile has not been a straight line. In 2010, for example, gold’s best move inside the window reached 14.59% above the entry before settling at a 9.54% gain, while the worst drawdown from entry was a modest 0.35%. By contrast, 2014 saw a shallow 2.64% peak run-up but a much deeper 9.13% drawdown before the contract clawed back to a 2.41% gain. That mix of double-digit maximum favorable moves and mid-single to high-single-digit maximum adverse moves is what the TradeWave Ratio of 2.07 is capturing: price has tended to travel meaningfully in the long direction, but not without bumps.
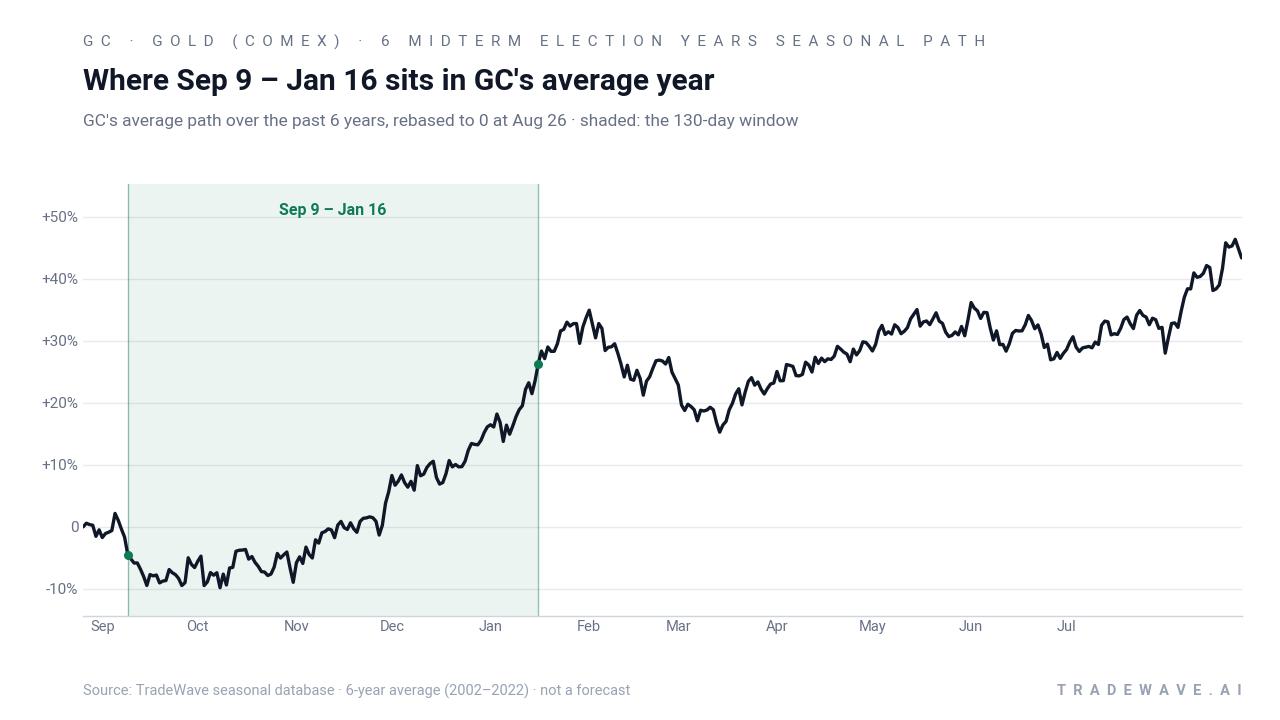
Looking across the six-year average path, the typical pattern shows gold firming through the first half of the window and then consolidating into January. That fits with a macro backdrop where late-year risk events, fiscal deadlines and Fed meetings often cluster in October and December, while early January can bring a reset in positioning. The cumulative return chart for this window slopes steadily higher rather than lurching, which is unusual for a commodity known for sharp spikes.
History does not guarantee future results; adverse excursions inside the window have at times been large even when the final outcome was positive.
Why does Gold (COMEX) (GC) follow this seasonal pattern?
One likely driver is the way policy and liquidity line up in midterm election years, with fiscal debates, Fed meetings and year-end balance-sheet constraints often pushing investors toward hedges in the fourth quarter. Analysts have also pointed to seasonal jewelry and central-bank demand that tends to build into year-end, especially when the dollar is soft or rate expectations are in flux.[2] This pattern may reflect that combination of macro hedging and physical demand converging in the same part of the calendar.
What is driving Gold (COMEX) (GC) today?
Gold (COMEX) futures last settled at 4,384.0, up about 1.0% on the day and roughly 24.5% below the 52-week high of 5,586.2002, leaving the contract still well above the 52-week low of 3,310.1001 and modestly positive year to date at 0.51%.[1] The front-month contract has been trading with a one-month return of 7.24% and sits above its 50-day moving average of 4,161.192014, a sign that the recent bounce has some trend support behind it.[1]
Near term, the macro backdrop has tilted in gold’s favor. A retreating dollar and growing doubts about further Federal Reserve rate hikes helped fuel a rally in early August, as traders reassessed how restrictive policy needs to be with inflation cooling and growth mixed.[2] Lower real-yield expectations and a softer greenback tend to support bullion, and that relationship has been visible again in recent sessions as gold responded quickly to shifts in Fed rhetoric and economic data.
Volatility has not gone unnoticed by the exchange or by options traders. In February 2026, CME Group raised initial and maintenance margins for COMEX 100 gold futures for non-hedger accounts from 8% to 9% after a bout of heightened price swings, a move aimed at containing risk in leveraged positions.[4] In February 2026, a separate article highlighted that after an 11% one-day plunge in late January, traders accumulated roughly 11,000 December $15,000/$20,000 call spread contracts on COMEX, signaling a willingness to pay for long-dated upside exposure even as spot prices were under pressure.[3]
Gold (COMEX) is a systemically important macro asset, shaping inflation expectations, risk sentiment and even currency flows. The fact that it is entering the late stages of a midterm election year with prices elevated, volatility elevated enough to trigger margin hikes, and a history of strong late-year seasonal performance means the upcoming Sep 9–Jan 16 window could be a focal point not just for metals traders but for broader macro portfolios.[2][4]
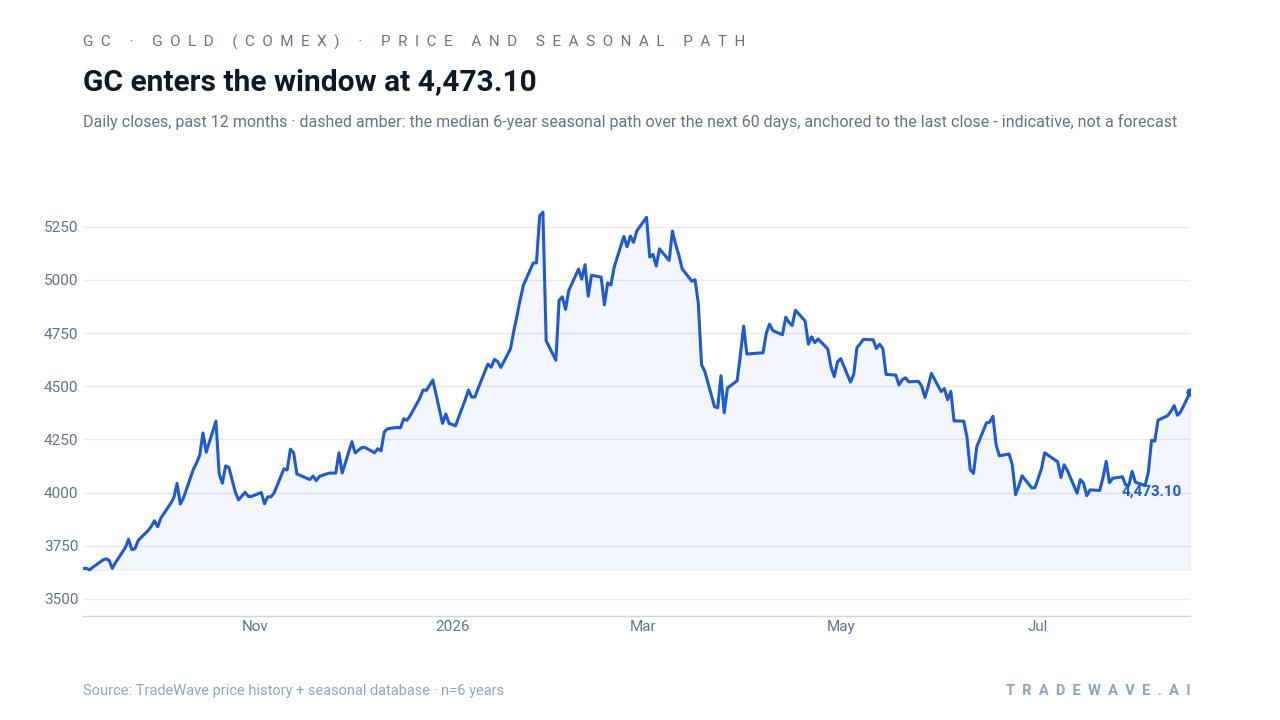
The chart below situates the latest move against the past year of trading and overlays the historical 60-day seasonal path.
What should traders watch as the Sep 9 window approaches?
First, the policy calendar. The next few Fed meetings and key inflation prints will shape real-yield expectations heading into September, which historically has been a key driver of gold’s direction in this midterm-year window.[2] A sustained retreat in the dollar or a clear pause in rate hikes would rhyme with prior cycles where gold caught a late-year bid.
Second, levels. Traders will be watching how GC behaves around the 4,300–4,400 band into early September, as that zone roughly aligns with the recent breakout above the 50-day moving average and sits well above the 52-week low.[1] A firm base there as the window opens would be consistent with the historical pattern of grinding higher through the fall, while a sharp break back toward the low 4,000s would signal that this cycle may diverge from the script.
Third, options and volatility. The February 2026 build-up of roughly 11,000 December $15,000/$20,000 call spreads after an 11% one-day plunge showed that traders were willing to lean into upside tails even in the face of stress.[3] As the seasonal window approaches, the key tell will be whether that kind of upside positioning rebuilds or fades: renewed demand for long-dated calls would suggest investors are again bracing for or betting on a strong late-year move, while a quiet options tape would argue for a more muted interpretation of the historical pattern.
Finally, behavior inside the window itself will matter. In prior midterm years, even winning Sep 9–Jan 16 runs have seen meaningful drawdowns before finishing higher, so traders will be watching whether any early weakness stays within the historical mid-single to high-single-digit intraperiod range or breaks beyond it. If gold sells off sharply and fails to recover by January, that would mark the first clear violation of this six-for-six record and could force a rethink of how much weight to put on this particular seasonal edge.
Sources
- MarketWatch, “GC.1 | Gold (NYM $/ozt) Front Month Overview” (Aug 8, 2026)
- Barchart, “Gold Dec '26 News - Barchart.com” (Aug 8, 2026)
- Yahoo Finance / GuruFocus, “Gold Traders Build 11,000 $15,000/$20,000 Call Spreads After 11% Plunge” (Feb 17, 2026)
- Reuters via Yahoo Finance, “CME Group hikes gold, silver margins again as volatility grips markets” (Feb 5, 2026)
- Yahoo Finance, “Gold price today, Friday, January 9: Gold nears $4,500 per ounce” (Jan 9, 2026)
- Barchart (opinion) via Yahoo Finance, “Gold to $10,000 and Silver to $150: My Wild, Or Perhaps Not-So-Wild 2026 Gold and Silver Price Predictions” (Jan 28, 2026)
About this seasonal analysis
Seasonal pattern data is sourced from TradeWave.ai, which analyzes historical price behavior across annual calendar windows going back up to 30 years. Read the full data methodology or the book The 100-Year Pattern by Afshin Moshrefi (2026 edition). Past performance of seasonal patterns does not guarantee future results. This article is for informational purposes only and does not constitute investment advice.