8-for-8 Midterm Record: CBOE Volatility Index (VIX) Has Fallen Every Aug 11-17 Window
CBOE Volatility Index is heading toward an Aug 11–17 stretch that has consistently seen volatility fade in past midterm election years, even as today’s reading sits near the middle of its 52-week range.
Price as of Aug 4, 2026: $16.50 (last close).

What is the seasonal pattern for CBOE Volatility Index (VIX)?
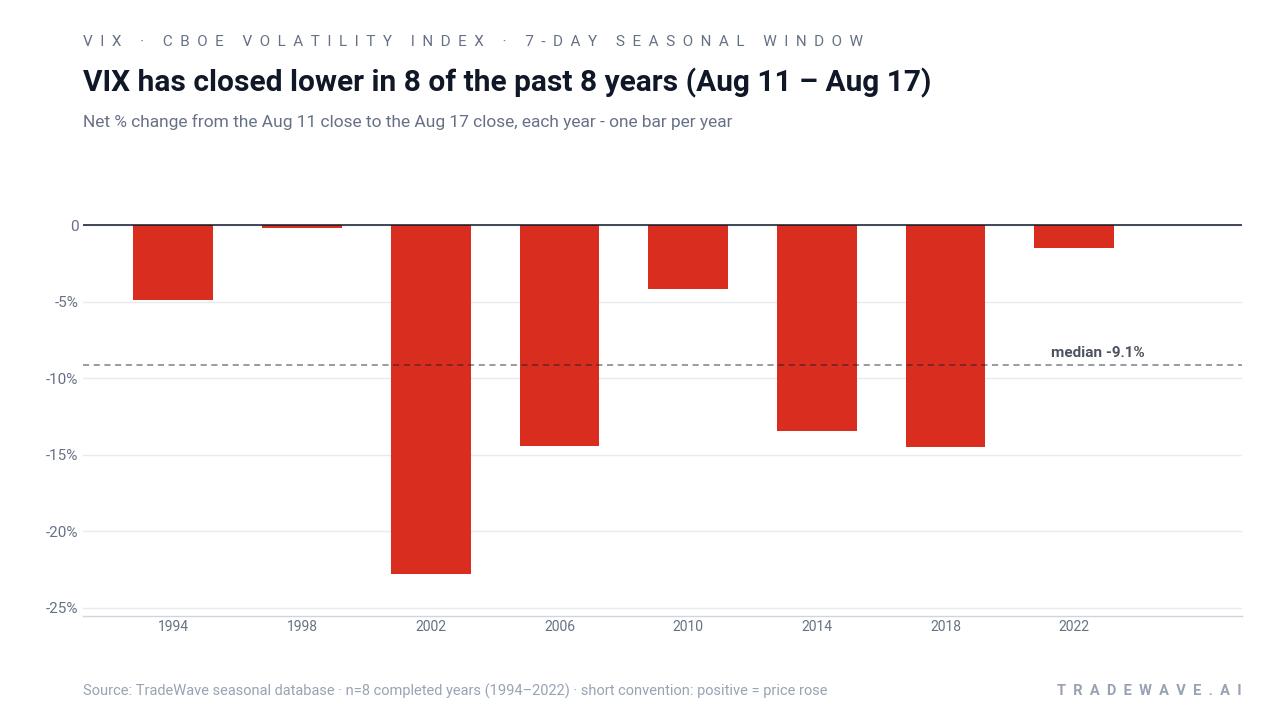
CBOE Volatility Index has fallen in 8 of 8 midterm-year Aug 11–17 windows, with an average gain of 9.47% in winning short trades.
- 8 for 8 in this window, with VIX closing lower every time from Aug 11 to Aug 17 in the last eight midterm election years.
- Percent Profitable is 100%, with 8 winners and 0 losers for the short-side pattern across the sample.
- Avg Profit for winning short trades is 9.47%, stacking to a 102% cumulative return when the window is repeated over the full history.
- The TradeWave Ratio (TWR) of 2.09 signals that VIX typically travels meaningfully in the trade direction within the seven-day window.
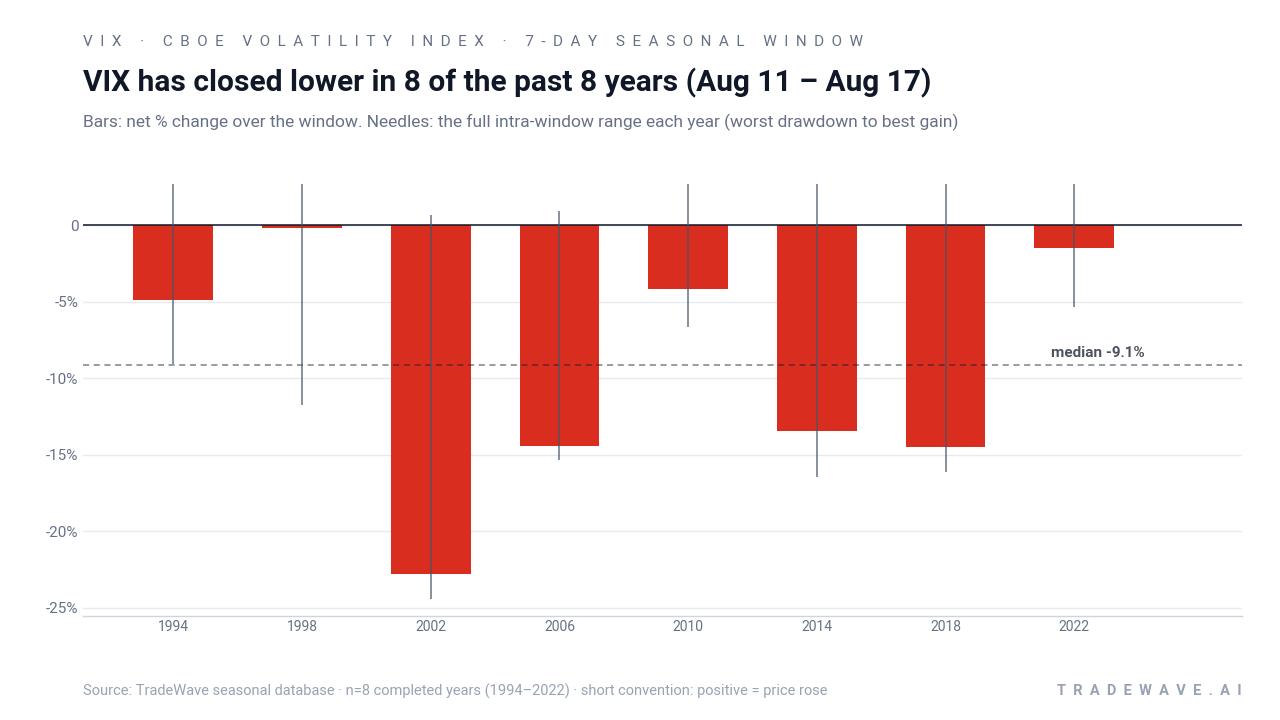
- Intraperiod swings have been sizable, with best-case rallies and worst-case drawdowns both showing that VIX can move sharply before settling lower.
- This pattern is specific to the midterm election year phase, when policy uncertainty and positioning shifts often reshape volatility expectations.
According to historical data from TradeWave.ai, this upcoming August stretch has behaved very differently from an average summer week for volatility. TradeWave.ai’s multi-decade seasonal database flags the Aug 11–17 window in midterm election years as one of the most consistently soft periods for the CBOE Volatility Index.
How has CBOE Volatility Index (VIX) behaved in the Aug 11–17 midterm window?
CBOE Volatility Index has dropped in every single Aug 11–17 window across the last eight midterm election years, delivering a 9.47% average gain for short volatility trades. Today VIX sits at 16.5, up about 4.0% on the prior session and roughly in the middle of its 52-week band between 13.38 and 35.30.[1] That combination of a clean seasonal track record and a mid-range starting level gives this year’s window more room to matter if equities stay calm.
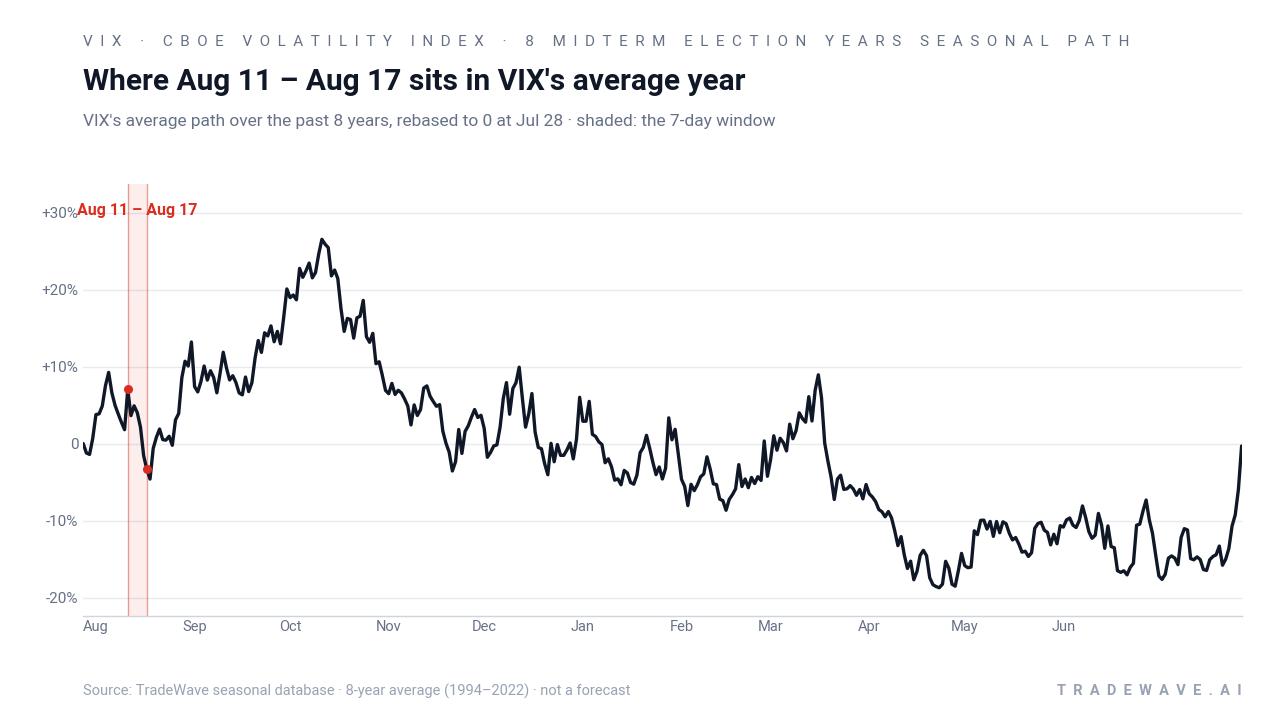
Because this pattern is grouped by the presidential election cycle, it only looks at midterm election years, not every calendar year. That matters for volatility: midterms often bring a mix of policy noise and positioning resets that can front-load stress into the first half of the year, then leave a quieter pocket in late summer as investors wait for the pre-election year, when risk appetite has historically improved.
In this specific seven-day window, the trade direction is short, which means lower VIX readings are the favorable outcome. Across the eight completed midterm-year samples from 1994 through 2022, every iteration delivered a negative net return for VIX, from a modest 0.16% slip in 1998 to a 22.78% slide in 2002. The median profit for shorts is 9.14%, close to the 9.47% average, which suggests the wins have been relatively clustered rather than driven by a single outlier year.
The per-year path shows that even the strongest years for the pattern came with meaningful noise. In 2018, for example, VIX’s best intraperiod rally reached 14.07% above the entry before the index ultimately finished 14.48% lower over the window. In 2002, the worst drawdown from the short entry was 24.40% before VIX rolled over and closed 22.78% below the starting level. That is the essence of MFE/MAE in this context: the best and worst intraperiod excursions from the entry price, not just the final close.
A second view combines net results with the full intraperiod range to show how far VIX has tended to swing before settling lower.
The cumulative chart for this pattern, which stacks each Aug 11–17 result on top of the last, climbs steadily to a 102% compounded gain for the short side over eight midterm election years. There are no flat stretches or reversals in that cumulative line, just a staircase of lower VIX closes in each sample. Add it up: eight for eight, with a triple-digit cumulative gain, is an unusually clean record for any volatility window.
History does not guarantee future results; adverse excursions (MAE) can be large even in winning windows, and VIX can spike sharply on unexpected macro shocks.
Why does CBOE Volatility Index (VIX) follow this seasonal pattern?
One likely driver is the way the policy and earnings calendar lines up in midterm election years. By mid-August, most large companies have reported, Congress is often in recess, and major policy headlines tend to slow, which can compress implied volatility even if the broader backdrop is noisy. Analysts have also pointed to options expiration patterns and institutional portfolio rebalancing in late summer, which can dampen demand for near-dated index protection and help pull VIX lower during this specific week.
What is driving CBOE Volatility Index (VIX) today?
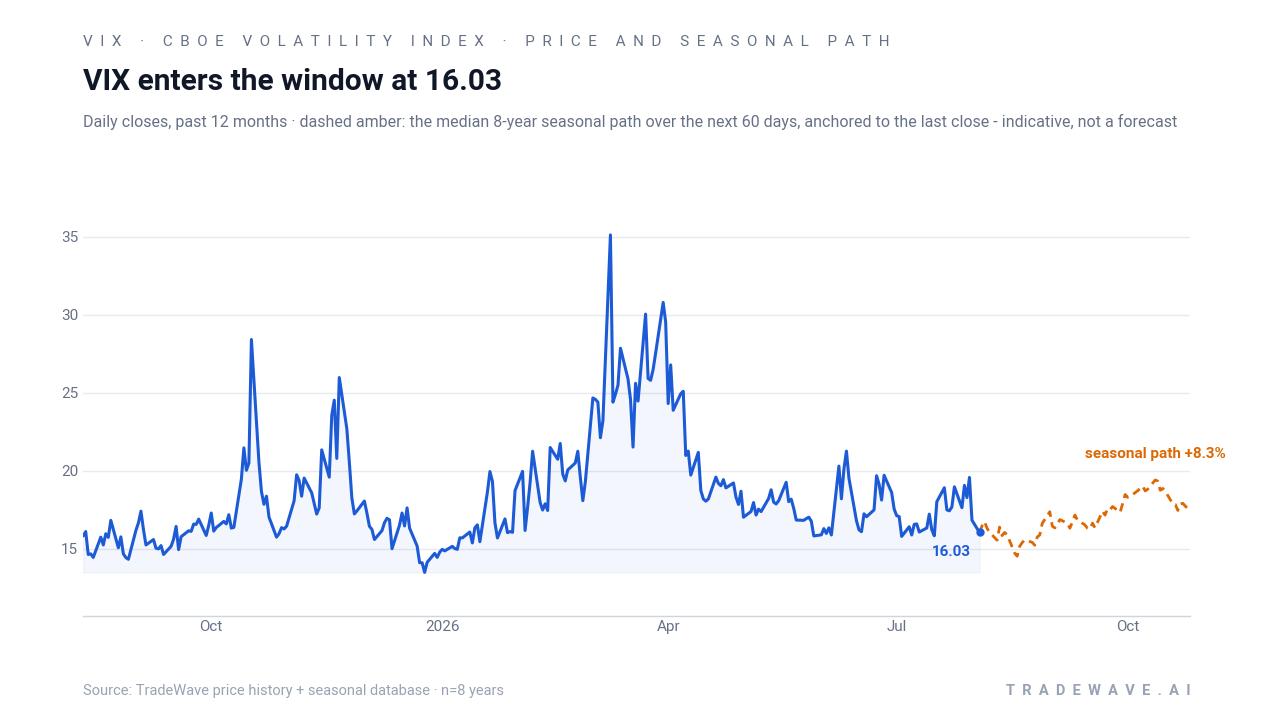
CBOE Volatility Index closed the prior session at 16.5, up 0.64 points or about 4.0% on the day, after trading between 15.51 and 16.65.[1] That leaves the fear gauge about 53.3% below its 52-week high of 35.30 and roughly 23.3% above its 52-week low of 13.38, a middle-of-the-range level that can swing quickly if macro headlines reappear.[1] On Aug 4, Barron’s highlighted that broad macro volatility has been easing even as micro-volatility in single names has ticked higher, a backdrop that can keep index-level VIX subdued while individual stocks whip around more aggressively.[1]
Earlier this summer, VIX posted its biggest single-day pop since March as S&P 500 options trading hit a record, with 7.8 million contracts changing hands in one session.[1] That spike in options activity, reported in June, underscored how quickly demand for index hedges can surge when investors rush to protect gains, even if the starting point for VIX is relatively low.[1] In November 2025, VIX briefly spiked to 27.8, its highest level since a tariff-driven selloff years earlier, reminding traders that policy surprises and tech-valuation worries can still jolt the fear gauge well above its comfort zone.[11] Against that backdrop, the current mid-range reading and the approaching historically soft August window create an interesting tension between realized calm and the ever-present risk of a volatility shock.
The chart below shows how the latest move fits into VIX’s past year of trading, alongside the median seasonal path for the next 60 days.
What should traders watch as the Aug 11–17 window approaches?
First, watch how VIX behaves as it moves closer to the 13–14 zone that has repeatedly marked the lower end of its 52-week range.[1] A drift toward that floor ahead of Aug 11 would line up with the historical pattern of volatility compression in this midterm-year window, while a sudden spike back toward the high 20s would mark a clear break from the script. Second, keep an eye on S&P 500 options volumes and skew: if record-level contract activity like June’s 7.8 million-contract day reappears, it would signal renewed demand for protection that could overwhelm the usual seasonal fade.[1]
Third, monitor the macro and policy calendar into mid-August. A quiet stretch on inflation, rates and regulation would support the historical tendency for VIX to soften, while any surprise around growth data or tech regulation could trigger the kind of volatility bursts seen in November 2025.[11] Finally, because VIX is a central barometer for equity risk appetite, traders will be watching whether this midterm-year window once again delivers a clean volatility fade or whether a break in the pattern signals a different regime as markets transition toward the pre-election year. How VIX trades inside this seven-day slice will offer an early read on whether the long-running August seasonal trend is still in force.
Sources
About this seasonal analysis
Seasonal pattern data is sourced from TradeWave.ai, which analyzes historical price behavior across annual calendar windows going back up to 30 years. Read the full data methodology or the book The 100-Year Pattern by Afshin Moshrefi (2026 edition). Past performance of seasonal patterns does not guarantee future results. This article is for informational purposes only and does not constitute investment advice.