Natural Gas (CME) (NG) Faces Late-August Window With 8-of-8 Midterm Drops for Shorts
Natural Gas (CME) is sliding in 2026 and will soon hit a late-August seasonal window that has consistently leaned lower in past midterm election years, adding another layer of risk to an already volatile contract.
Price as of Jul 30, 2026: $2.73 (intraday).
What is the seasonal pattern for Natural Gas (CME) (NG)?
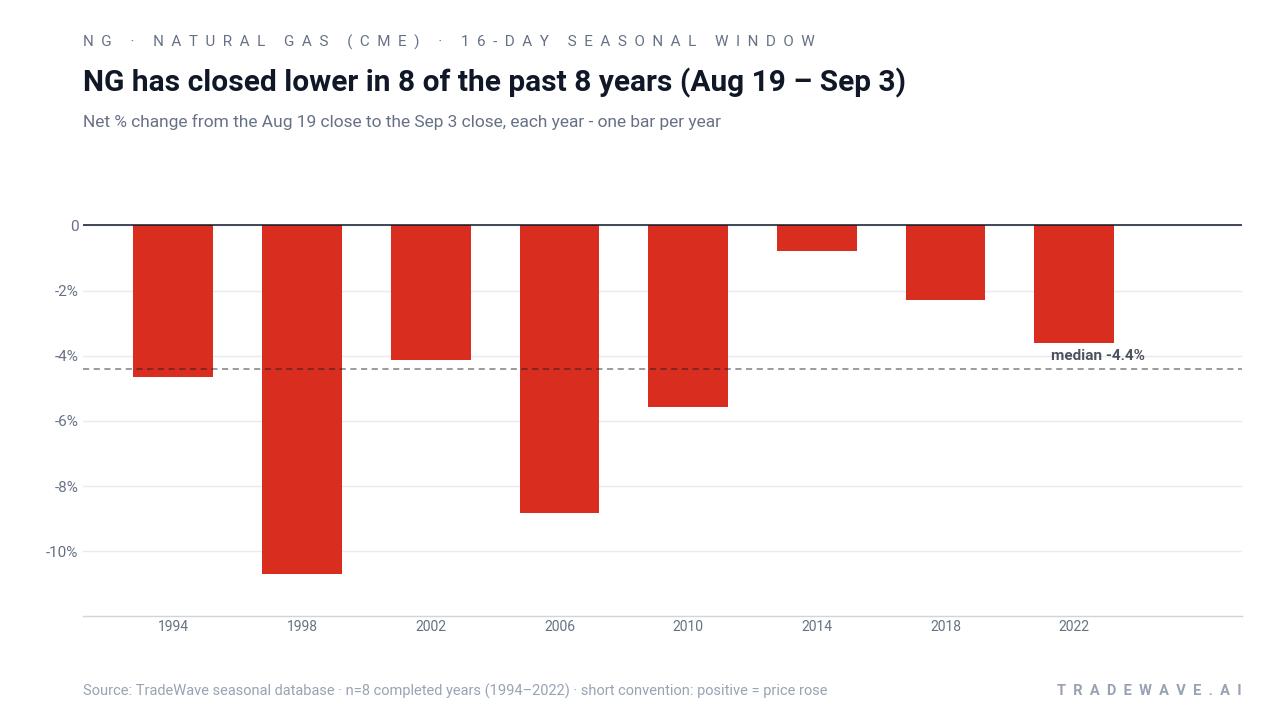
Natural Gas (CME) has fallen in 8 of 8 midterm-year late-August windows (Aug 19 to Sep 3), with an average 5.07% gain for short positions in winning years.
- 8 for 8 in this window, with short trades averaging 5.07% profit in winning years across the last 8 midterm election cycles.
- The 16-day window runs from Aug 19 to Sep 3 and has produced a 100% Percent Profitable record for shorts, with 8 winners and 0 losers.
- Average cumulative return across all years is 48%, reflecting repeated late-August softness in NG during midterm election years.
- Individual years have seen adverse moves against the short as deep as about 16%, showing that drawdowns can be sharp even when the final close is lower.
- The TradeWave Ratio of 1.71 signals that price has typically traveled meaningfully in the trade direction within the window, not just drifted lower.
- A Sharpe ratio of 1.49 for this pattern points to historically attractive risk-adjusted returns for the short side in this specific calendar slice.
According to historical data from TradeWave.ai, this late-August stretch in midterm election years has behaved very differently from an average month in natural gas, and the next iteration is less than three weeks away.
How has Natural Gas (CME) (NG) traded in the late-August midterm-year window?
Natural Gas (CME) has closed lower in every single late-August window across the last 8 midterm election years, with short positions averaging a 5.07% profit over the 16-day span. Futures settled at 2.733 per million British thermal units at the prior session’s close, leaving NG deeply negative for 2026 with a year-to-date loss of 26.7% and trading not far above its 52-week low of 2.483.[1] That combination of a statistically strong bearish seasonal pattern and already weak spot pricing gives late-August a different feel than a typical shoulder-season lull.
Grouping the data by the presidential election cycle matters here because midterm election years often bring shifting policy debates on energy, regulation and fiscal priorities, which can alter hedging behavior and speculative flows in natural gas. This pattern is built from the last 8 midterm election years, so each data point reflects how NG behaved in that specific political and macro backdrop rather than in a generic August.
The trade direction for this window is explicitly short. Across the 8 completed midterm-year samples from 1994 through 2022, every instance delivered a negative net return for NG prices over the Aug 19 to Sep 3 span, which translates into a 100% Percent Profitable record for shorts with 8 winners and 0 losers. Average profit for those winning short trades was 5.07%, while the median profit came in at 4.39%, suggesting the typical outcome has been a mid-single-digit slide rather than a one-off collapse.
Individual years show a range of outcomes but all in the same direction for the short side. The strongest year for shorts was 1998, when NG fell 10.69% over the window, while the softest was 2014, when prices slipped just 0.77% from entry to exit. Even in that milder 2014 case, the contract still finished the window lower, preserving the clean 8-for-8 record.
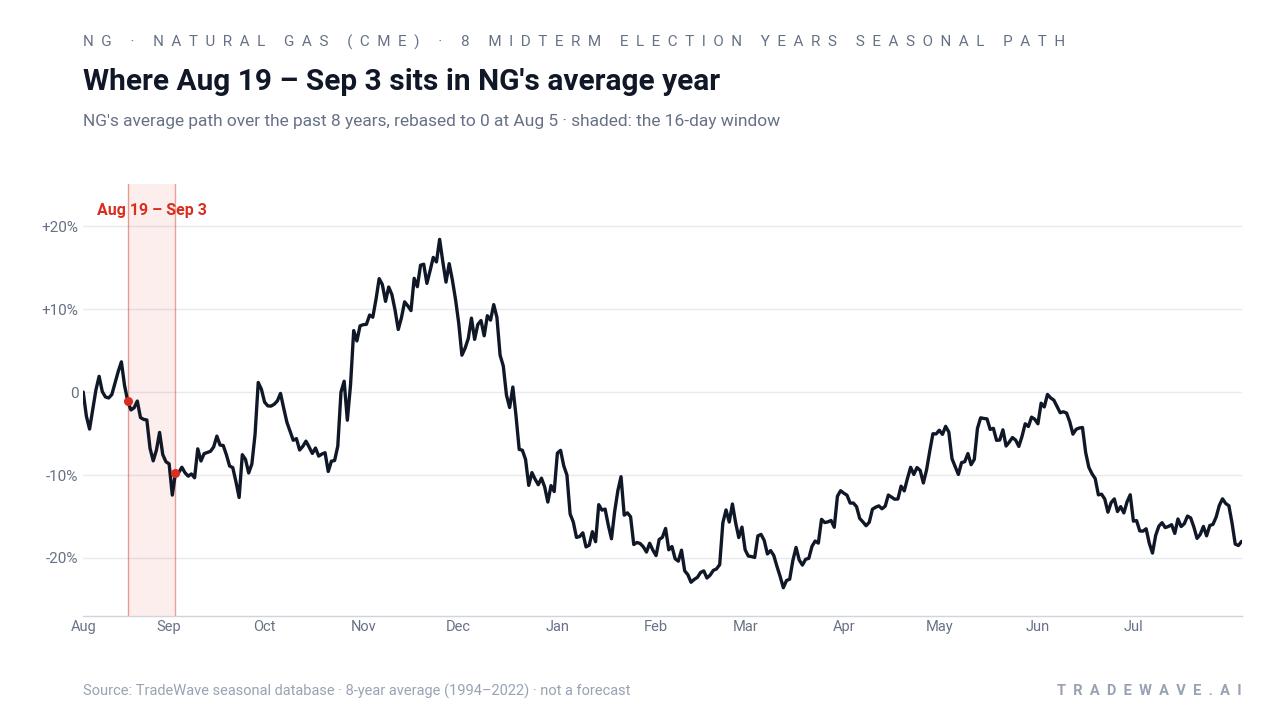
The historical seasonal average path suggests that weakness often builds into the window rather than appearing out of nowhere. In the composite, NG tends to flatten or soften in early August, then drifts lower through the 16-day span, with the bulk of the move occurring in the middle third of the window. That profile lines up with the short bias and helps explain why the TradeWave Ratio is above 1, indicating that price usually travels a meaningful distance in the trade direction during this slice of the calendar.
The intraperiod range chart shows how far NG has swung both for and against the short in each year.
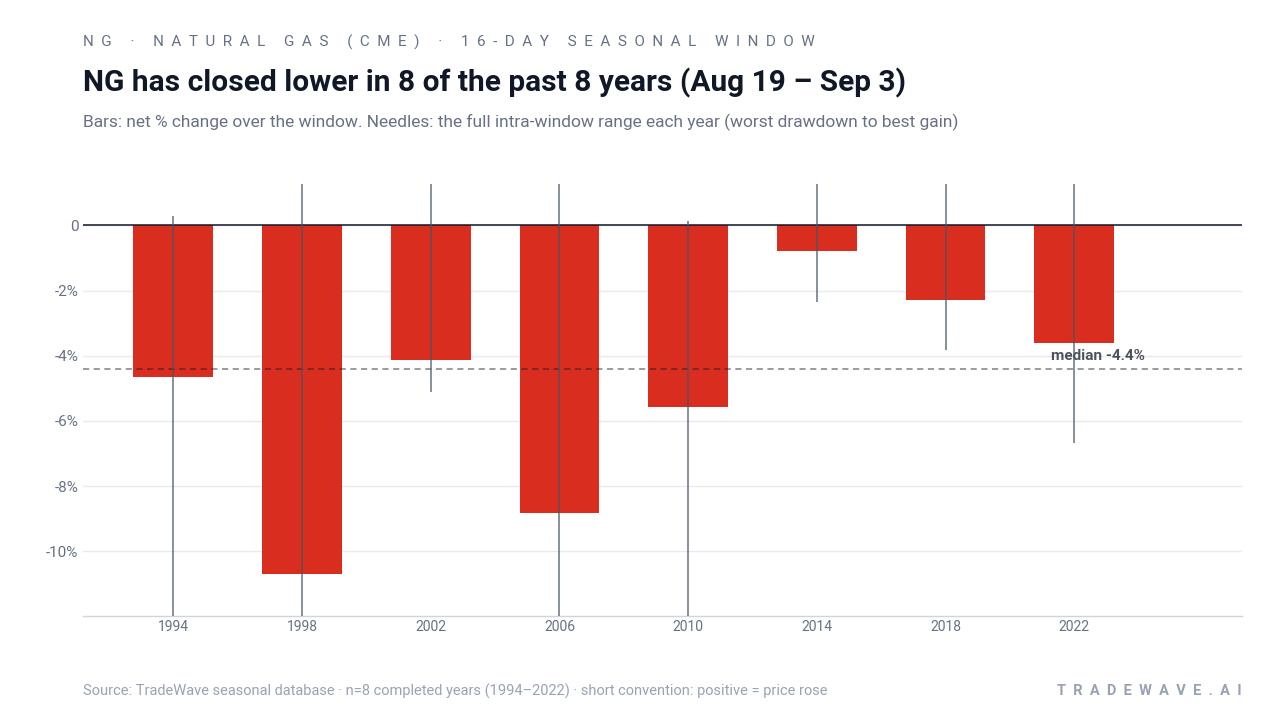
The combined net-return and range chart shows that maximum favorable moves for the short side have often been larger than the final net result, while maximum adverse moves have at times been deep. In 1998, for example, NG’s worst drawdown against the short reached about 16.01% before the contract ultimately finished the window down 10.69%, while in 2006 the worst adverse move was about 13.8% even though the final decline was 8.83%. That MFE/MAE profile points to a window where price can whipsaw sharply inside the range even when the closing direction lines up with the historical pattern.
History does not guarantee future results; adverse excursions can be large even in winning windows, and traders can experience significant drawdowns before any seasonal tendency plays out.
Why does Natural Gas (CME) (NG) follow this seasonal pattern?
One likely driver is commodity supply and demand seasonality, as late August often sits between peak summer cooling demand and the ramp-up to winter heating season, which can leave prices vulnerable when storage builds are comfortable. Analysts have also pointed to positioning resets around this time, with producers, utilities and speculators adjusting hedges and exposure ahead of the more weather-sensitive autumn and winter months. In midterm election years, shifting policy headlines on energy and regulation may add another layer of uncertainty, encouraging risk reduction that has historically lined up with this window.
What is driving Natural Gas (CME) (NG) today?
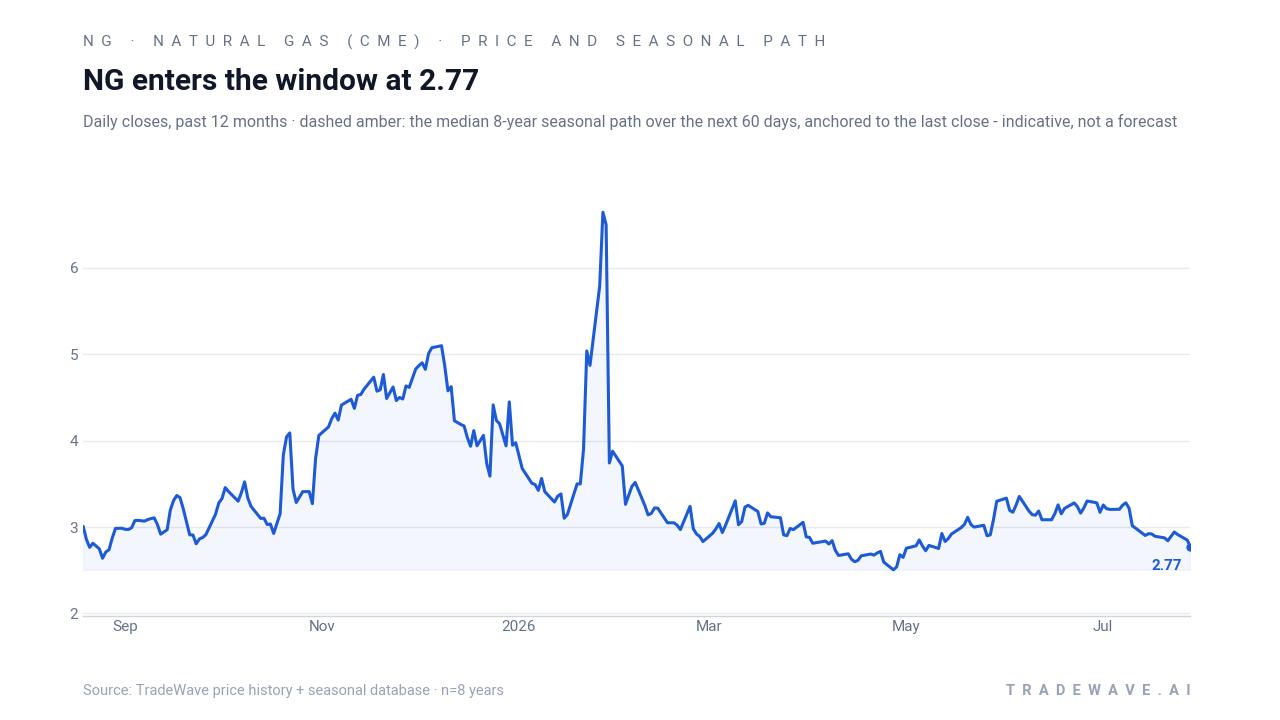
Natural gas futures are trading at 2.733, up a fraction on the prior session but still down 26.7% for 2026 as a whole, leaving the contract well below its 50-day moving average of about 3.09 and far from last year’s spike toward 7.827.[1] The slide follows an extreme start to the year in the physical market, when Henry Hub spot prices surged to roughly 30.72 on Jan 23 before collapsing toward 3.13 by late February, a round trip that rattled leveraged products tied to NG futures and underscored how violent this market can be.[6] In January, CME Group also reported a record 2,576,346 natural gas futures and options contracts traded in a single day, signaling intense interest and liquidity in the complex even as prices whipsawed.[5]
That surge in activity has come alongside questions about infrastructure reliability. In February 2026, a Globex outage halted trading in natural gas futures and options during a key expiry window, disrupting rolls and execution and prompting some market participants to reassess operational risk around critical dates.[3][4] For traders looking ahead to the late-August seasonal window, those episodes are a reminder that liquidity and systems risk can matter as much as direction when volatility spikes.
The chart below places the latest pullback in the context of the past year and overlays the historical seasonal path for the next two months.
What should traders watch as the late-August window approaches?
First, the calendar: the 16-day window runs from Aug 19 to Sep 3, so any sharp move in NG around that period will be trading directly into a slice of the year that has historically favored the short side. Price action relative to the 2.50 to 3.00 band will be important; a break below the 52-week low of 2.483 during the window would echo prior midterm-year softness, while a squeeze back above the 50-day moving average near 3.09 would mark a clear departure from the pattern.[1]
Second, volatility and liquidity. The January volume record and the earlier spot-price spike showed how quickly flows can build when natural gas gets moving.[5][6] If open interest and daily volumes ramp again into late August, that would increase the odds of large intraperiod swings similar to the historical MFE and MAE ranges, even if the final direction ends up modest.
Third, the policy and macro backdrop. As the midterm election year progresses, any shifts in rhetoric around energy regulation, export policy or fiscal support for infrastructure could influence hedging demand from producers and utilities. Traders will be watching weekly storage data and weather models for confirmation or contradiction of the historical late-August pattern; a string of bullish storage surprises or heat-driven demand spikes during the window would test how robust this seasonal tendency really is.
Finally, behavior inside the window itself will be the real tell. If NG grinds lower with intraday rallies that fade, it would fit the historical script of profitable but sometimes choppy short setups. A sustained rally that holds above key moving averages through Sep 3 would mark the first clear break in this 8-for-8 record and signal that the 2026 midterm-year backdrop is rewriting the usual late-August playbook.
Sources
- MarketWatch: Natural Gas Continuous Contract Overview (Jul 29, 2026)
- MarketWatch: Natural Gas (NYM $/mmbtu) Front Month Overview (Jul 29, 2026)
- Yahoo Finance / Simply Wall St: The Bull Case For CME Group (CME) Could Change Following High-Profile Globex Outage On Expiry Day (Feb 27, 2026)
- Yahoo Finance / Simply Wall St: CME Outage Tests Trading Reliability As Valuation Premium Faces Fresh Scrutiny (Feb 27, 2026)
- PR Newswire: CME Group Sets New Record in Natural Gas Futures and Options (Jan 21, 2026)
- Yahoo Finance / 24/7 Wall St.: BOIL Is the Most Dangerous ETF in Energy Right Now and That Is Exactly Why Traders Love It (Mar 3, 2026)
About this seasonal analysis
Seasonal pattern data is sourced from TradeWave.ai, which analyzes historical price behavior across annual calendar windows going back up to 30 years. Read the full data methodology or the book The 100-Year Pattern by Afshin Moshrefi (2026 edition). Past performance of seasonal patterns does not guarantee future results. This article is for informational purposes only and does not constitute investment advice.