Silver (SI) Has Closed Higher in 7 Straight Oct-Jan Midterm Runs, Averaging 11.66% Gains
Silver is trading well below its 52-week peak just as it approaches a midterm-year seasonal window that has never produced a losing cycle, putting a spotlight on how this winter’s pattern could intersect with elevated precious-metals volatility.
Price as of Sep 9, 2026: $66.80 (intraday).
What is the seasonal pattern for Silver (SI)?
Silver has risen in 7 of 7 midterm-year Oct 9 to Jan 27 windows, with an average gain of 11.66% in winning years.
- 7 for 7 in this window, with average gains of 11.66% across winning years and a 114% cumulative return over the sample.
- Seasonal window runs from Oct 9 through Jan 27, spanning 111 days in the late part of the midterm election year.
- Percent Profitable is 100%, with 7 winners and 0 losers across the last 7 midterm election years in this pattern.
- Trade Direction is long, supported by a TradeWave Ratio of 1.75 and a Sharpe ratio of 1.82 for end-of-window outcomes.
- Intra-window swings have been meaningful, with some years seeing double-digit drawdowns even as they finished higher.
- The pattern clusters gains in a winter stretch that often coincides with shifting policy expectations ahead of the pre-election year.
According to historical data from TradeWave.ai, this midterm-year winter stretch in Silver has behaved very differently from an average calendar quarter, with a distinct directional bias that traders rarely see discussed in day-to-day metals coverage.
How has Silver (SI) traded in past midterm-year winter windows?
Silver has closed higher in every single Oct 9 to Jan 27 window across the last seven midterm election years, averaging an 11.66% gain for long positions. Today the futures contract sits at 66.72, about 45.2% below its 52-week high of 121.79 and above the 52-week low of 47.41, leaving plenty of room on the chart if the historical winter pattern shows up again.
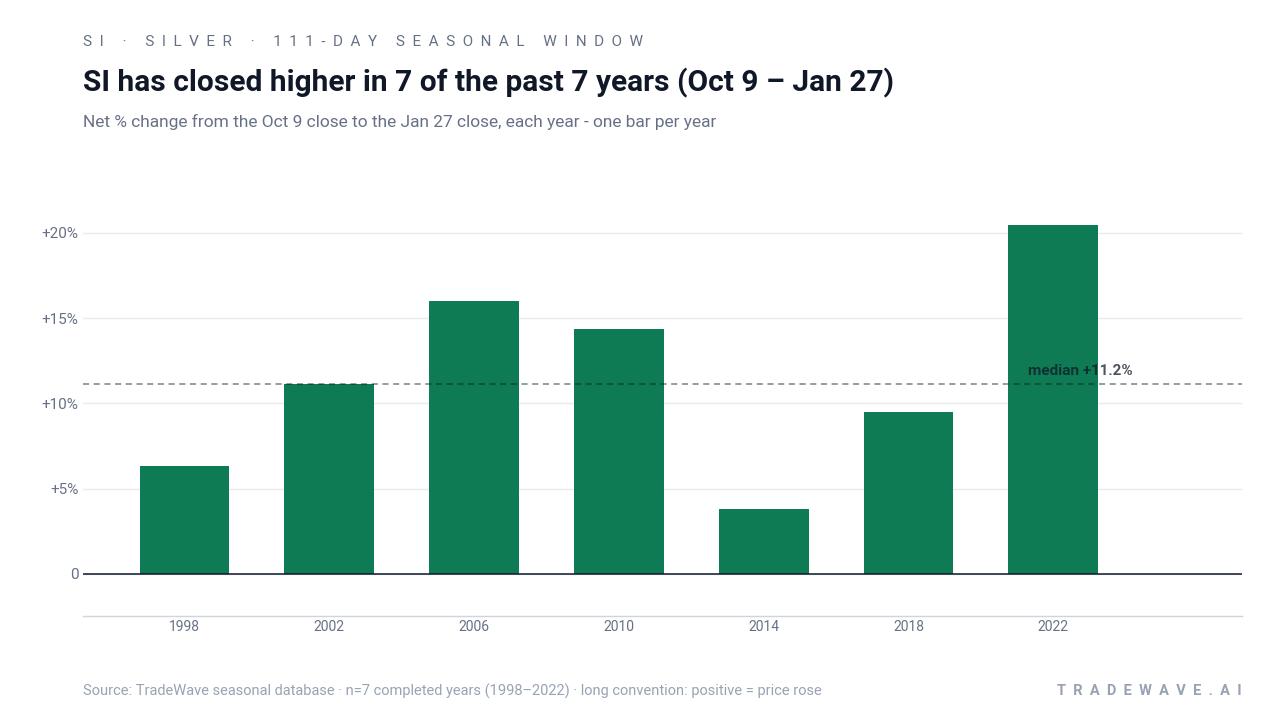
Because this pattern is grouped by the presidential election cycle, it only looks at years that match today’s backdrop: the late part of a midterm election year, just before the pre-election year begins. That matters for commodities like Silver because fiscal policy, regulation and liquidity conditions often shift in predictable ways around midterms, which can influence industrial demand expectations and risk appetite in precious metals.
Across the seven midterm election years in this sample, the Oct 9 to Jan 27 Silver trading window has delivered a 114% cumulative return when the gains are compounded year over year. The average winner gained 11.66%, with a median outcome of 11.15%, so this is not a pattern driven by a single outlier year. The trade direction is explicitly long, and there have been no losing years in this specific slice of the calendar.
The per-year breakdown shows how consistent that SI seasonal trend has been. The weakest outcome was 3.82% in 2014, while the strongest was 20.43% in 2022, with several mid-teens gains in between. In other words, the pattern has not just been “barely positive” most of the time; it has often produced double-digit moves over roughly three and a half months.
Intraperiod swings have been meaningful, which is where the maximum favorable move and maximum adverse move statistics come in. In 2010, for example, Silver’s best run-up within the window reached 32.34% from the entry level, while the worst drawdown from entry was 3.36%. In 2014, the contract still finished higher, but the worst drawdown inside the window reached 18.73% even though the final gain was only 3.82%, a reminder that a winning seasonal window can still feel painful along the way.
Looking across all seven years, the pattern’s volatility profile lines up with those anecdotes. The standard deviation of end-of-window returns is 5.75%, and the Sharpe ratio of 1.82 suggests that, historically, the reward per unit of risk has been attractive for this long setup. At the same time, the TradeWave Ratio of 1.75 indicates that price has typically traveled a fair distance in the trade direction within the window, which fits with the large maximum favorable excursions seen in several years.
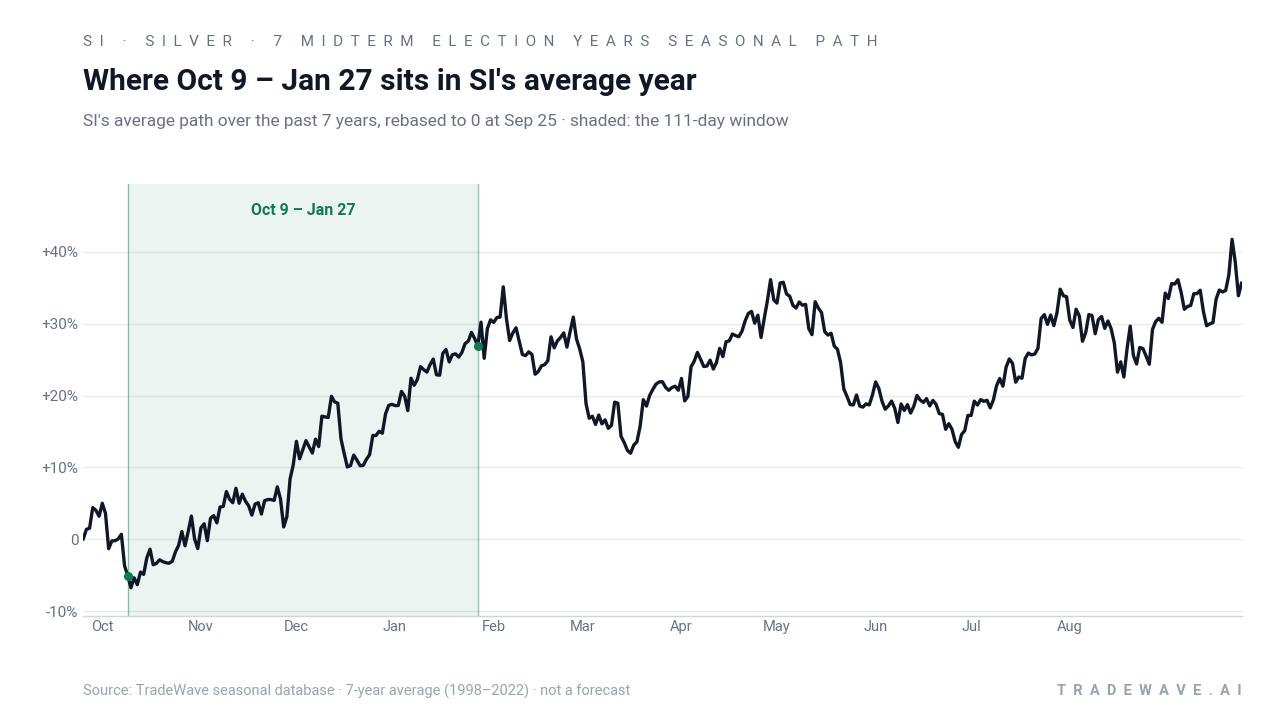
Year-by-year ranges show how those average gains have come with sizable intraperiod swings.
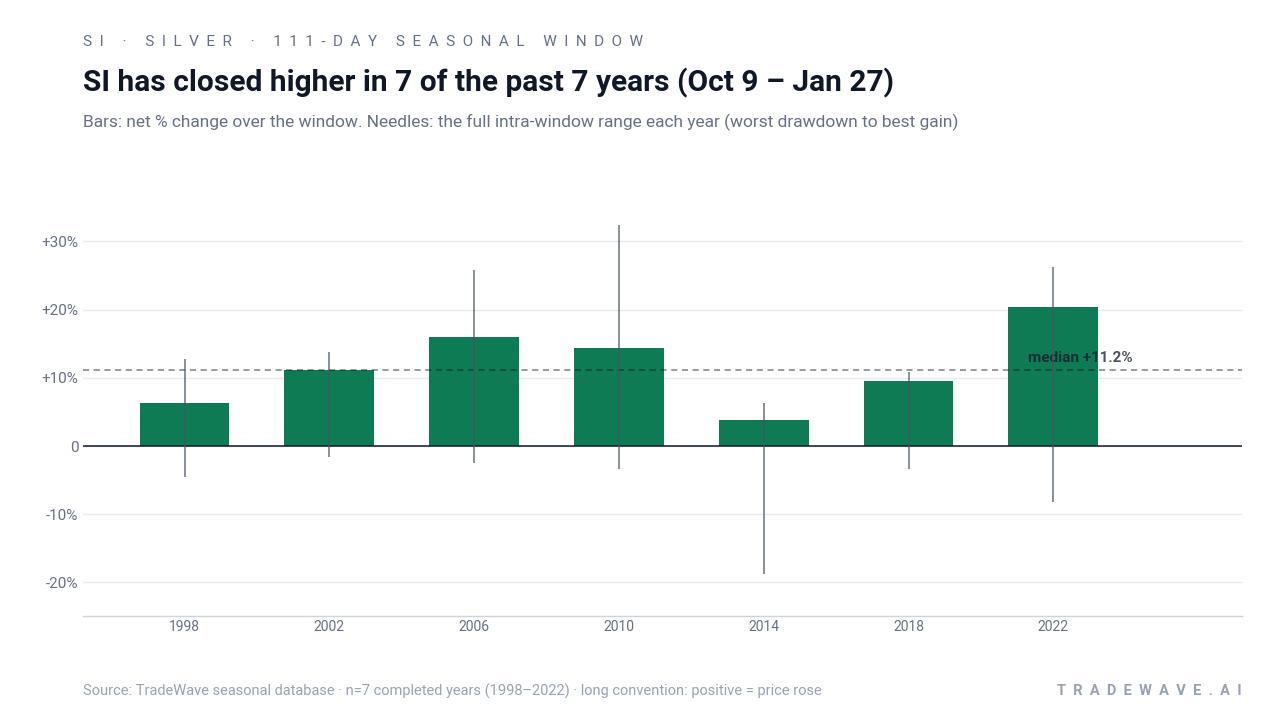
Those bars and ranges make one thing clear: this has been a strong but not gentle window for Silver. Every year finished higher, yet several saw double-digit adverse moves from the entry before recovering, which is typical of a commodity that trades as both an industrial input and a macro hedge.
History does not guarantee future results; adverse excursions (MAE) can be large even in winning windows.
Why does Silver (SI) follow this seasonal pattern?
One likely driver is the way industrial demand and hedging needs ramp into year-end as manufacturers lock in supply and investors rebalance portfolios ahead of the pre-election year. Analysts have also pointed to fiscal and regulatory uncertainty around midterms, which can boost interest in precious metals as a hedge while liquidity conditions remain supportive. This midterm-to-pre-election handoff may help explain why Silver’s Oct-to-Jan window has repeatedly favored long exposure in these specific election-cycle years.
What is driving Silver (SI) today?
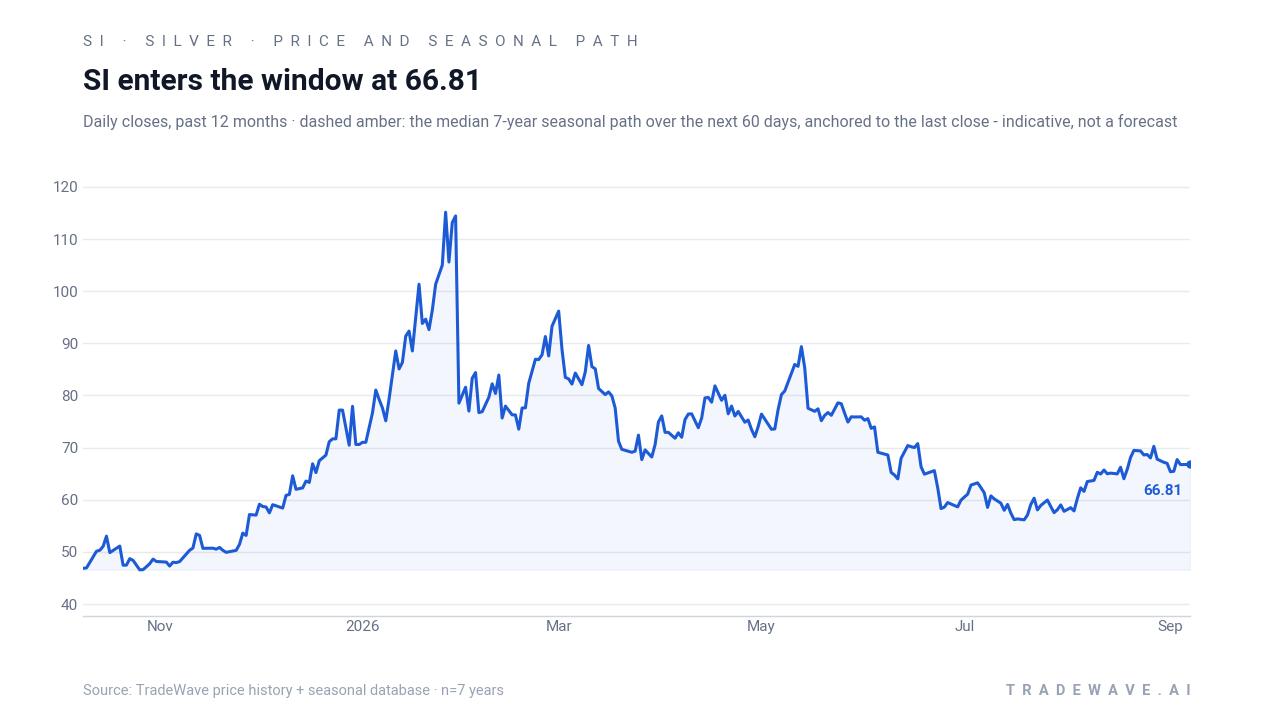
Silver futures settled at 66.72 in the prior session, up 0.64% on the day, leaving the contract well below its 52-week high of 121.79 and above the 52-week low of 47.41. That puts SI closer to the lower end of its one-year range even after a 2.62% gain over the past month, with prices trading modestly above the 50-day moving average of 62.90 and on relatively light volume compared with the 20-day average of about 38,010 contracts.
In May 2026, technical analysts highlighted that Silver had broken above key downtrend lines, arguing that a sustained move could open the door toward higher price zones if follow-through buying emerged.[1] In December 2025, coverage tied Silver’s surge above $60 to AI-driven industrial demand and tight inventories, a theme that still hangs over the market as data-center and electronics buildouts continue.[2] Late December 2025 also brought a reminder of how violent this market can be, with a roughly 33% rally followed by the largest one-day drop in more than five years and then a sharp rebound, underscoring the speculative flows and thin liquidity that can amplify moves in both directions.[3][4]
The chart below situates the latest move in its recent multi-month context alongside the historical 60-day seasonal projection.
What should traders watch as this Silver (SI) window approaches?
First, the calendar: the 111-day window opens on Oct 9, so positioning and volatility in late September and early October will show whether traders lean into or fade the historical pattern. A firm hold above the 50-day moving average and a push away from the lower half of the 52-week range would be more consistent with prior midterm-year winters that turned into strong rallies.
Second, watch macro catalysts tied to industrial demand and policy. Any fresh evidence that AI and data-center buildouts are sustaining elevated silver usage, or that fiscal and regulatory signals ahead of the pre-election year are boosting risk appetite, could reinforce the historical tendency for this window to favor longs.[2] Conversely, a repeat of late-2025 style air pockets, where sharp one-day drops puncture otherwise bullish trends, would be a reminder that even a 7-for-7 seasonal record comes with real drawdown risk.[3][4]
Finally, behavior inside the window will matter as much as the end result. If Silver quickly posts a strong maximum favorable move with only shallow drawdowns, it would echo the cleaner years in the sample and suggest that the long seasonal bias is asserting itself again. If instead the contract spends weeks chopping with deep adverse excursions and only modest net gains, it would still fit the pattern statistically but feel very different to trade in real time. Either way, this specific Oct-to-Jan stretch has a track record that makes it one of the more consequential seasonal windows on the Silver calendar.
Sources
- Reuters - Mapping the Market: Silver prices may be on the road to recovery
- Business Insider - Silver's break above $60 underscores a frenzy where traders are grabbing 'whatever scraps' available
- Seeking Alpha - Silver prices easing back after breakneck December gains
- Yahoo Finance - Silver Rises After Biggest One-Day Drop in Over Five Years
About this seasonal analysis
Seasonal pattern data is sourced from TradeWave.ai, which analyzes historical price behavior across annual calendar windows going back up to 30 years. Read the full data methodology or the book The 100-Year Pattern by Afshin Moshrefi (2026 edition). Past performance of seasonal patterns does not guarantee future results. This article is for informational purposes only and does not constitute investment advice.